

Exploring data
Preview your data and ask Autopilot questions about them
Introduction
With the data collected and prepared, it's time to start learning from it. In this guide you'll look inside a dataset, ask Autopilot questions in plain language, and generate your first chart — no formulas, no query building.
This guide continues from Prepping data.
Preview any dataset
The quickest way to see what's inside a dataset is to double-click its node on the canvas. A preview panel opens showing the dataset's columns and a sample of its rows, along with a Download button if you want a copy.
Try it: double-click the Superstore dataset node. You'll see the sales data exactly as it was collected.
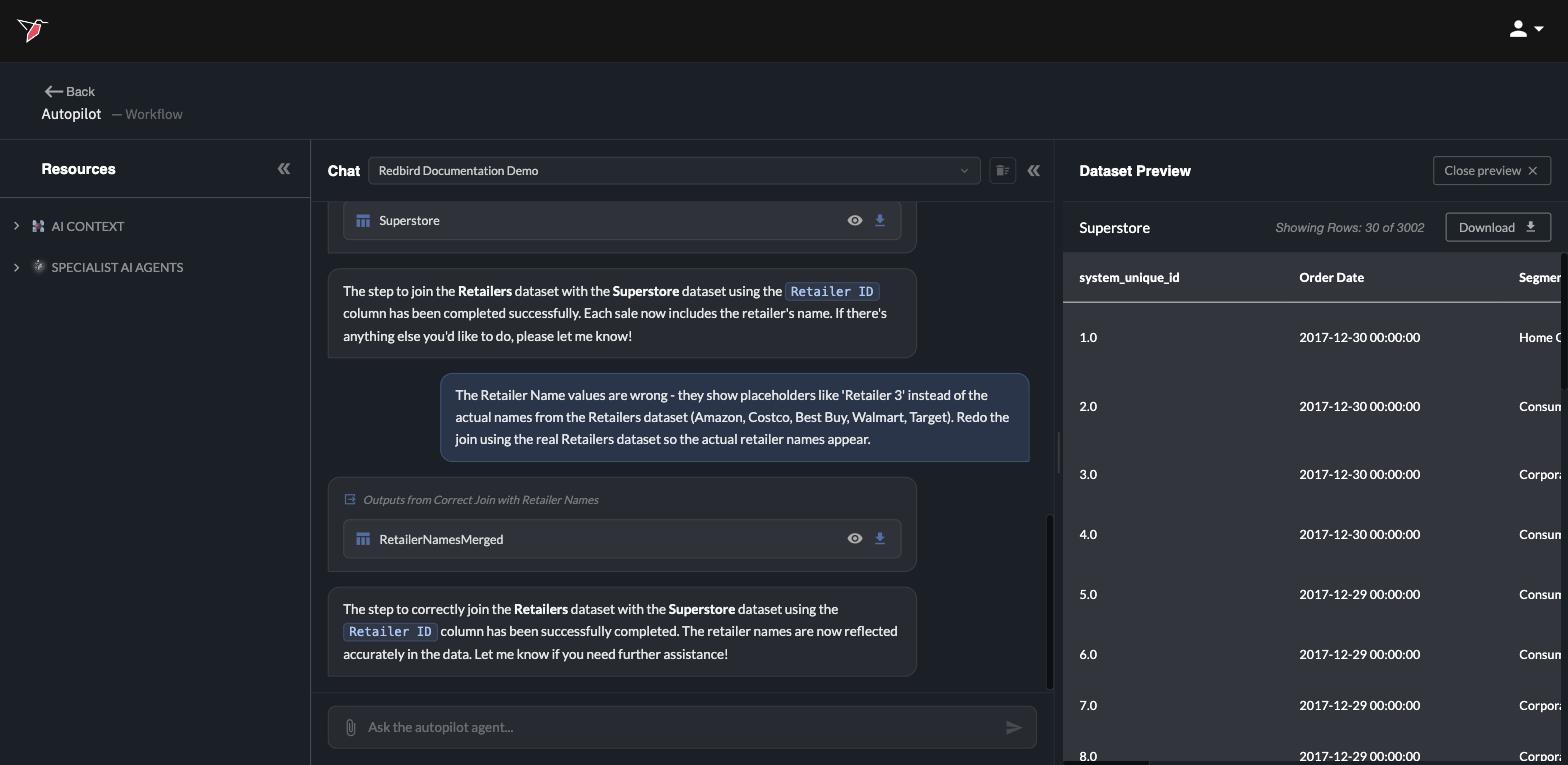
Click Close preview in the top-right corner of the panel when you're done looking.
Ask questions in plain language
You don't need to scan thousands of rows to answer a question — just ask Autopilot. In the message box, type:
Which retailer had the most sales?
Autopilot analyzes the prepared data and answers directly in the chat.
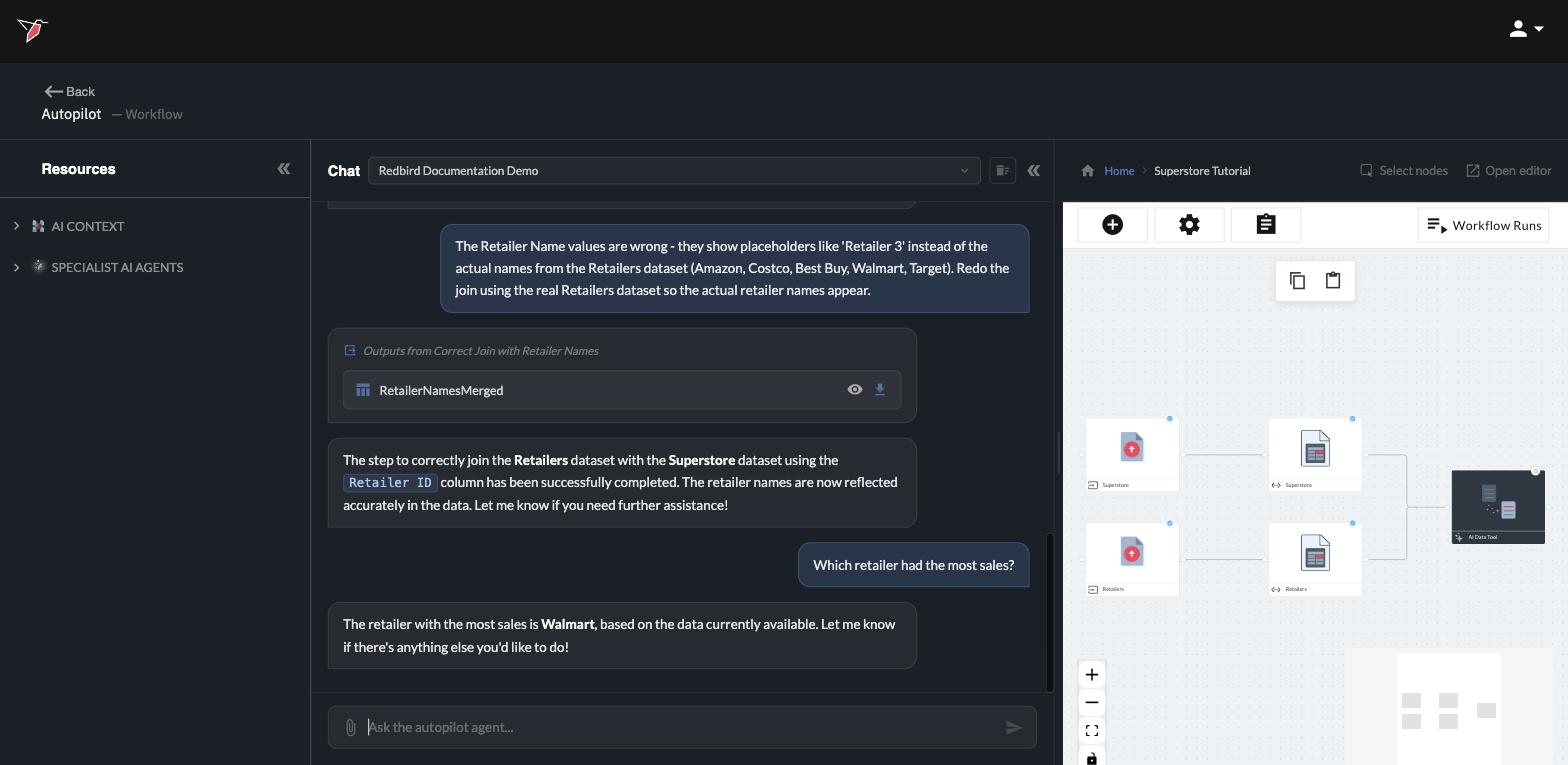
You can keep the conversation going with follow-ups — compare regions, look at specific time periods, or drill into a category. Autopilot works with the latest version of your data based on the most recent workflow refresh pipeline, including the retailer names you added in the previous guide.
Generate a chart
Some answers are easier to see than to read. Ask for a visualization:
Show me total sales by retailer as a chart
Autopilot builds the chart and shares it right in the conversation.
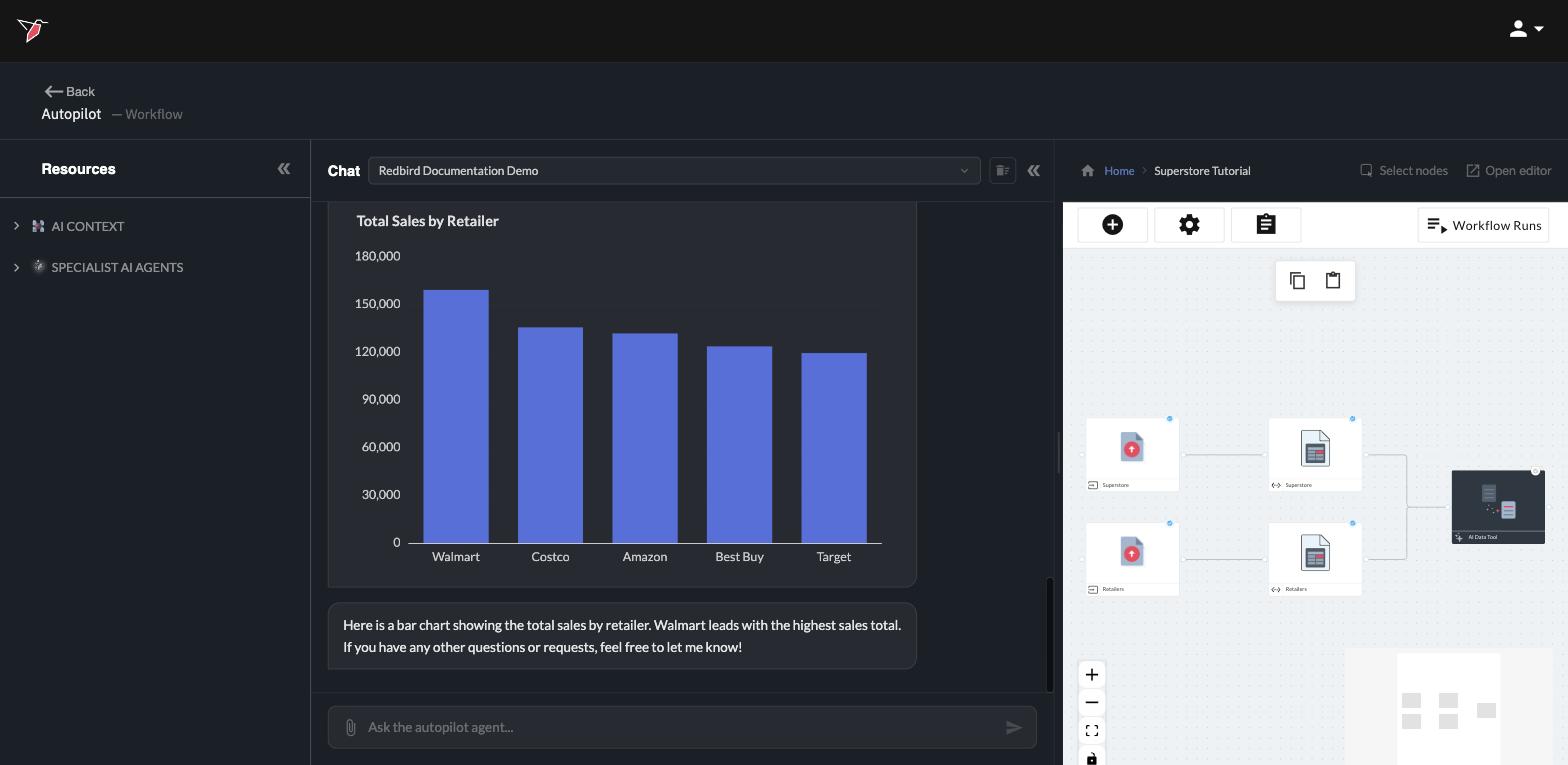
Charts in the chat are for exploration. They're perfect for quick answers and one-off questions. In the next guide you'll go a step further and have Autopilot assemble a full, polished report from this same data.
What you built
You can now look inside any dataset with a double-click, get answers by asking questions in plain words, and turn those answers into charts. Next, turn this analysis into something you can share: continue to Building a report.
Updated 4 days ago