Managing Redbird Datasets
Introduction
Once you have a dataset in Redbird, you can now explore and analyze your data, process or transform it further as needed, and create analytical outputs. You’ll also have the ability to organize, manage, and manipulate your datasets within the platform.
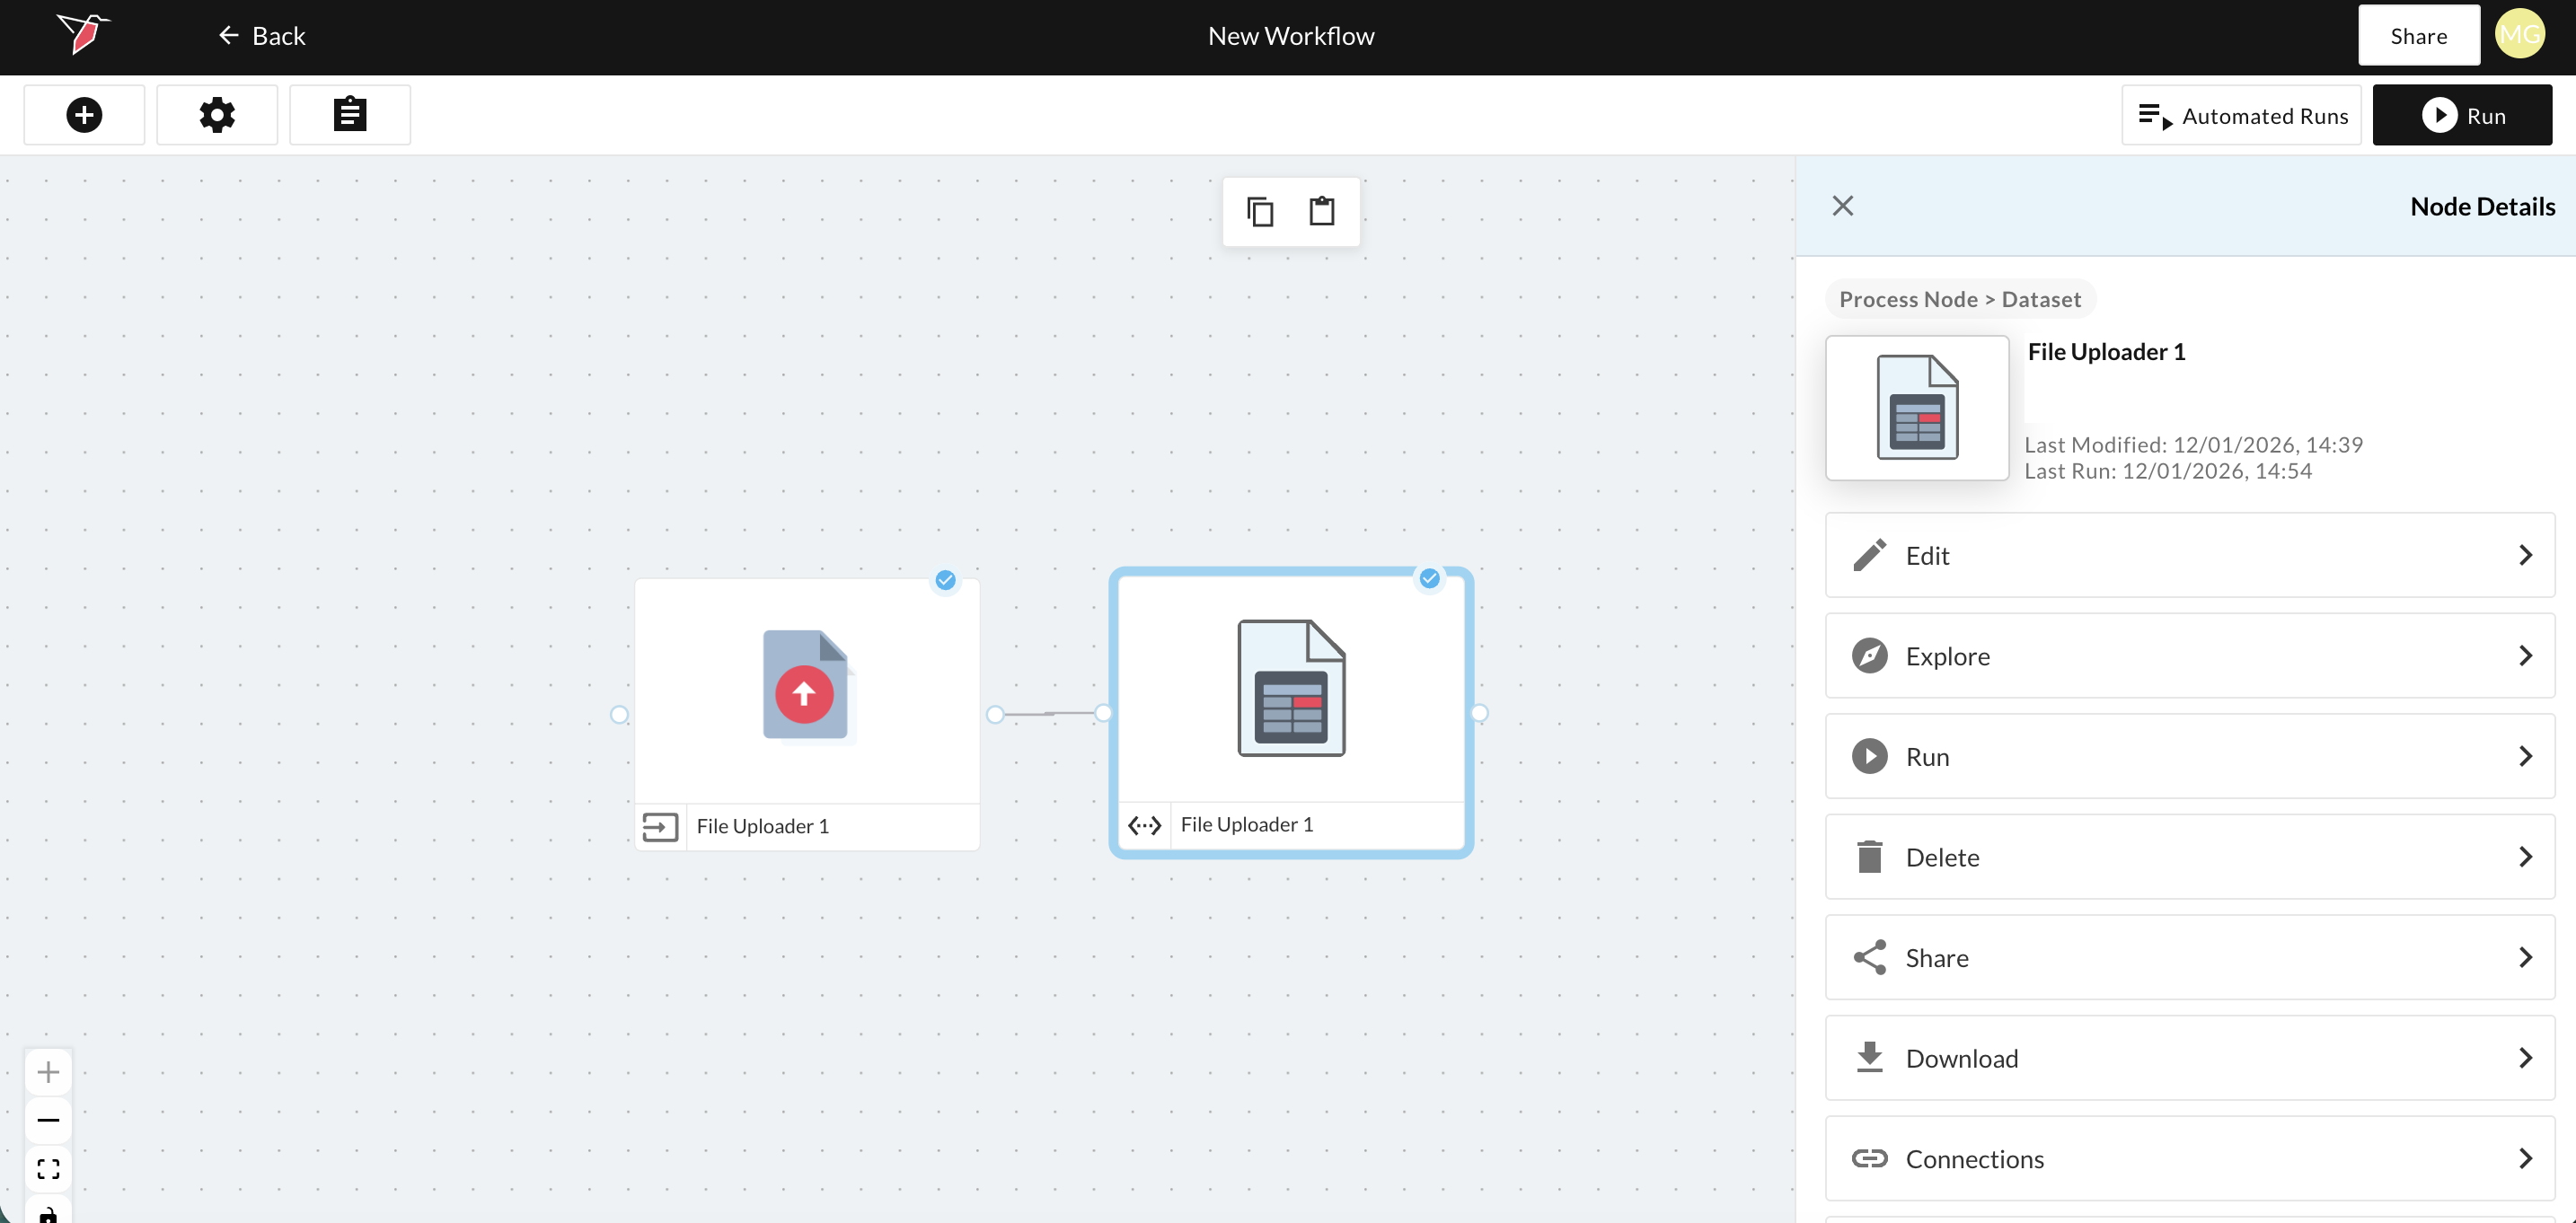
To access any of the actions related to your dataset, navigate to the canvas where your dataset is located and click on the dataset node to bring up the right-side panel, which contains the node details.
Editing Your Dataset
- Clicking Edit (or double-clicking the node) will take you back to the dataset generation step, where you can reconfigure the dataset. See here for details.
Exploring Your Dataset
- Clicking Explore allows you to quickly analyze your dataset by viewing it in tabular form, reviewing summary statistics, running pivots, identifying correlations, or downloading a copy of your data. For more information on how to explore your dataset, please refer to our documentation on Exploring Datasets.
Administering the Dataset
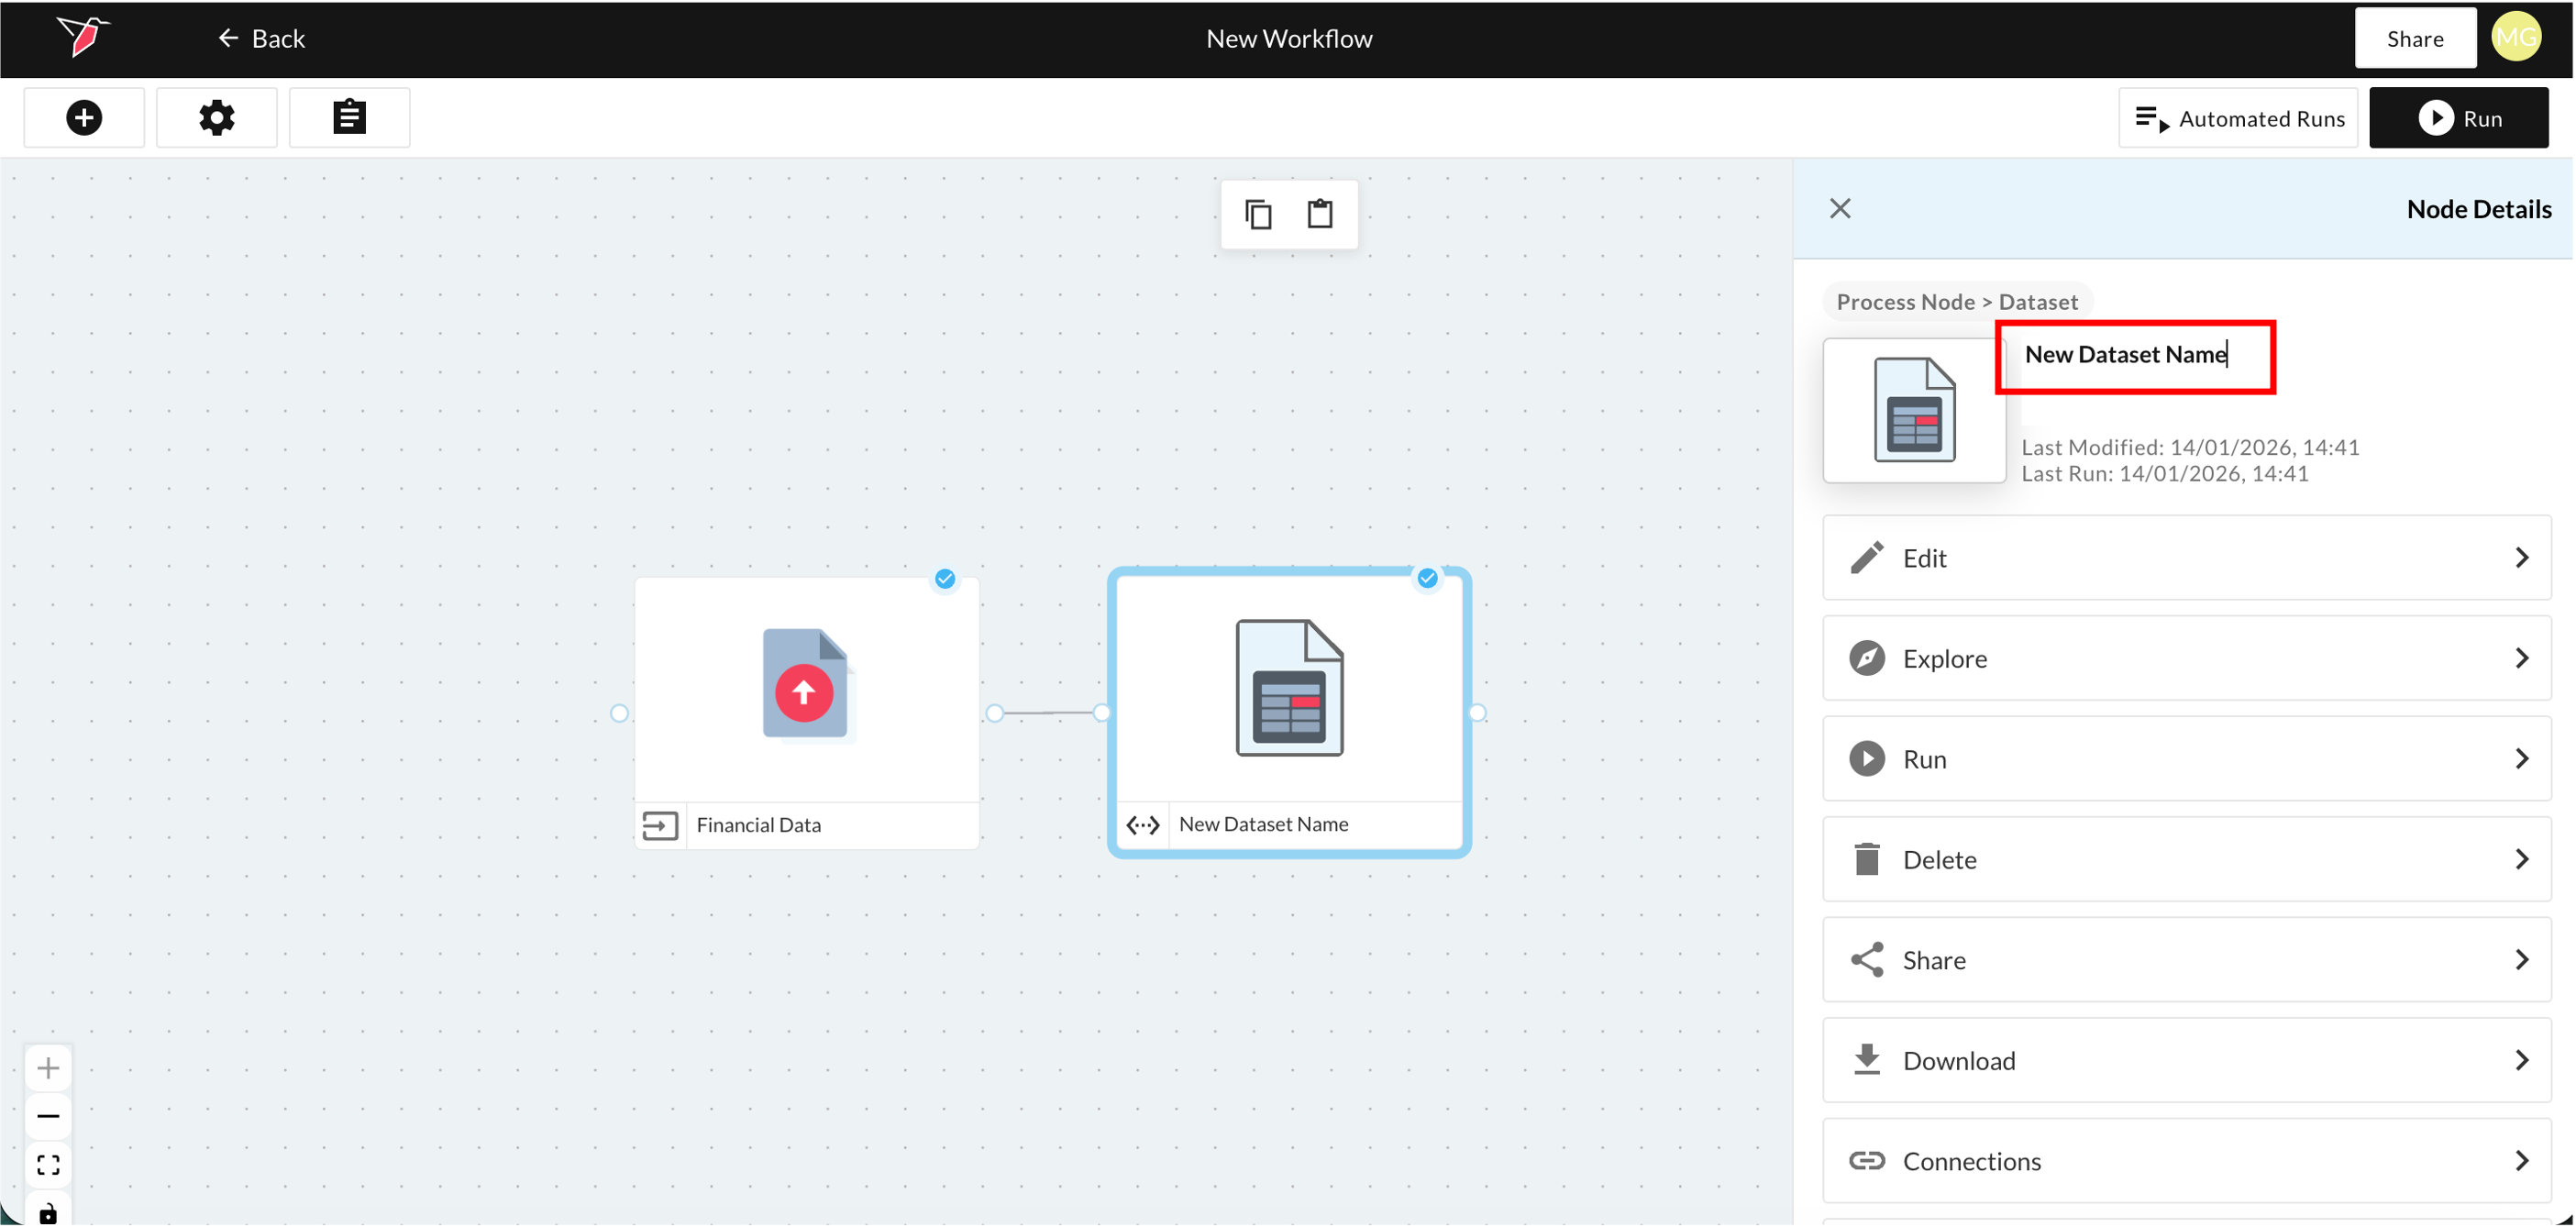
- Rename the dataset by clicking on the dataset name in the right-side panel and overwriting with the new name.
- Download the dataset as a CSV file by clicking Download.
- Delete the dataset if it's no longer required by clicking Delete.
- Manage access by clicking Share to control which other Redbird users can access this dataset. See here for more information on sharing nodes and workflows.
- Create or edit column groups to enable analysis of related columns as a single variable. To manage column groups, click Column Groups in the right-side panel. For more details, see our Column Groups documentation.
- View Details lets you see the datatypes assigned to each column.
Running the Workflow on the Dataset
- Click Run to run the workflow and update the dataset with any new data from your collections. For more information about workflows, refer to our workflows documentation.
Viewing the Connections
- View Inputs and Outputs: Toggle between the Inputs and Outputs tabs to see all nodes connected to the current object.
- Visible vs. Hidden Objects: Connections are grouped into Visible (present on the workflow canvas) and Hidden (not currently shown).
- Hide or Unhide Objects: Use the eye icon on the right to hide or unhide connected objects from the workflow canvas (available for certain object types).
- Explore Objects: Click the Explore icon (compass) next to any connected object to open it and view its contents or details.
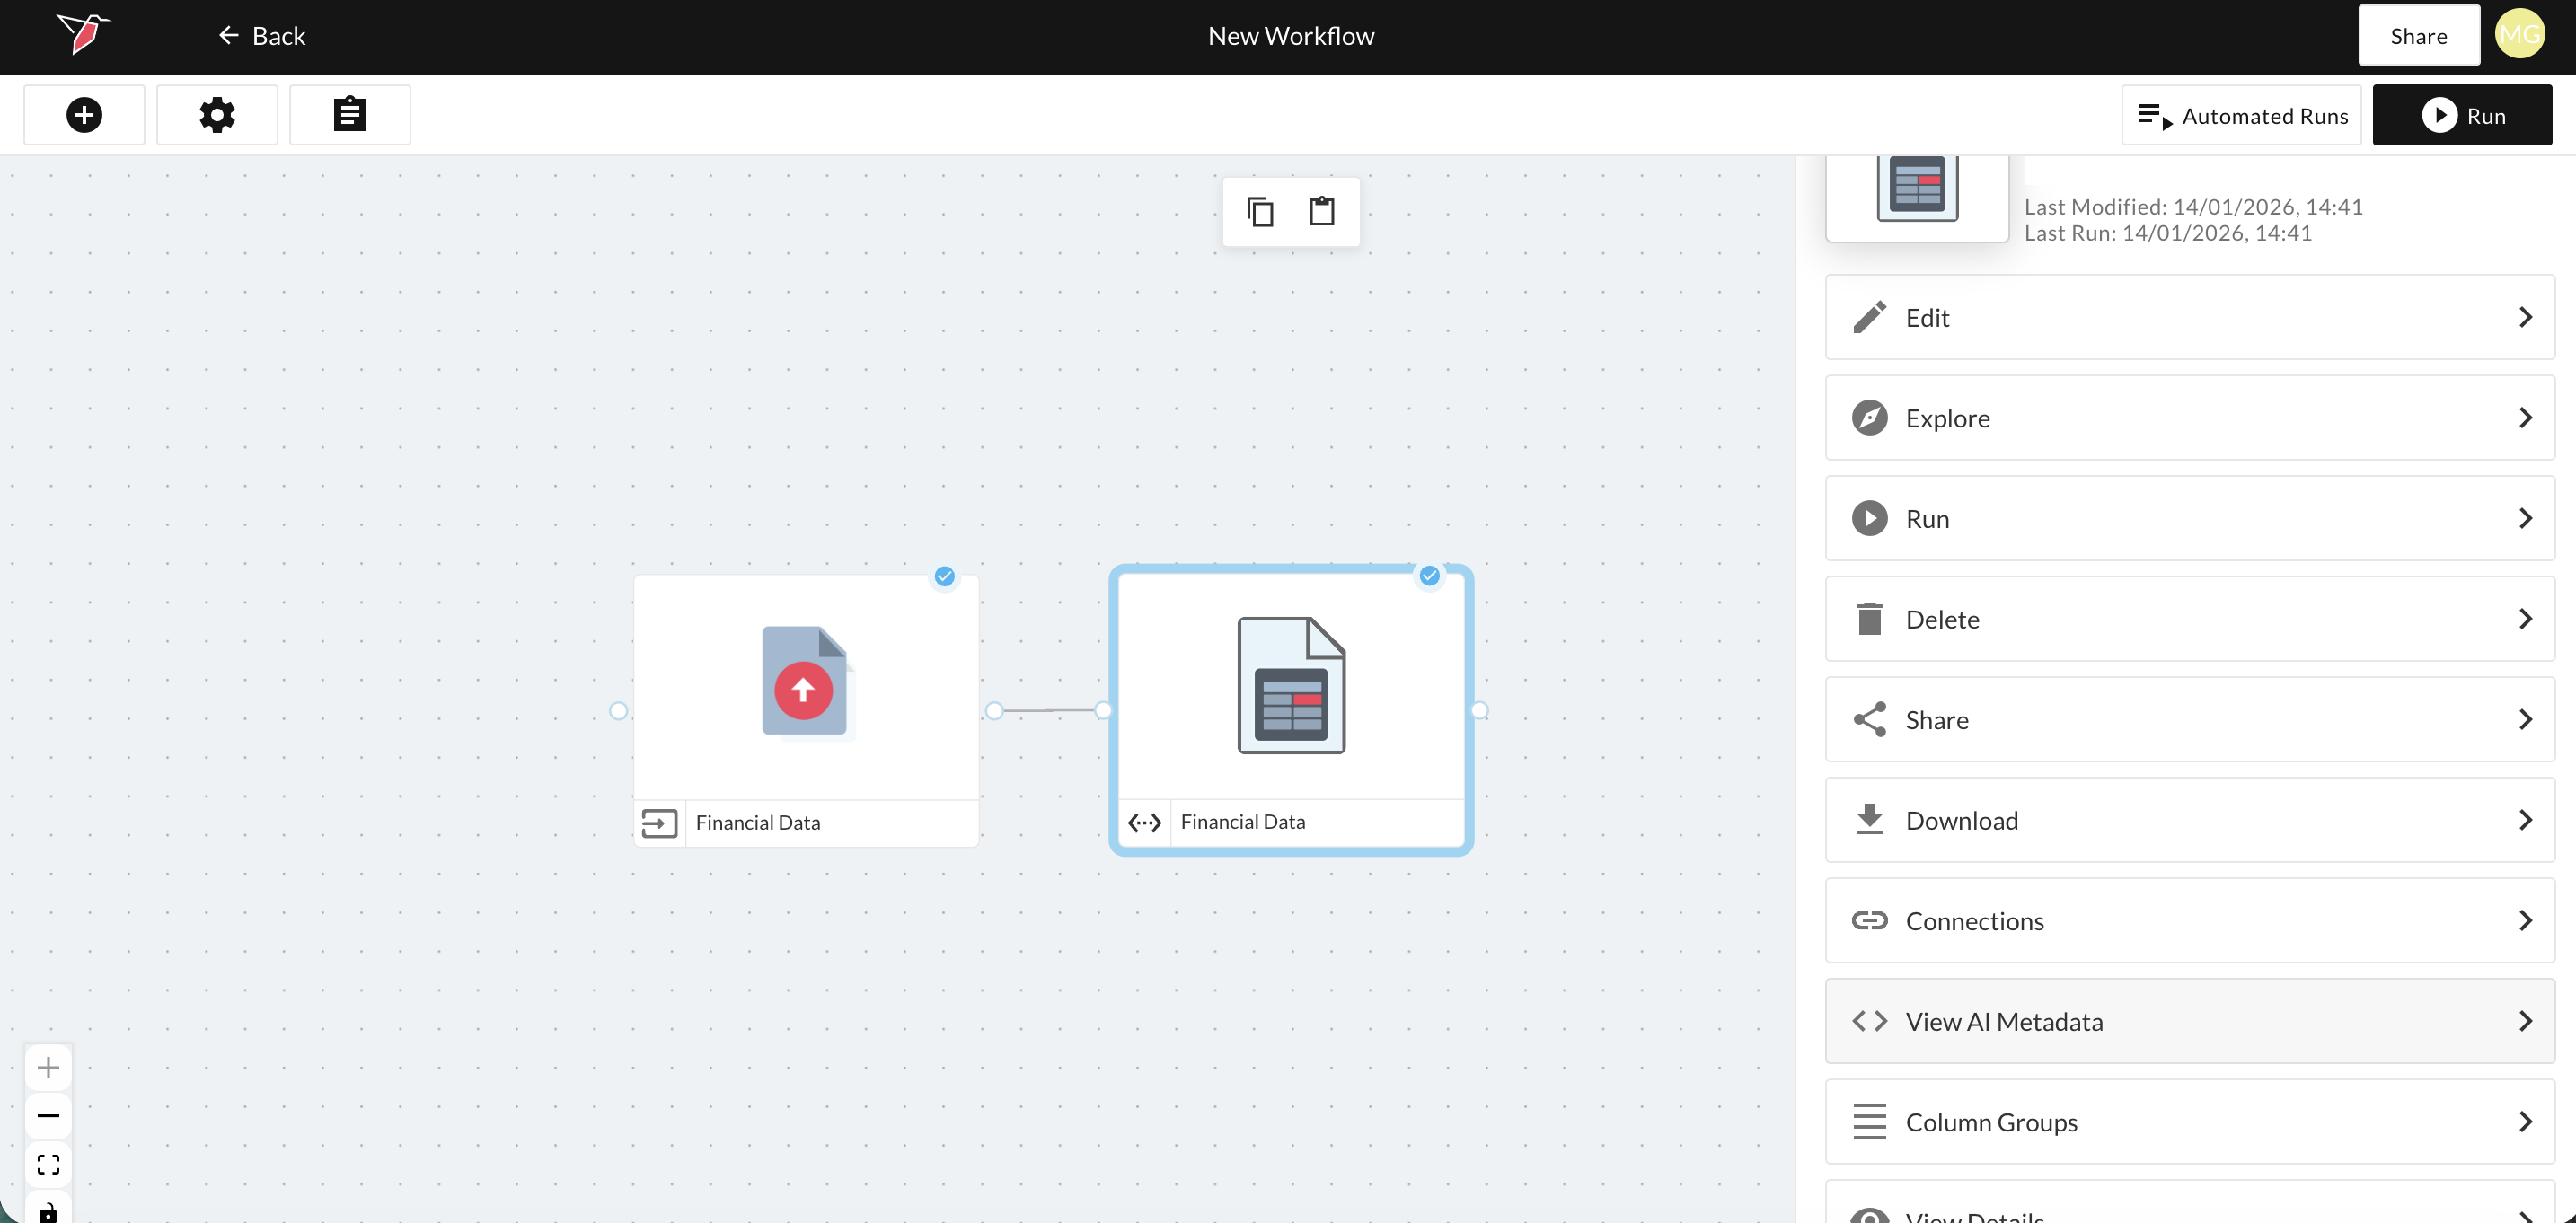
AI Metadata
Once a dataset is generated, Redbird uses AI to scan its contents to understand the type of data included in each column as well as the dataset overall. Based on this analysis, Redbird generates descriptive metadata. This metadata enables the dataset to be leveraged downstream in other AI-driven processes, such as AI Chat.
You can view and edit this metadata by selecting the dataset and clicking View AI Metadata in the right-side panel.
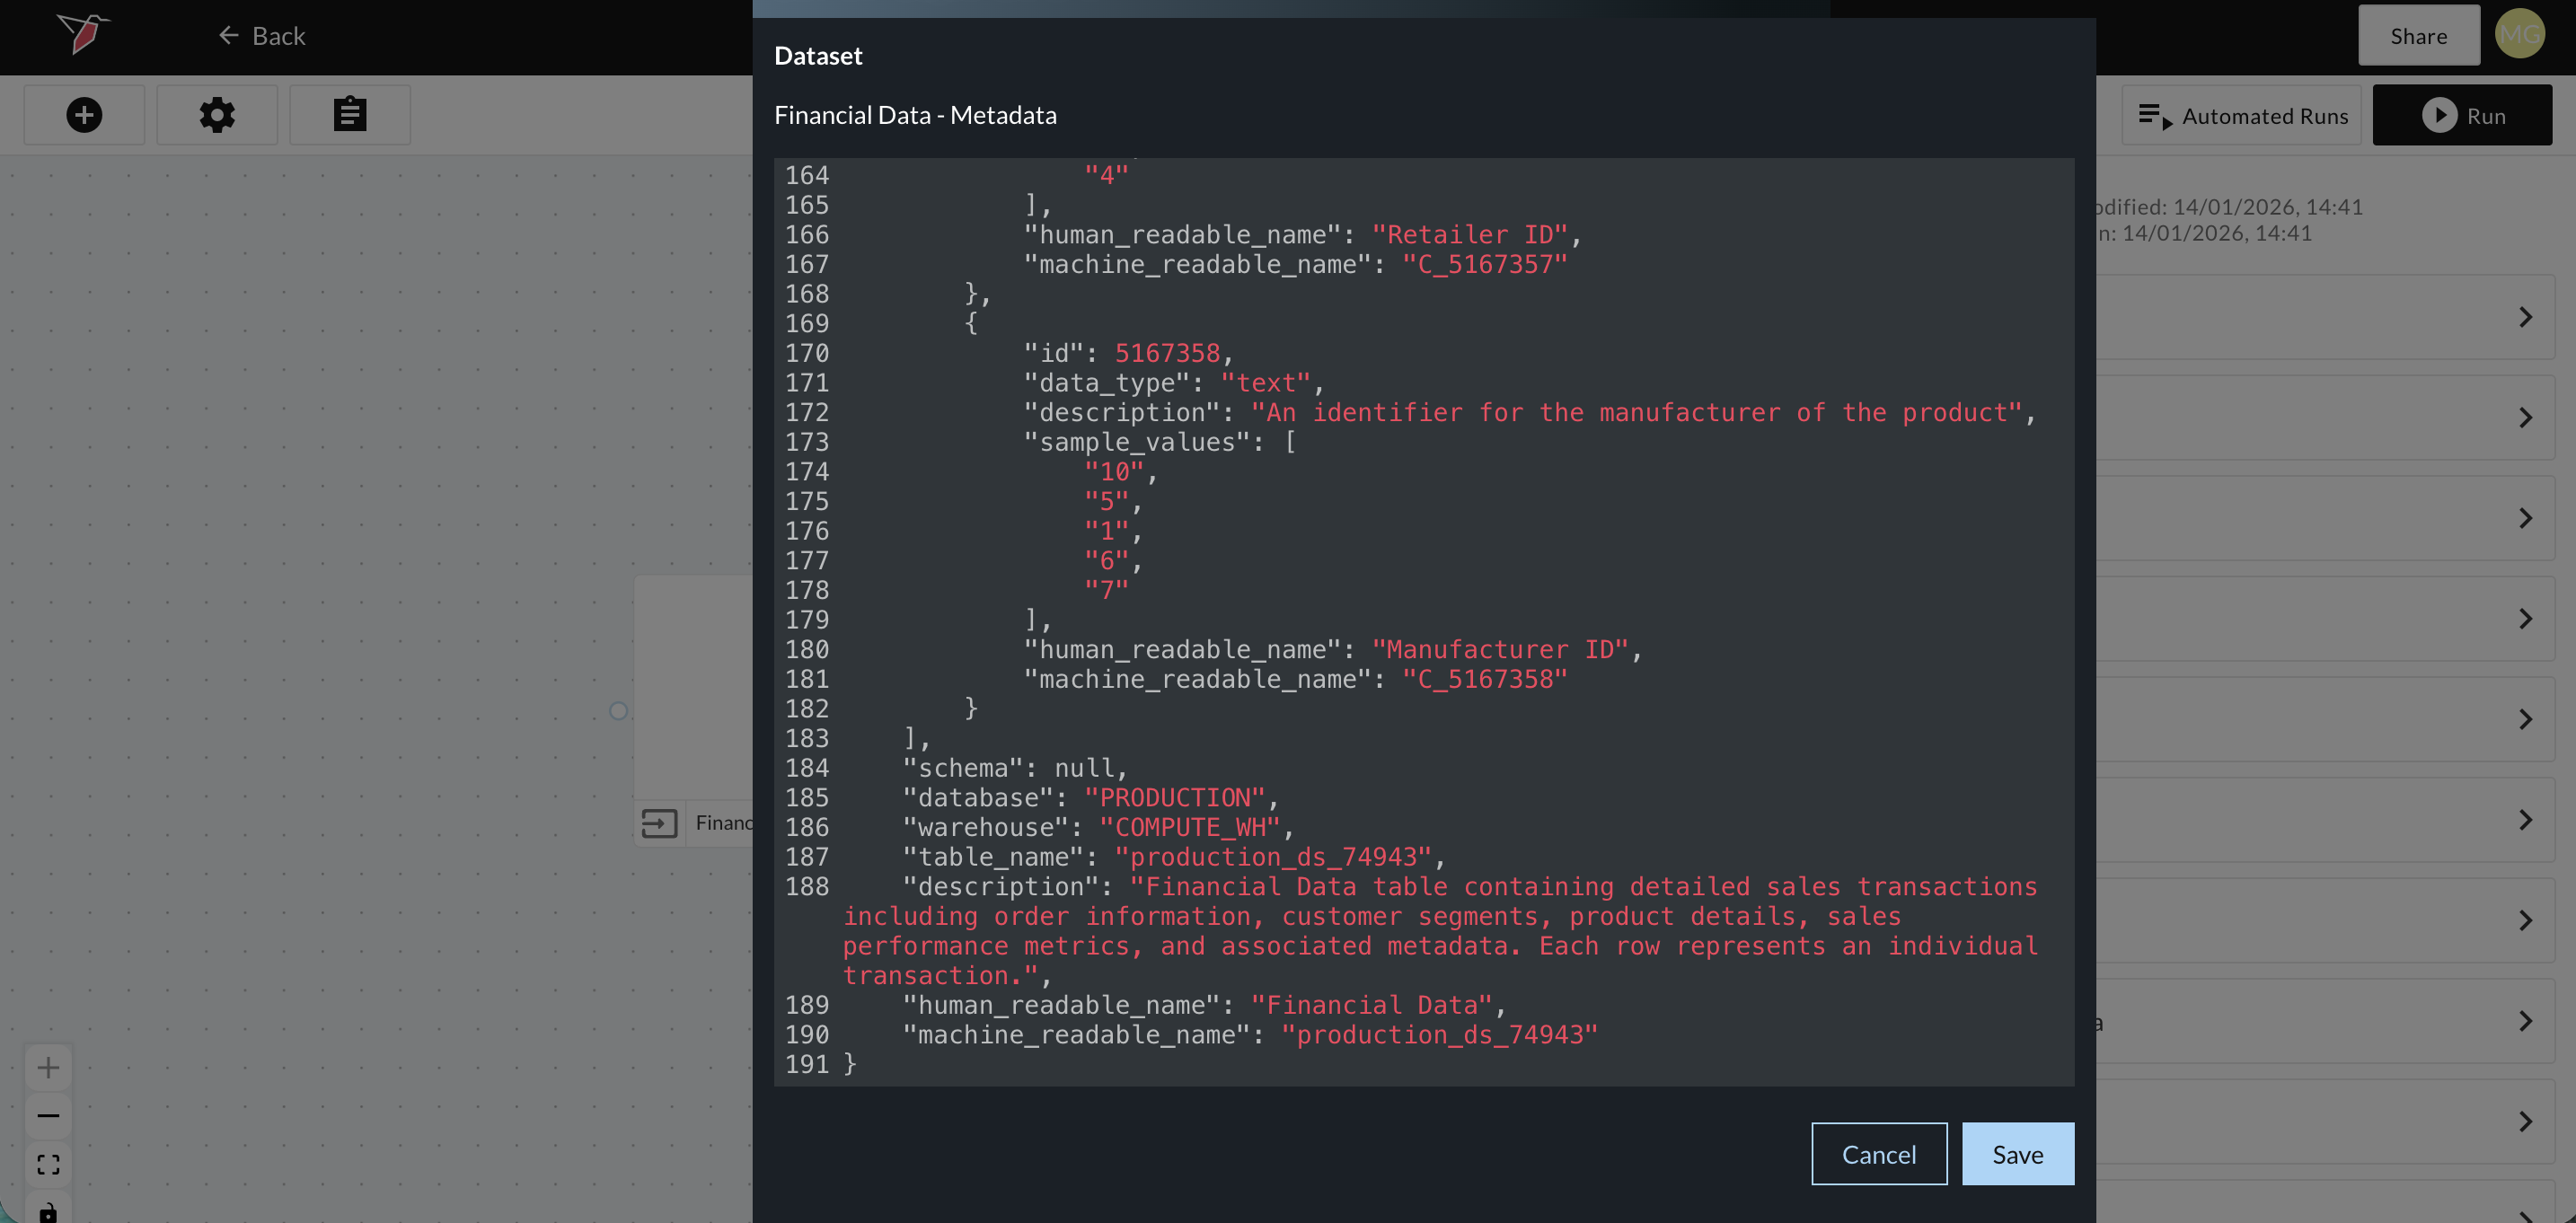
A modal will appear displaying the metadata in JSON format. You may edit any of the fields highlighted in red if needed, then save your changes. Be sure that any edits continue to adhere to valid JSON formatting.
Process Your Dataset
You can process your data to create an analytical output. Redbird allows you to process and transform your data in a variety of ways, including cleaning, transforming, tagging, and deduplicating. In addition, you can analyze your data by running statistical analyses or data science models. You can do all of this either through our point-and-click, no-code interface, using Macros or using AI driven natural language inputs via our AI Data Tool node.
If no further processing is needed you can also connect this dataset directly to an output such as a Dashboard, AI chat etc. Documentation on all output types can be found in the Output section of the Redbird documentation.