Identify Trends Operation
Overview
The Identify Trends operation leverages text analytics to automatically identify topics that are trending within unstructured text data over a specified timeframe. This operation is useful in scenarios where you don’t know which specific topics you want to measure and need to organically uncover the growing or contracting topics with the greatest velocity in the absence of a hypothesis.
How It Works
To explain how the Identify Trends operation works, we are going to walk through an example using data from a fictitious superstore that sells a variety of products.
The data below was uploaded into the Redbird Platform and contains twelve columns including a Product Name column with product descriptions in longer-form text format. Each row in the dataset represents a product sale on a specific date.
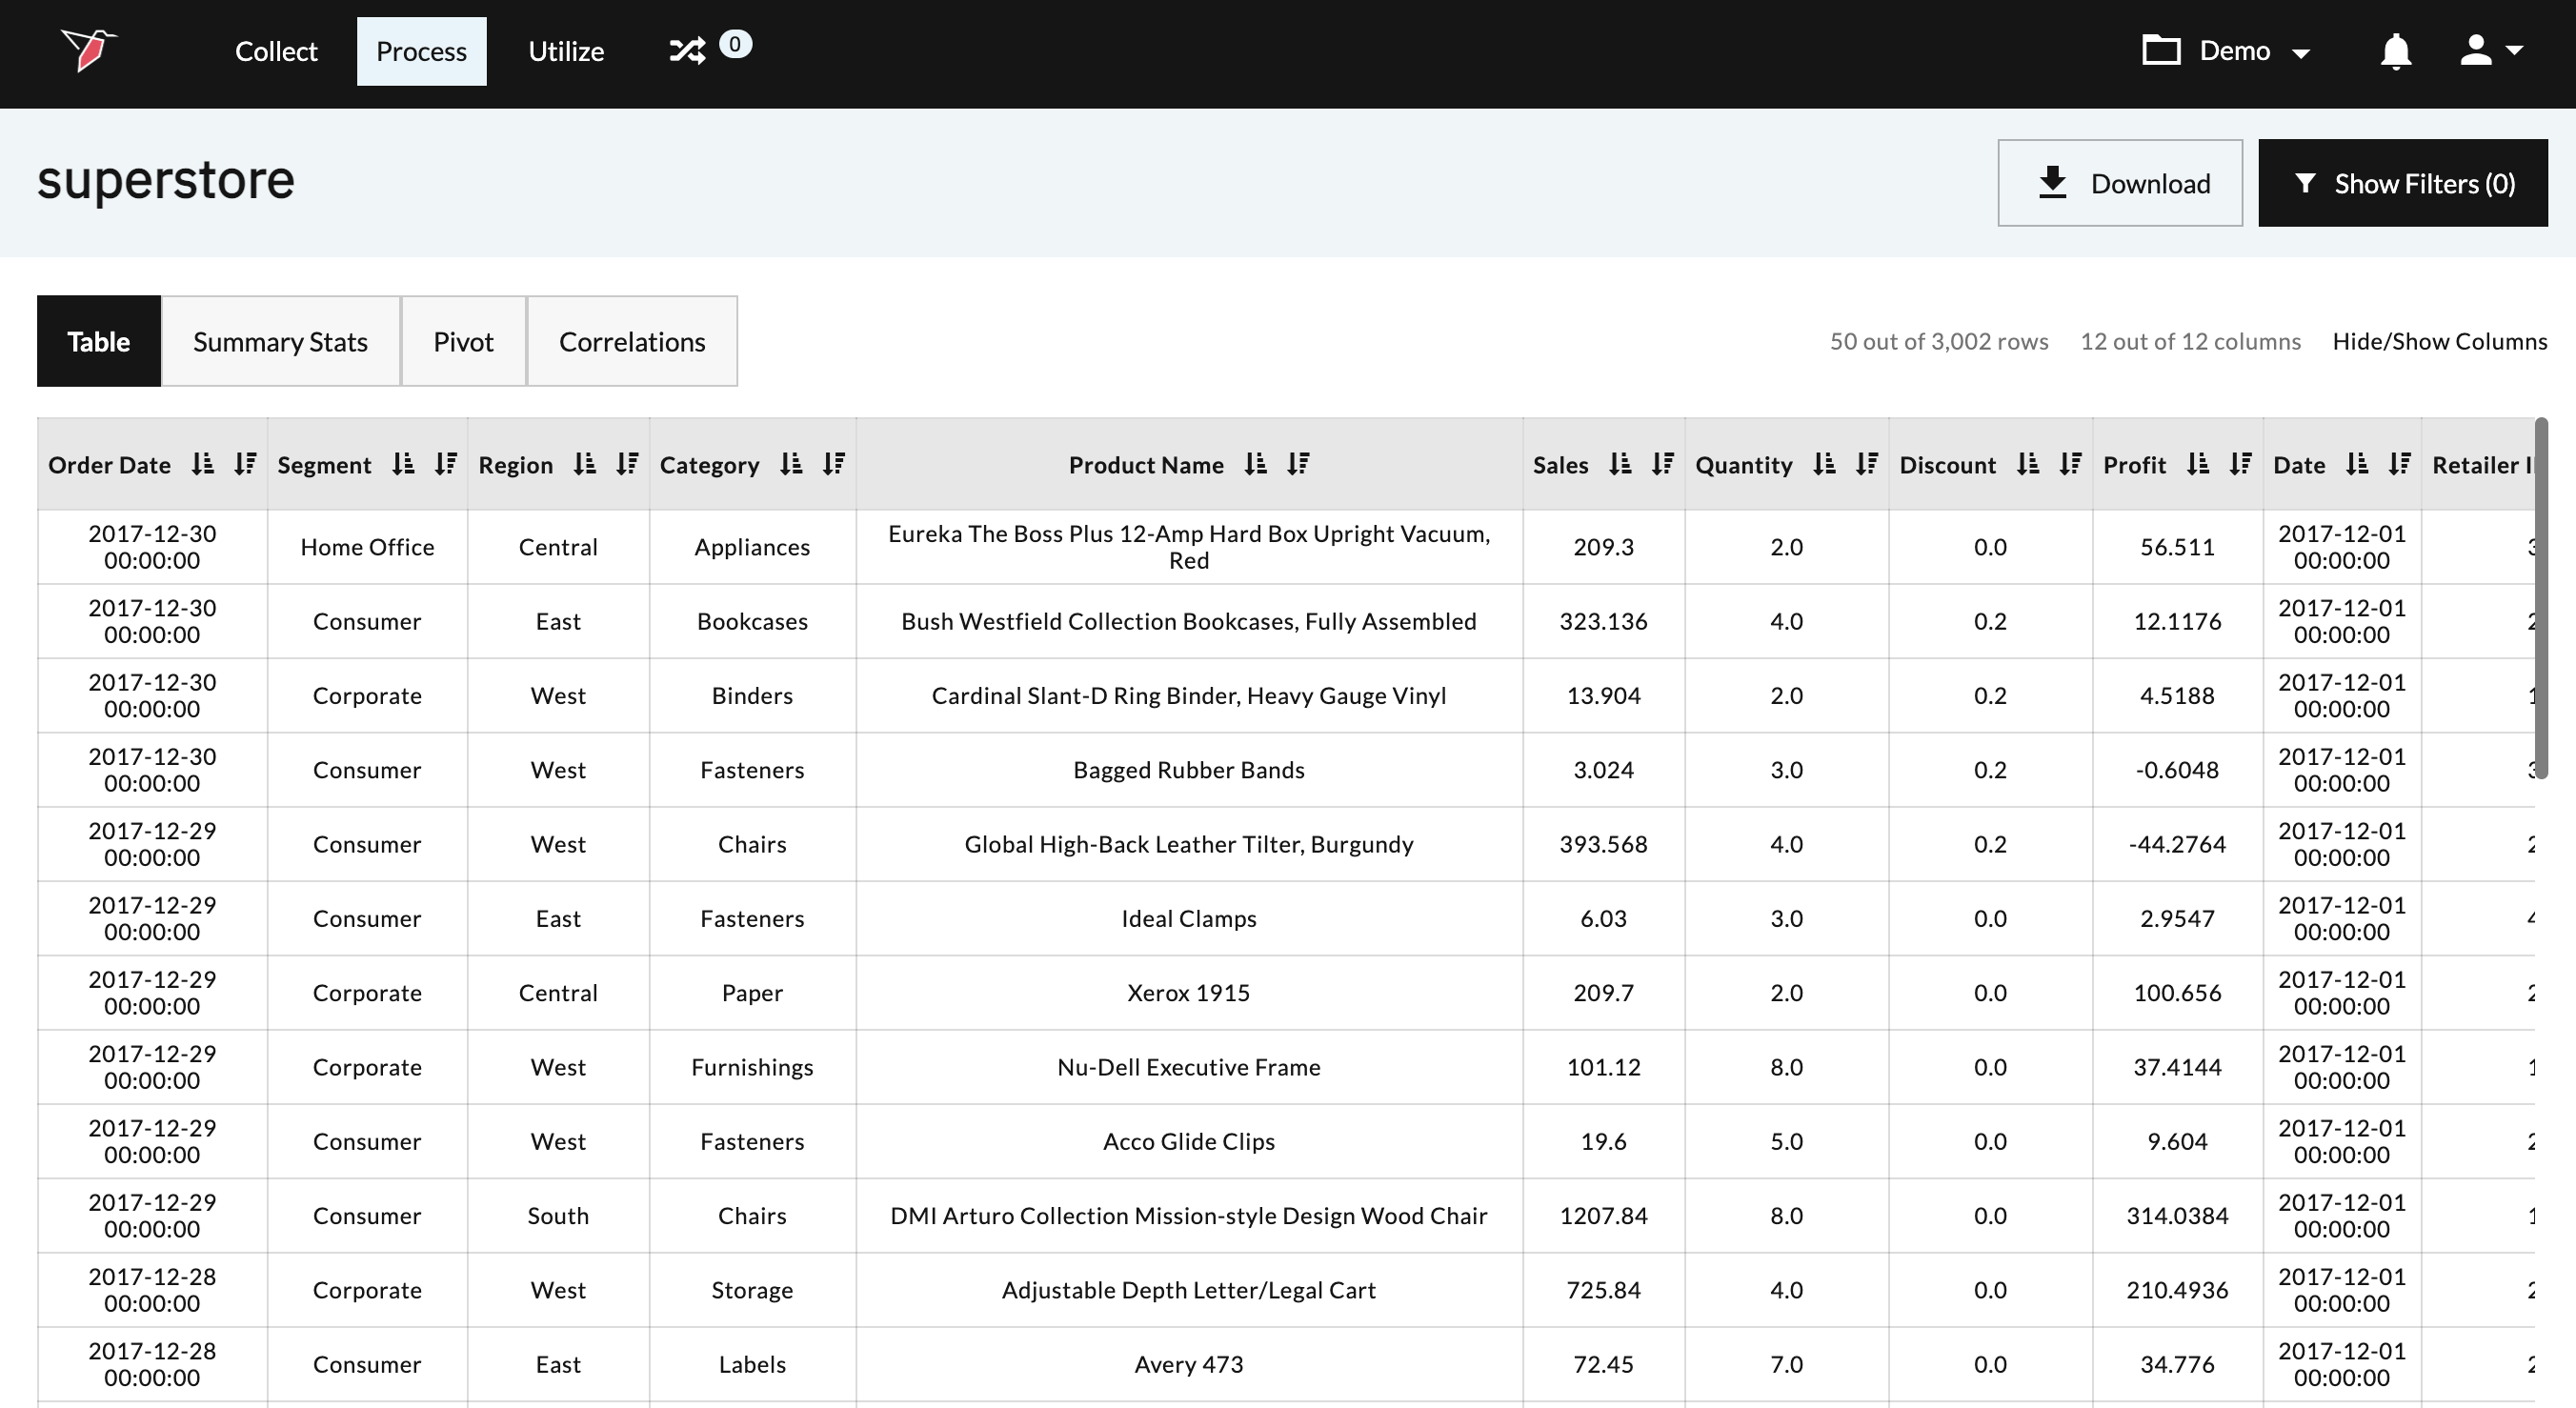
In this example, we would like to analyze the unstructured text data in the Product Name column to organically identify keywords that are growing/contracting with the highest velocity over a specific timeframe. To run our analysis, we will use the Identify Trends operation, which can be found within the Macro Operations Library at Analyze > Identify Trends.
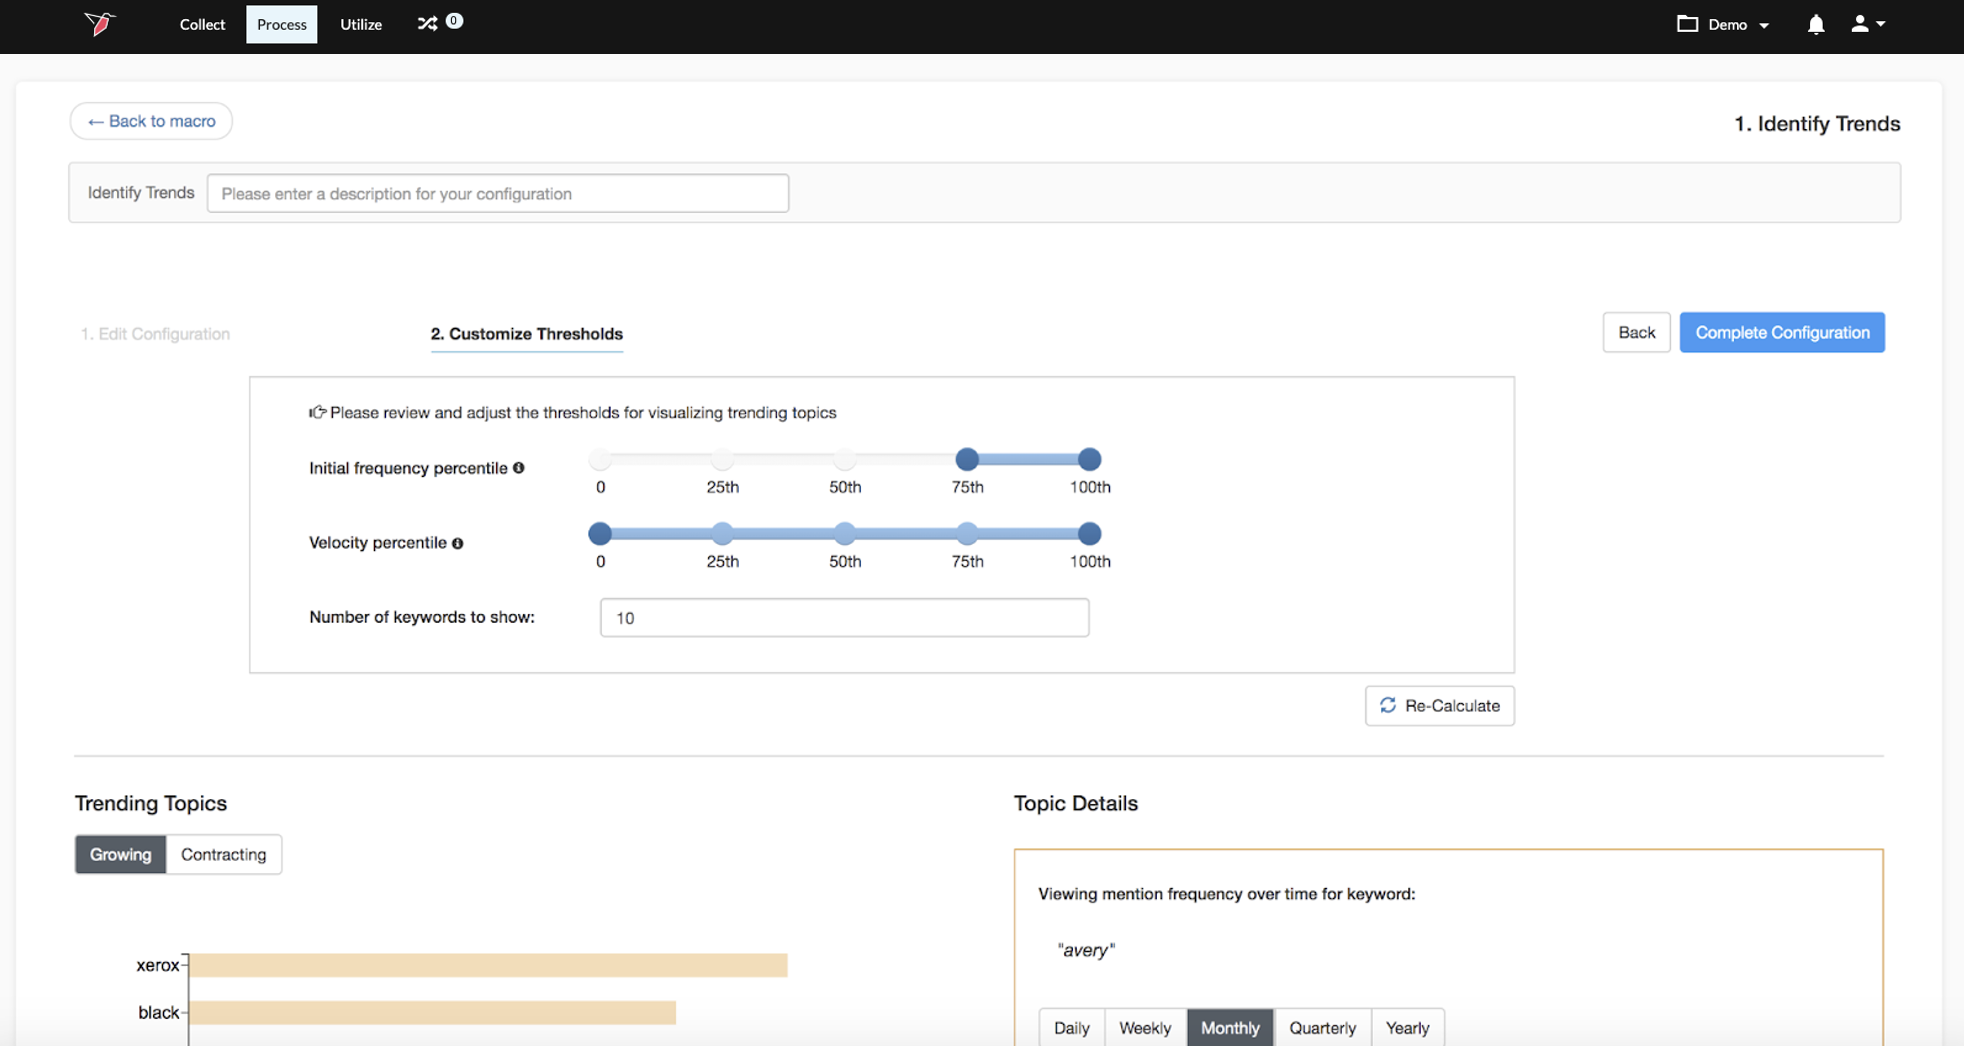
The screenshot below provides an example output from our Identify Trends operation after it has run.
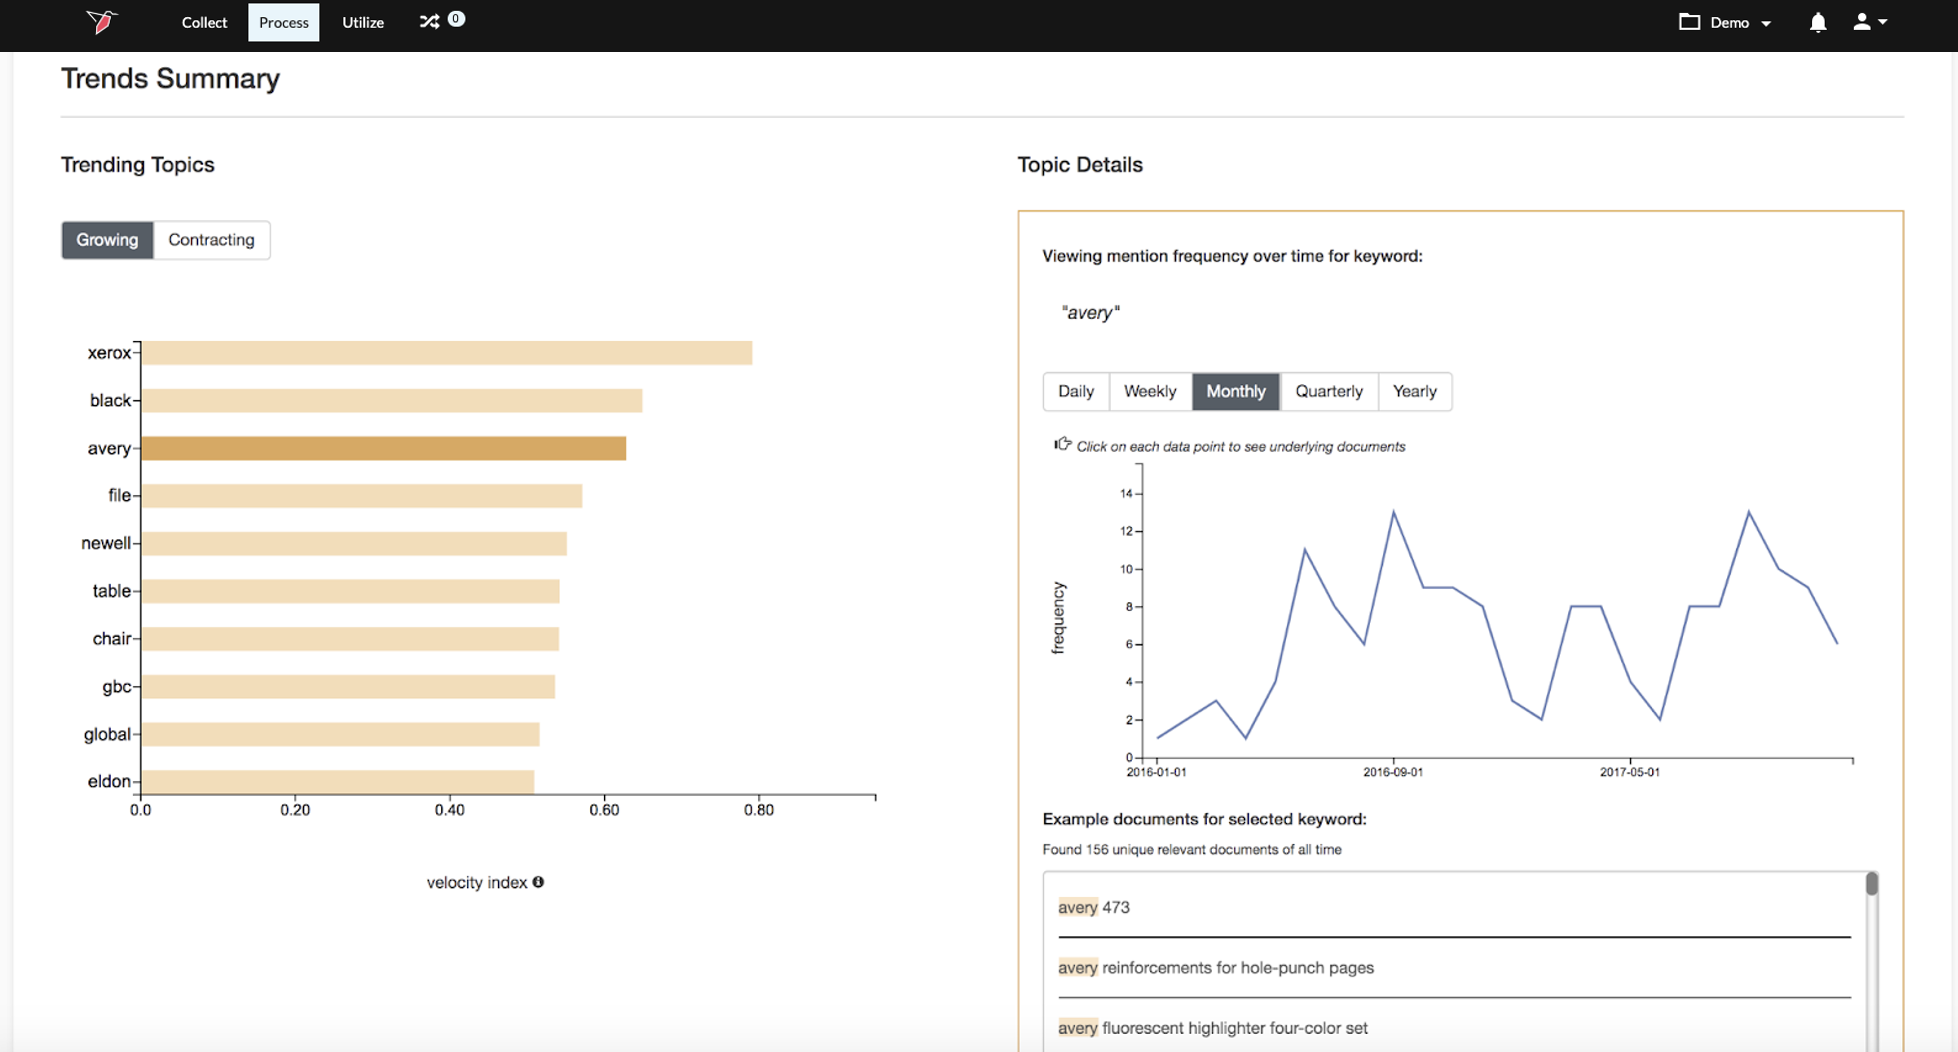
On the left side of the view, we see a bar chart showing the top Growing and Contracting topics, which you can alternate between by clicking on the toggle buttons above the bar chart.
You can see additional details for any individual topic by clicking on its topic bar in the chart, which will bring up more information under the ‘Topic Details’ pane on the right side of the screen. Within this pane you will see a line chart showing the frequency of mentions for the topic over time and examples of documents that contain the
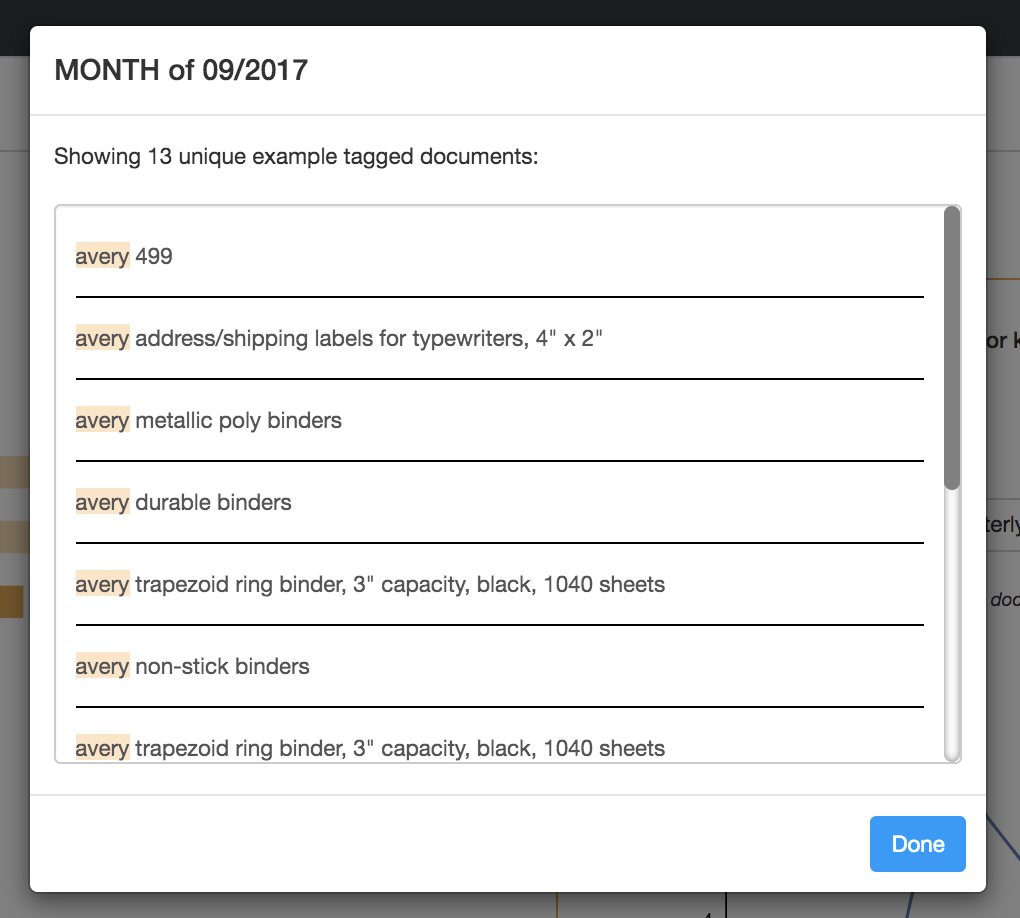
topic. You can also toggle between different granularity levels on the trended line chart by clicking on the desired level (e.g. Weekly, Monthly, etc.). If you would like to see which specific documents are driving a particular point on the trendline you can double-click any data point on the line, which will launch a modal with the example documents.
When you run the Identify Trends operation, the top growing/contracting topics that are identified will be used to tag each document in your dataset. This will result in new columns appended to the dataset, with each column representing one of the growing/contracting topics and the values within those columns indicating whether the document in each row contained that topic or not.
Configuration
To configure the General Clustering operation, we are going to use the example from the “How it Works” section.
- First, click Edit on the Identify Trends operation within your Macro Builder canvas.
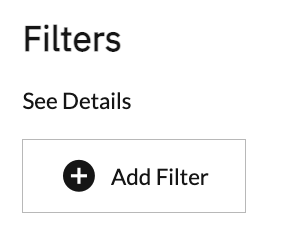
- If you would like to pre-filter the data before running your clustering, add any desired filters in the Filters section of the configuration screen.
- Configure your general parameters for the operation as seen below:
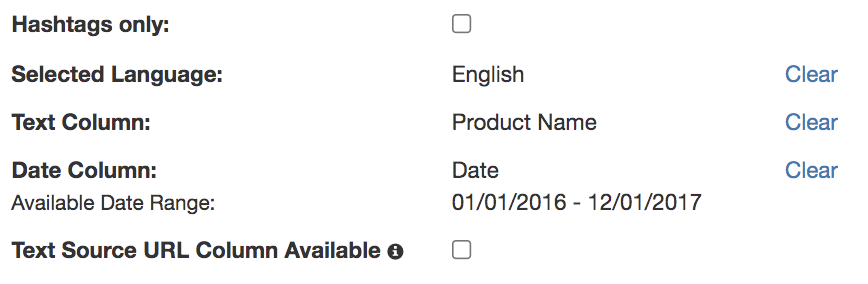
- Hashtags only: Check this checkbox if you are analyzing social media posts and would like to identify trending topics only based on keywords preceded
by a hashtag (#) - Selected Language: The language of the text in your Text Column
- Text Column: The column in your dataset containing the text documents to analyze
- Date Column: The column in your dataset containing the dates for the text documents being analyzed
- Text Source URL Column Available: If you have a URL column that points to native representations of the text documents (e.g. link to post on a social media site or reviews site), check the box next to Text Source URL Column Available and select the column from the dropdown that appears next
- Hashtags only: Check this checkbox if you are analyzing social media posts and would like to identify trending topics only based on keywords preceded
- Configure the time periods for the trend analysis:
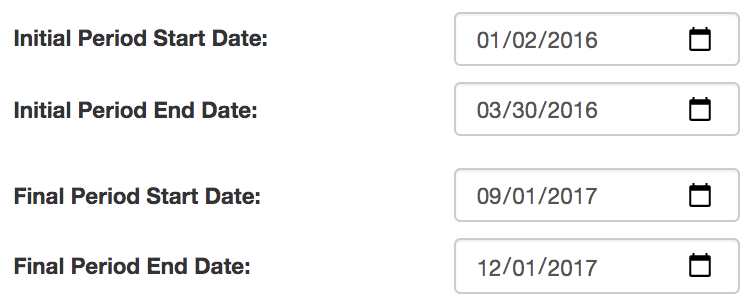
- You will need to select two time periods to use as the basis for comparison when identifying which topics have grown or contracted with the highest velocity. These are called the Initial Period and the Final Period within the configuration. To determine the velocity of a topic, the frequency of the topic within the Final Period will be compared to the frequency of the topic within the Initial Period. These time periods are configured by selecting a start and end date for the period.
Important:The start and end dates you select for your time periods have to be within the overall range of dates available within the dataset in order to save the configuration. You can see the
- Configure your thresholds:
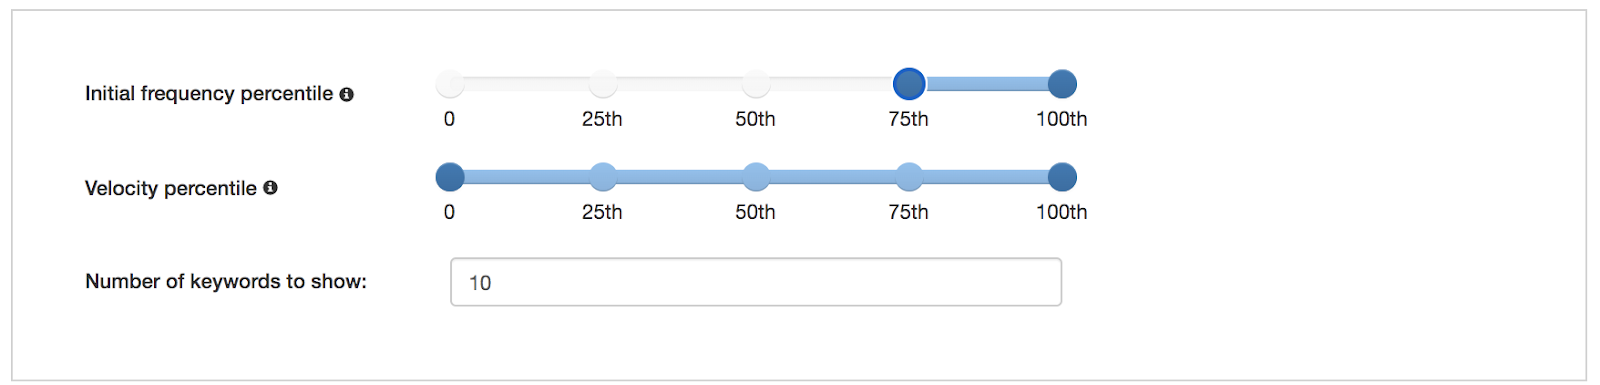
- Redbird will determine the fastest Growing / Contracting topics based on a Velocity Index, which is calculated based on a combination of Velocity and Initial Frequency of mentions.
- Velocity = Change in frequency of a topic between the Initial Period and Final Period expressed as a percentage change
- Initial Frequency = Absolute number of mentions of a topic in the Initial Period only
- If you would like to only consider topics that are within a certain percentile range for either the Velocity or Initial Frequency metrics, you can adjust the percentile sliders in the thresholds area. For example, if you would like to only consider topics that have a high Initial Frequency, you could set the threshold for Initial Frequency to be within the range of 75th - 100th percentile. By default, the thresholds will be set to include all values (0 - 100th percentile).
- You can also set the number of trending topics to return within the threshold area. The default number of topics is set to 10
- Once you are done setting your initial threshold values, click Customize at the top right of the configuration screen.\
- Redbird will determine the fastest Growing / Contracting topics based on a Velocity Index, which is calculated based on a combination of Velocity and Initial Frequency of mentions.
- Customize thresholds
- Based on your initial configuration, Redbird will run the trend analysis and give you the results in the Customize Thresholds view. You can explore those results, adjust the thresholds, and recalculate the results to get the output you are looking for before finalizing the configuration. To do this, edit the thresholds in the thresholds area as described above, and click the Re-Calculate button to the bottom right of the thresholds area
- Save your configuration by clicking Complete Configuration at the top right of the screen.
- Run your macro and view the results
After running the macro containing your Identify Trends operation, you will see three main outputs produced by the macro.
- Transformed core dataset with topic tag columns
- This dataset will have your processed original dataset, with new columns added for each Growing / Contracting topic identified in the Identify Trends operation. Each of these new columns will have a ‘True’ or ‘False’ listed within each row to indicate if the text document in that row contained a mention of the topic or not
- Secondary dataset with details on trending topics
- This dataset will have a separate row for each Growing / Contracting topic identified in the Identify Trends operation, and columns with additional metrics related to each topic (e.g. Velocity value, Initial Frequency value, etc.).
- Summary view with information on trends
- This view is described above in the How it Works section and allows you to interact with and explore the results of the Identify Trends analysis.
These will all be accessible either on the canvas or can be exposed by clicking on the outputs section of the right-side panel.
Updated 5 months ago