

Overview
What you'll build in this tutorial and how to follow along
Overview of the tutorial
The objective of this tutorial is to walk you through your first end-to-end project in Redbird — collecting data, preparing it, exploring it, and turning it into a finished report. We'll use a fictitious set of sales data from a superstore, along with a small list of retailers, to show how you can go from raw files to a polished presentation.
The most important thing to know before you start: you'll do everything by chatting with Autopilot, Redbird's AI assistant. You type what you want in plain words — "combine these two files", "which retailer had the most sales?", "build me a report" — and Autopilot does the building for you. Each step of this tutorial shows you the exact request to type.
You can approach this tutorial in two ways: read through the steps to understand how it all works, or follow along and build each step yourself. Following along is recommended — it's the fastest way to get comfortable with the platform. If you plan to build along as you go, download the sample files at the bottom of this page. They'll be used throughout the tutorial.
What is Redbird?
Redbird is an AI-powered workflow automation platform where you easily connect to other tools, pull data, transform data, run analysis, and build reports — either by hand or, as in this tutorial, by simply describing what you want to Autopilot. Your work lives in workflows: visual sequences of connected steps that show your data moving from its source through any preparation and on to its outputs. Once built, a workflow can be re-run or scheduled, so the reports it produces stay up to date as your data changes.
What you'll build
By the end of this tutorial you will have uploaded two datasets, combined and cleaned them, explored them in conversation with Autopilot, and produced a presentation-style report — all inside one workflow. The tutorial is split into four short guides, meant to be followed in order:
- Collecting data — upload the two sample files and have Autopilot add them to your workflow.
- Prepping data — ask Autopilot to clean up a column and combine the two datasets into one.
- Exploring data — preview your data, ask questions about it, and generate charts in the chat.
- Building a report — give Autopilot an example presentation and have it build a report from your data.
As you go, feel free to explore beyond the examples shown. You can experiment with the data, ask Autopilot follow-up questions, and try requests of your own — that's the best way to understand what Redbird can do.
Before you begin
- Make sure you're logged in to Redbird.
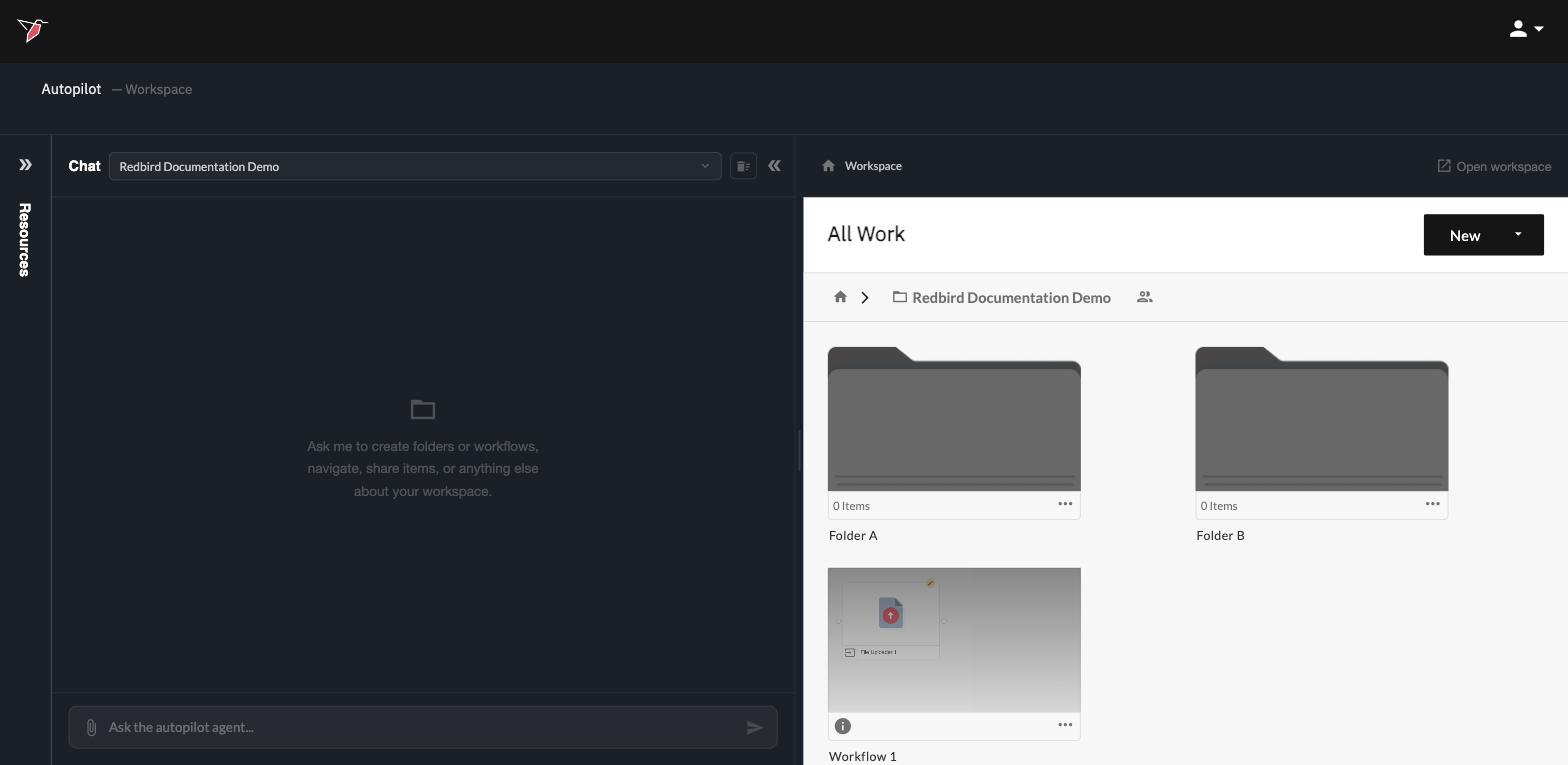
- Autopilot is already open when you log in: the chat panel is on the left — this is where you'll type your requests — and the preview panel is on the right. The preview panel starts out focused on your workspace, where your folders and workflows live; if it isn't, click Home at the start of the preview panel's breadcrumbs to go there. If your workspace is new, it may be nearly empty; you'll create everything you need as you go.
- Download the three sample files from the links at the bottom of this page: the superstore sales data, the retailer list, and an example sales report presentation.
When you're ready, continue to Collecting data to start building.
Links



Updated 4 days ago