

Transform & analyze your data
Transform, explore, enrich, and apply advanced analytics — all by asking
Introduction
There are four ways of working with data in Redbird, and they all start the same way: describe what you want in the Autopilot chat. You can transform data to clean and reshape it, explore it with questions and quick charts, enrich it by tagging text and media, and apply advanced analytics with the data science specialist. This guide covers each.
Transform your data
To change your data — clean a column, filter rows, combine datasets, calculate new fields — describe the change:
Clean up the Order Date column so it shows just the date without the time
Join the Retailers dataset into this data using Retailer ID
Autopilot turns each request into a step in an AI Data Tool node on your canvas and runs it. The node keeps your steps in order, and the panel on the right shows each step and its outputs — click the eye icon on any output to preview the result.
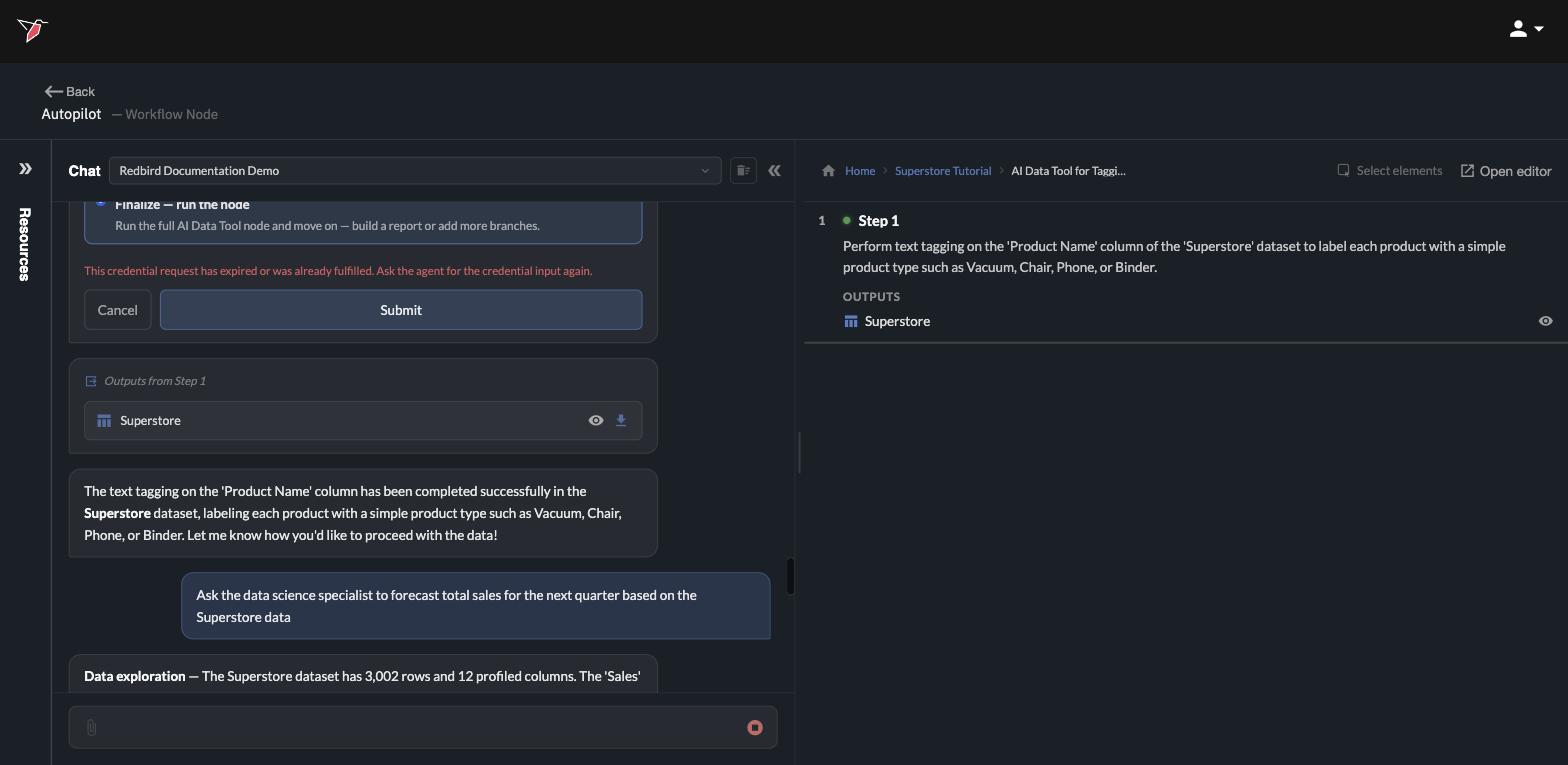
Prefer to work directly? Open any AI Data Tool node with Open editor to see and manage its steps by hand.
Explore and analyze in the chat
For answers rather than changes, just ask questions:
Which retailer had the most sales?
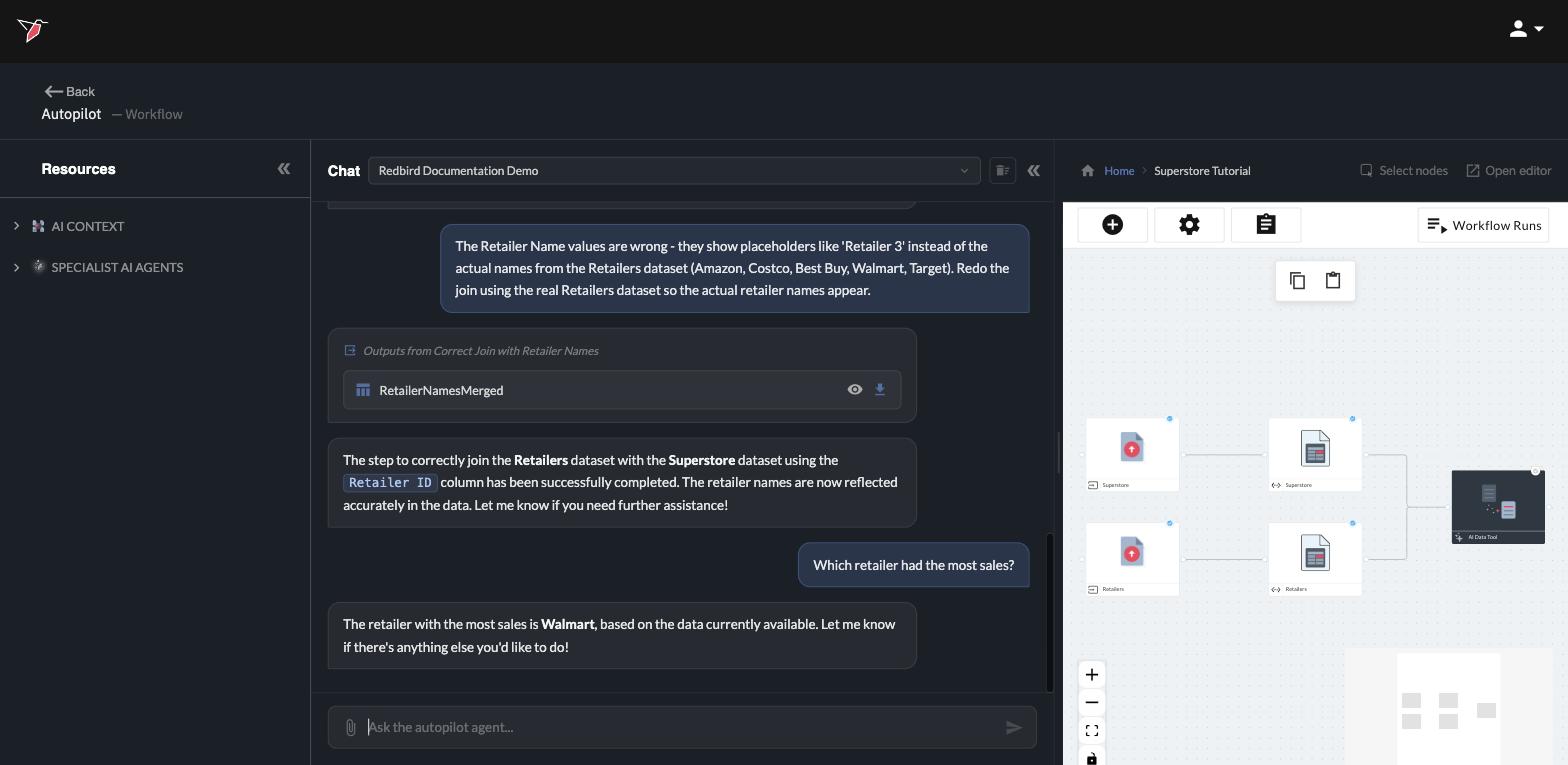
And when a data visualization tells it better, ask for one:
Show me total sales by retailer as a chart
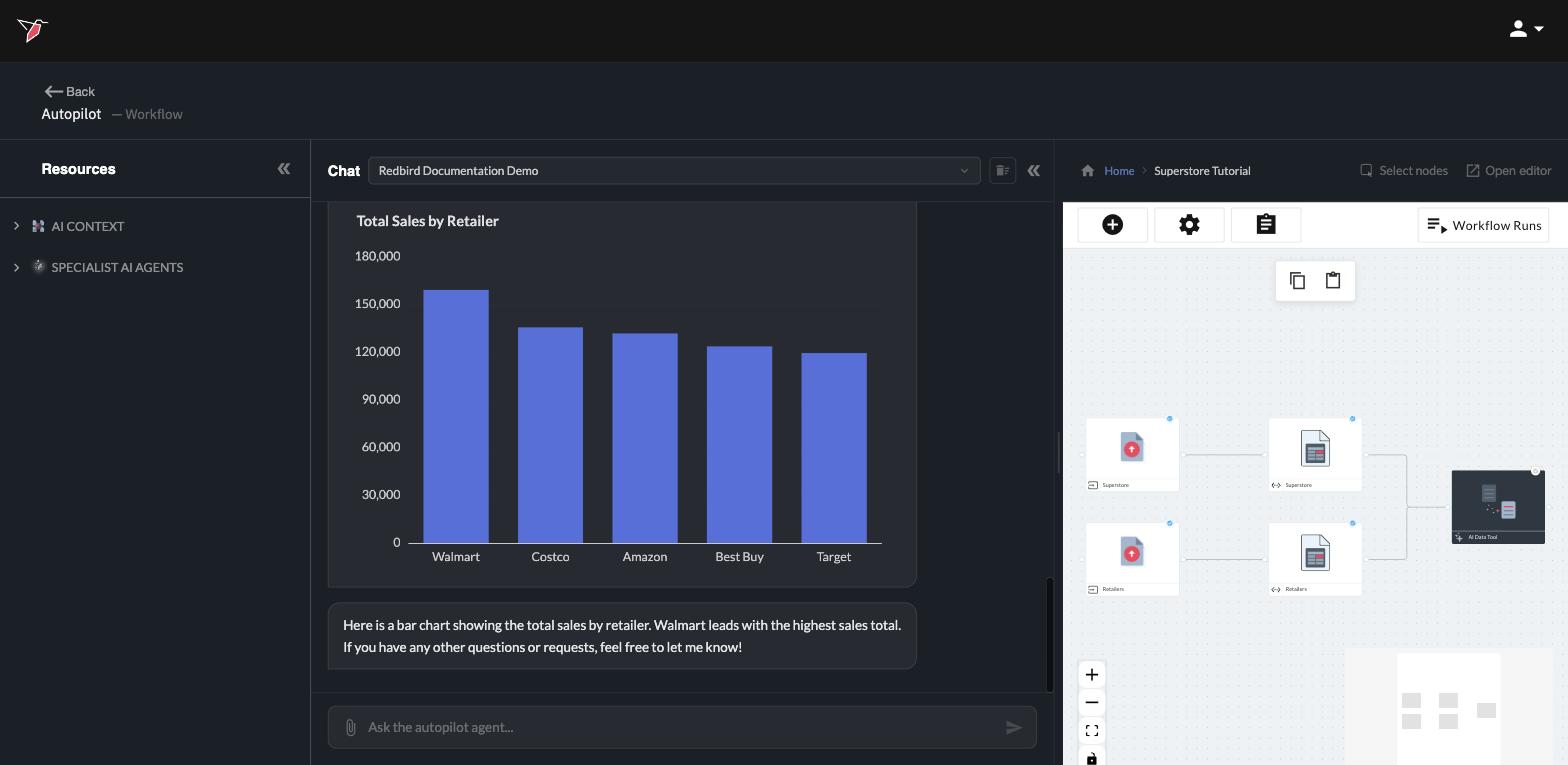
Exploration doesn't change your data — it's a conversation on top of it. Ask follow-ups, compare segments, drill into time periods; Autopilot always works from the latest prepared version of your data.
Enrich with text and multimedia tagging
Tagging adds structure your data doesn't have yet. Point Autopilot at free-form content — product names, customer feedback, and even media files like images, video, and audio — and have it label every row:
Tag each product in the Superstore data with a product type based on its product name
Autopilot asks a couple of quick questions to get the tagging right — what the tags should identify, and which column to tag — then labels every row.
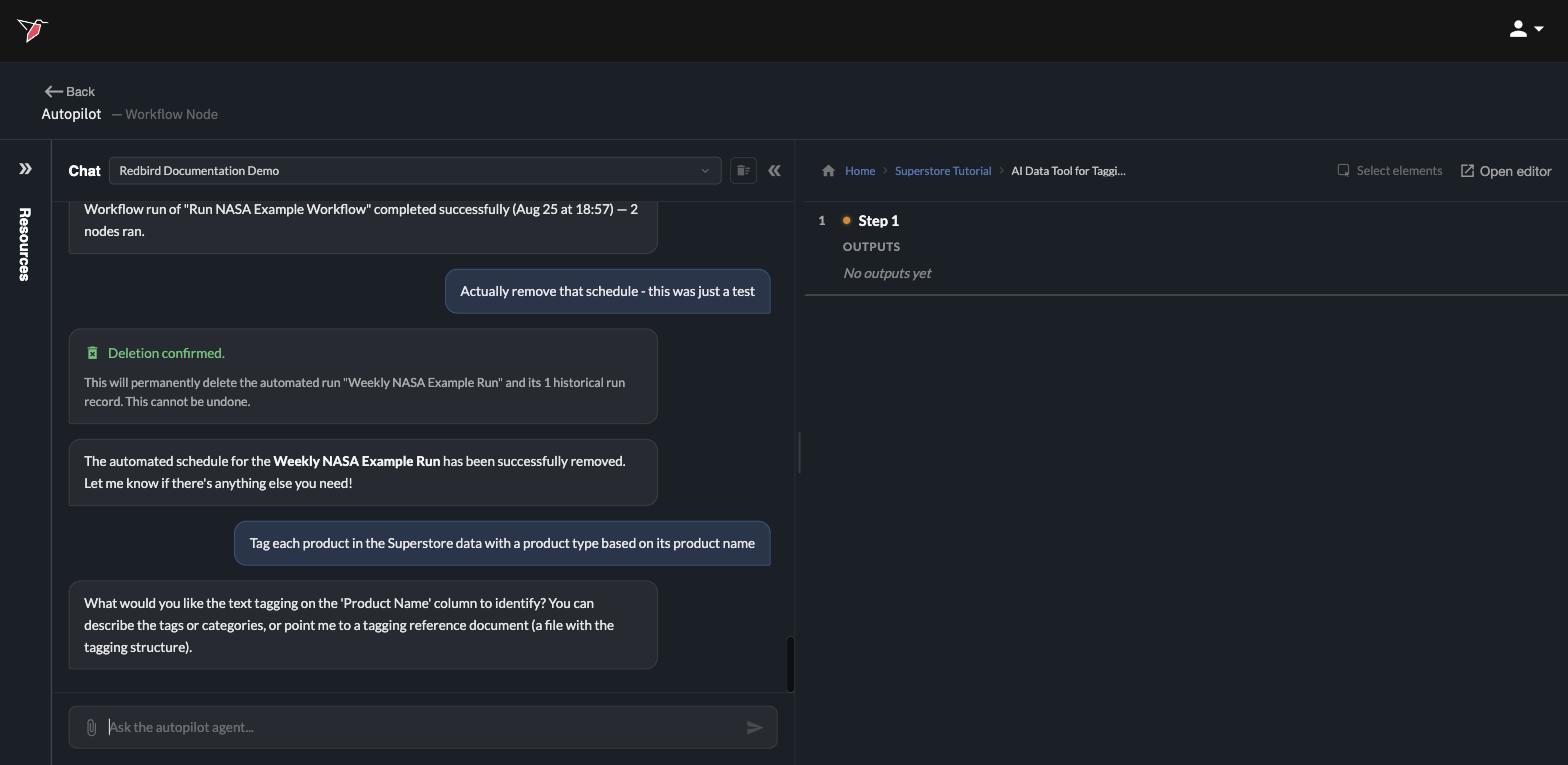
The result is a new column in your data with a tag on every row — ready to group by, filter on, and chart, just like any other column.
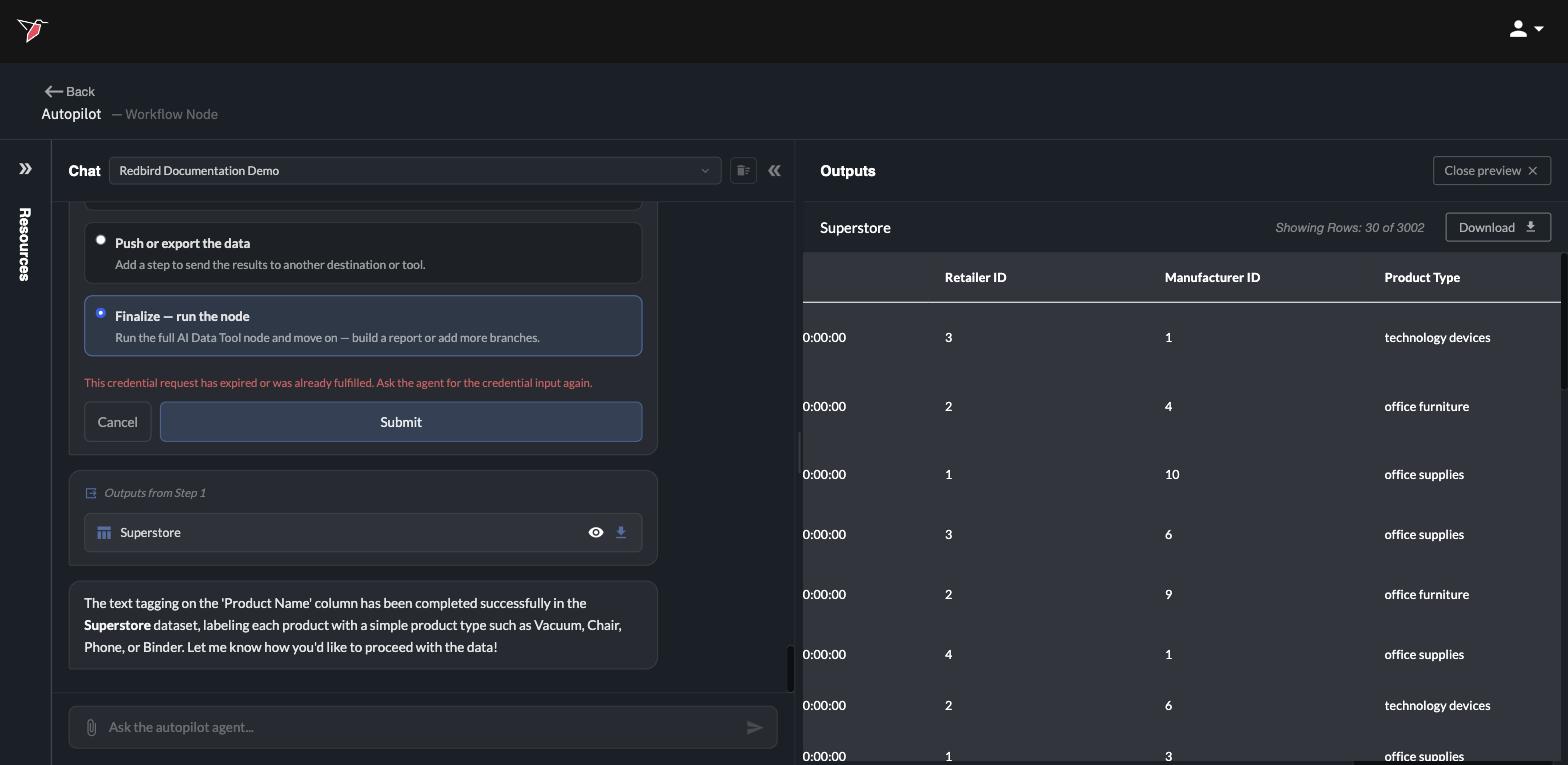
This is how you turn messy text into categories you can count: tagging feedback by theme, products by type, or media files by what they contain.
If you have a specific tagging structure (specific tags and instructions on how to apply each tag), you can also ask Autopilot to tag your dataset based on a forward slash reference to the tagging structure (which can be contained in any document living in the Resources Panel under Uploads or AI Context).
Apply data science and advanced analytics
For questions that need modeling rather than arithmetic — forecasts, drivers, predictions — bring in the Data Science Specialist, one of Redbird's specialist agents:
Ask the data science specialist to forecast total sales for the next quarter
The specialist explores your data, tests which factors matter, builds and evaluates a model, and reports back in the chat — narrating each stage (data exploration, feature relationships, model results) with supporting tables so you can see how it reached its conclusion.
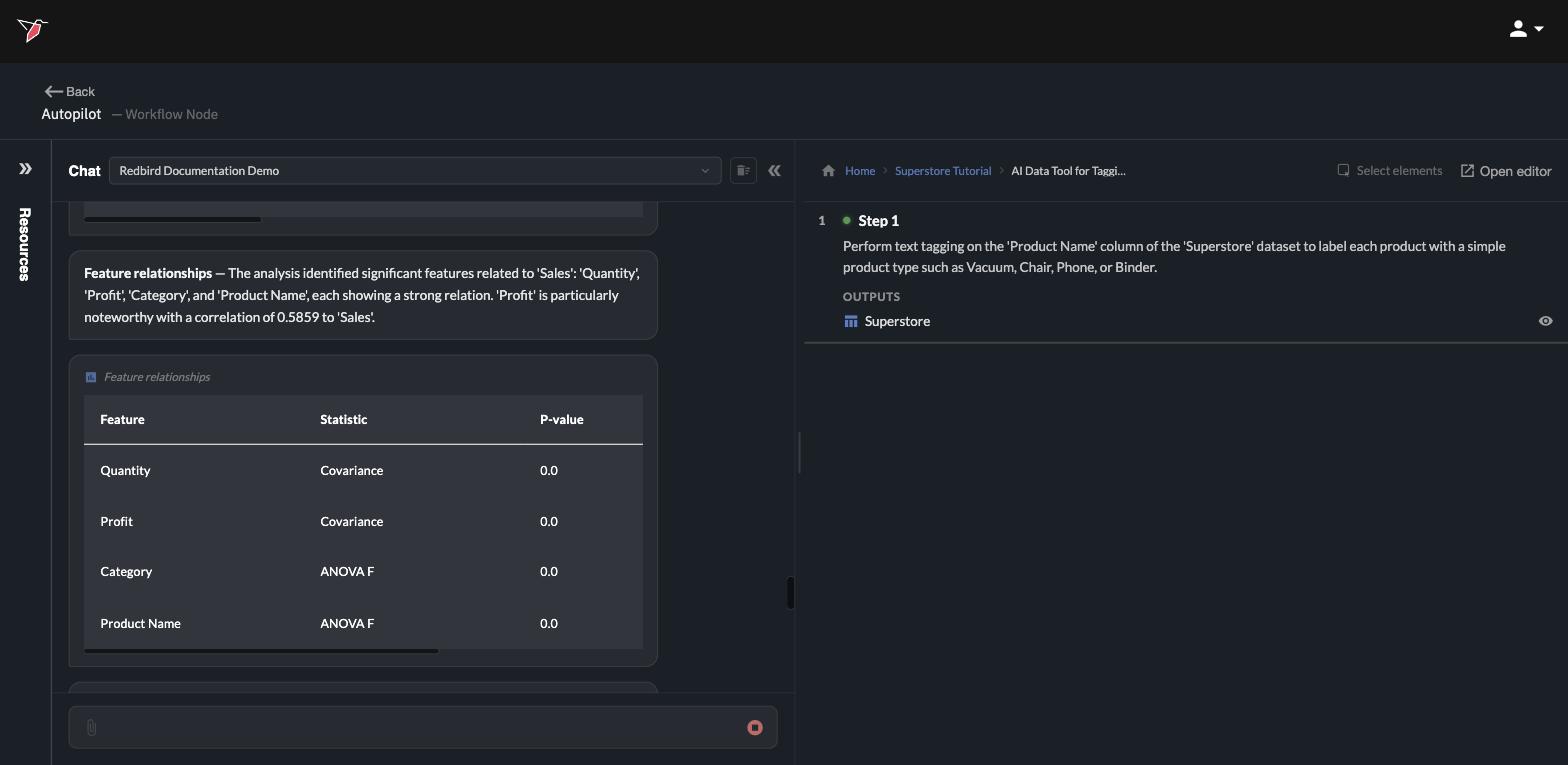
Specialists are managed in the Resources panel. The Data Science Specialist is provided by Redbird and enabled by default. See Adding specialist AI agents for how specialists work and how to add your own.
Which one do I need?
- Data needs fixing or reshaping → transform it.
- You have a question → explore in the chat.
- Text or media needs categories → tag it.
- You need a forecast or a model → the data science specialist.
All four build on the same workflow data, and everything you create — transformed datasets, tag columns, model outputs — can flow into reports and downstream steps.
Updated 4 days ago