Calculate Pivot Values Operation
Overview
Once a dataset has been loaded into the Redbird platform, you may decide that it is necessary to summarize your data along a specific set of dimensions and create aggregate calculations prior to generating any reports or other analytical outputs. This task can be completed easily using Redbird’s Calculate Pivot Values operation and the Macro Builder tool.
How It Works
To demonstrate how the Calculate Pivot Values operation works and the value it can provide in your analysis, we are going to walk through an example using data from a fictitious industry that produces widgets.
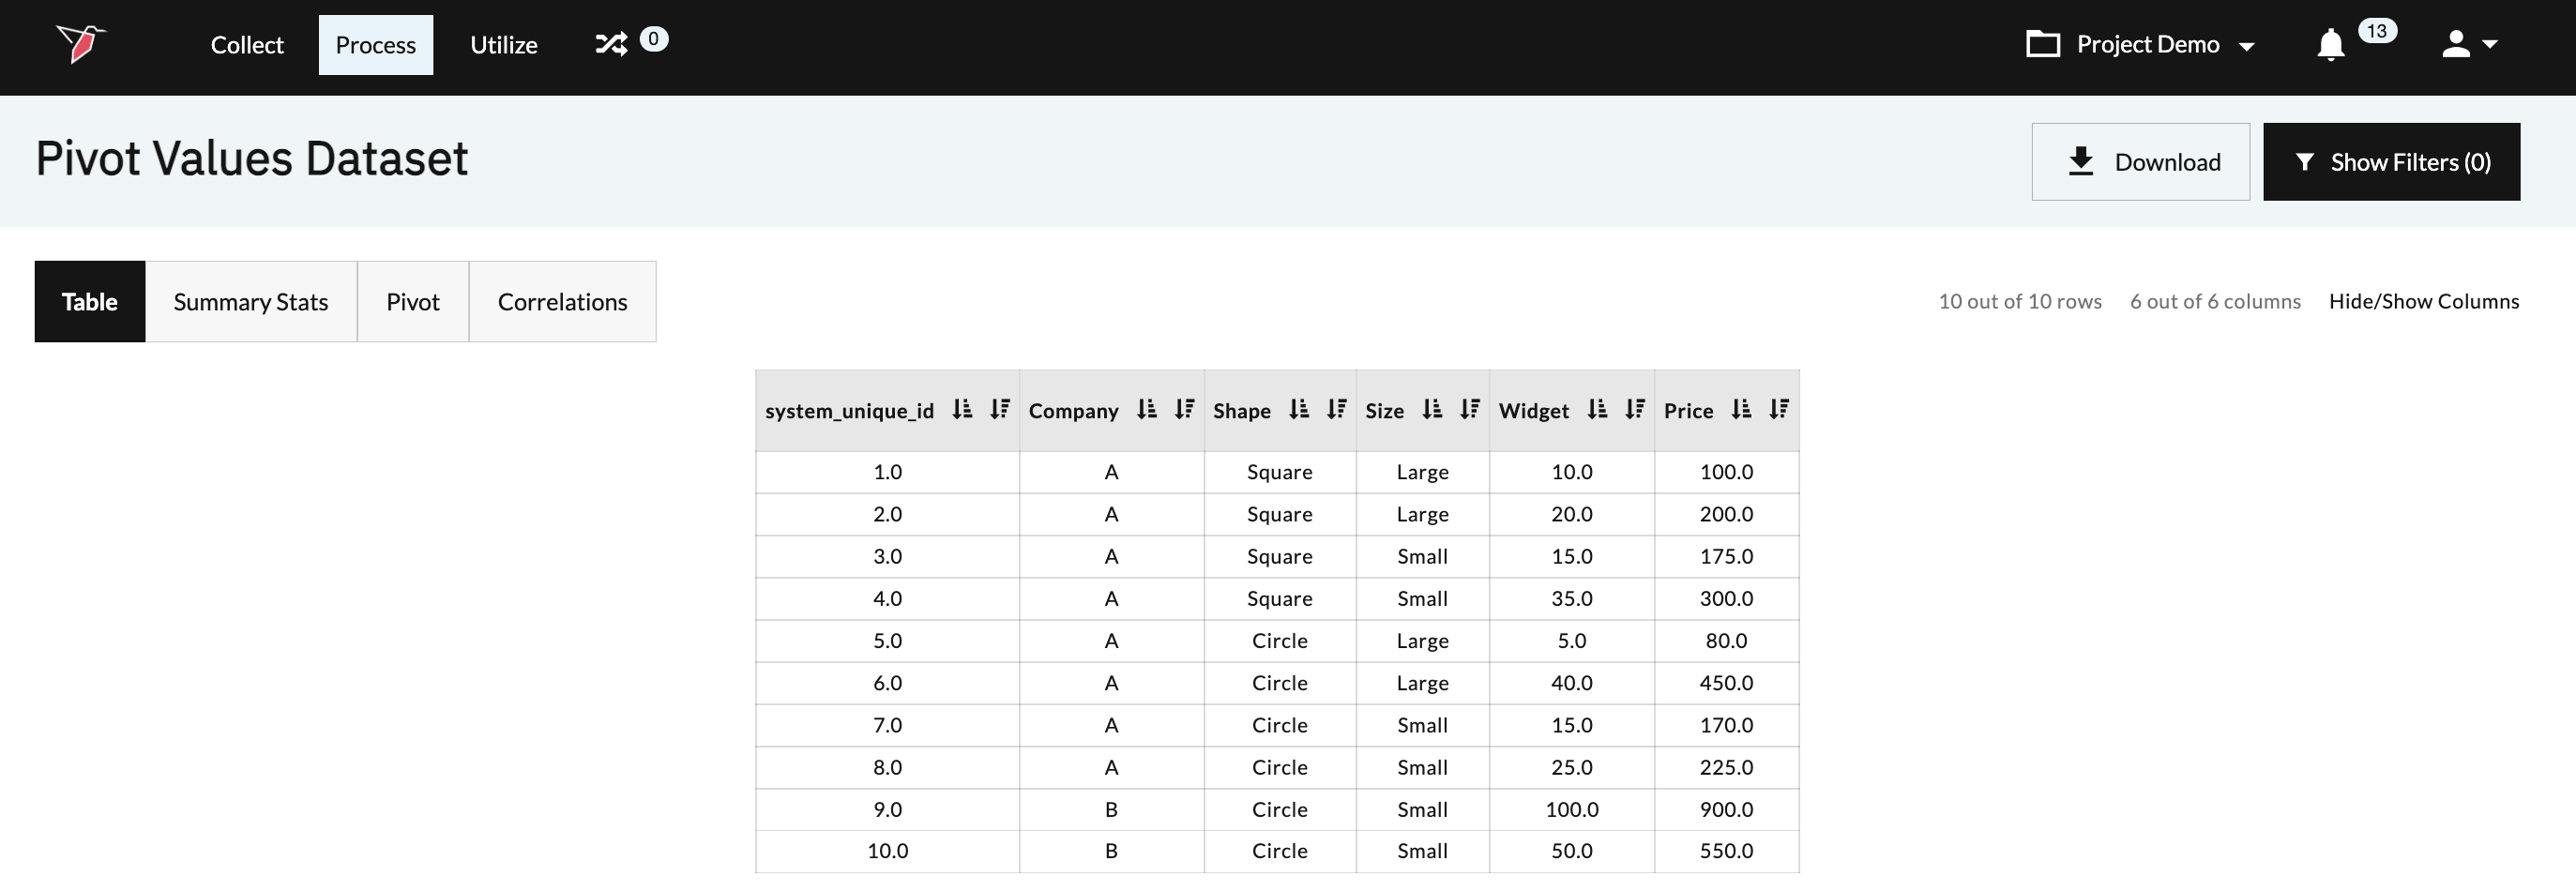
The data below was uploaded into the Redbird Platform and includes four columns: company, the shape of the widget, size of the widget, number of widgets, and price.
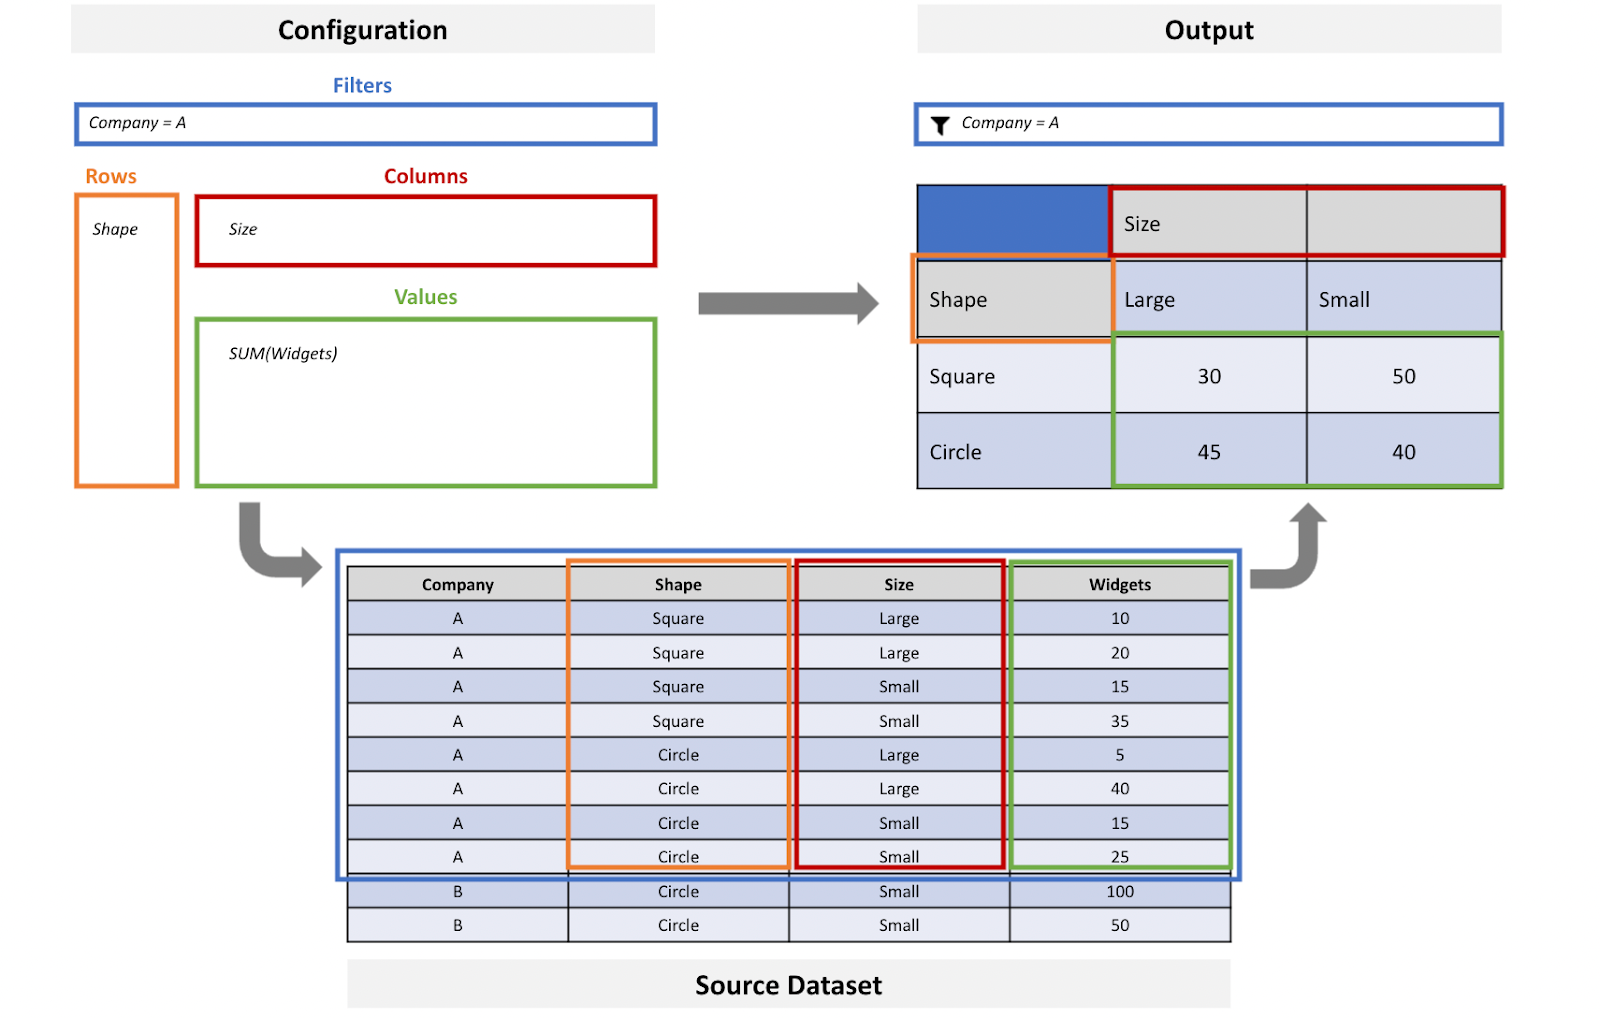
As industry analysts, we are interested in understanding how many widgets of each size and shape combination company A produced. To complete our analysis, we are going to use the Macro Builder and Calculate Pivot Values operation. The Calculate Pivot Values operation is configured using three main inputs - filter, dimension(s), and values.
- Filter: A filter will allow you to only return data that meets specific criteria. In our example case, we only want to include widget production data for company A.
- Dimension(s): Your dataset has a number of columns that represent key attributes of your dataset. For example, our dataset includes attributes around an industry's production of widgets. These attributes include the company name, the shape of the widget, the size of the widget, and the number of widgets. Dimensions
allow you to pick the relevant attributes you want to analyze and view them as either rows or columns. In our example, the dimensions we want to analyze are shape (row) and size (column). - Values: Once you have set up your filters and dimensions, you can determine the values you want returned and the calculations you want to run. The calculations that are available in the Calculate Pivot Values operation include mean, median, mode, max, min, count, percentage count, sum, percentage sum, quartile, percentile, and standard deviation. In our example, we want to sum the number of widgets.
The below diagram highlights how our filters, dimensions, and values come together to help us determine how many widgets of each shape and size combination were produced by company A.
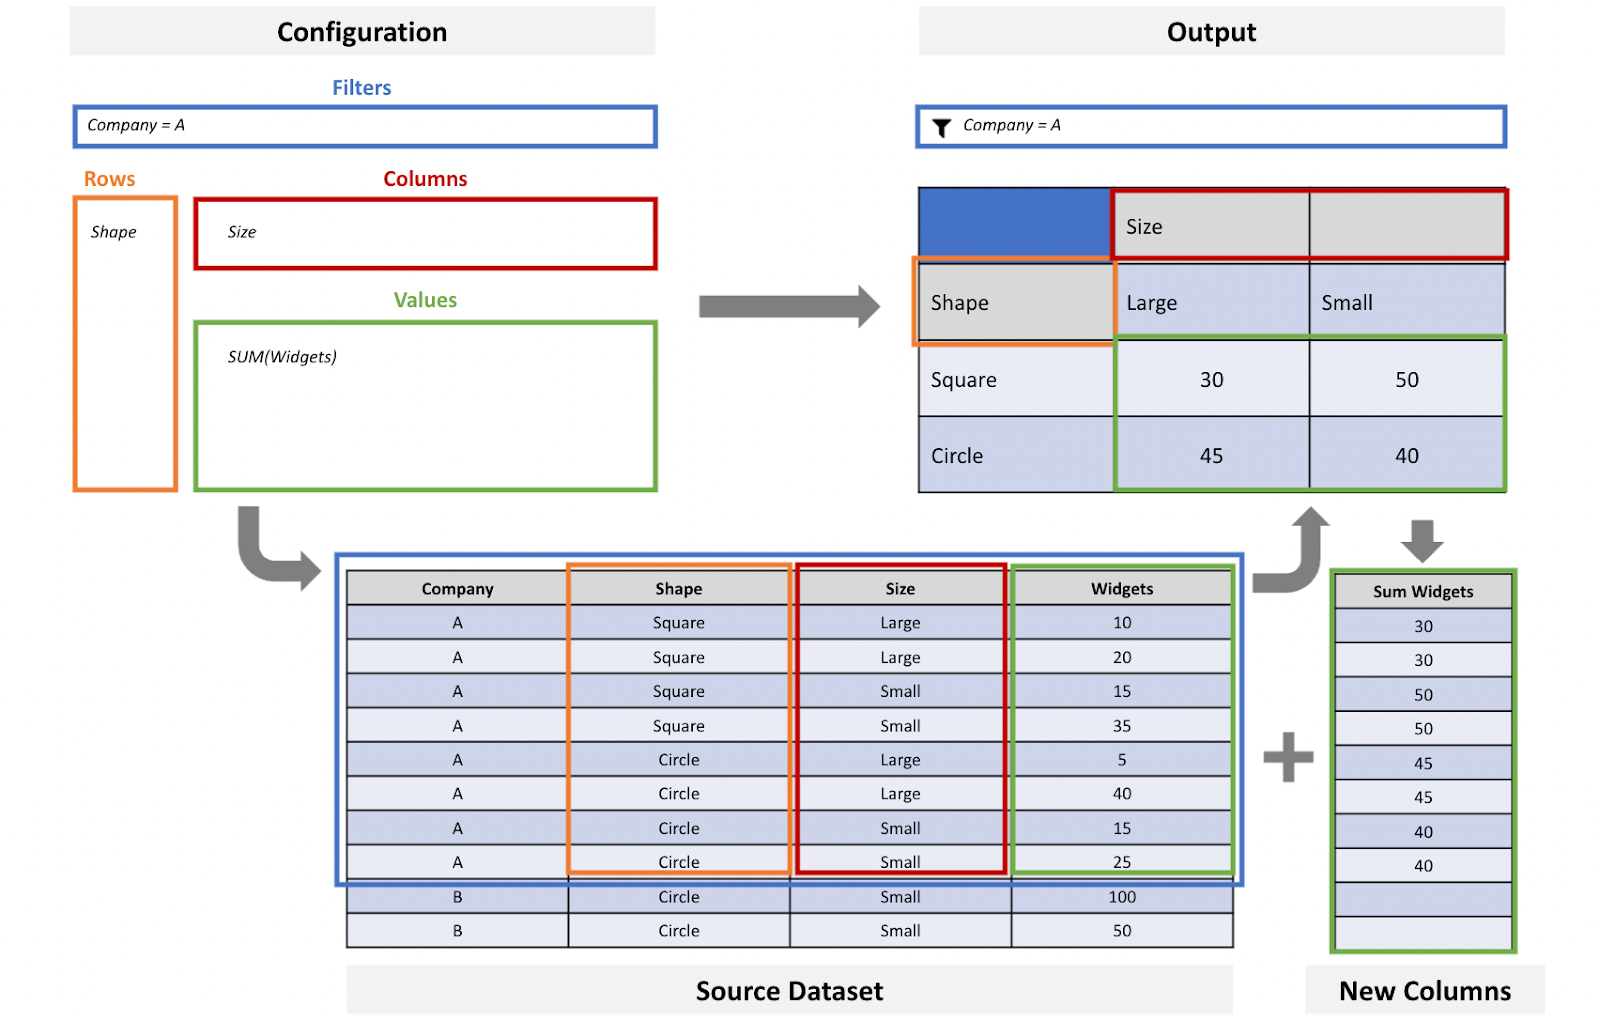
Once we are comfortable with our configurations, we can save our inputs and run our macro. Executing the macro will create a new output that appends additional column(s) to a copy of the original dataset. The new column(s) represent the values that were calculated as a result of the configurations that were set in the Macro Builder.
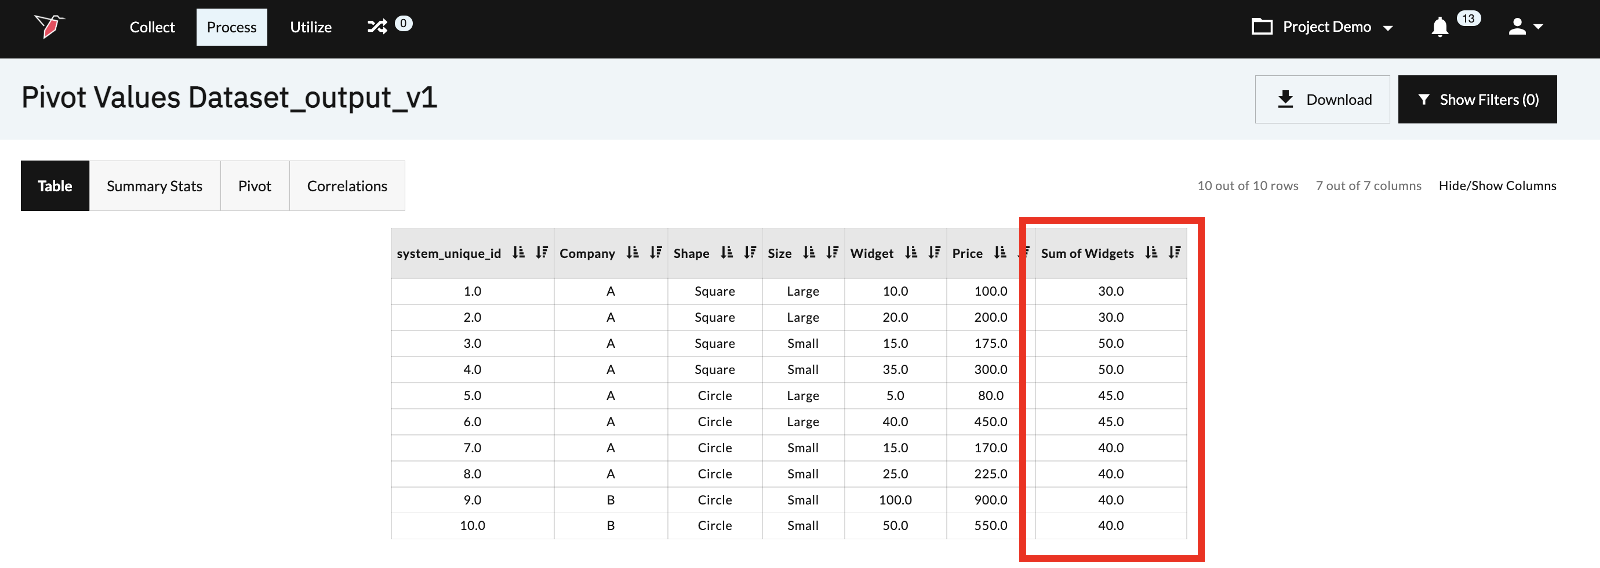
New Output
Configuration
To add and configure the Calculate Pivot Values Operation, please follow the below steps
- Name your pivot operation
- Configure the Operation by adding filters, dimensions, and values
To configure the Calculate Pivot Values operation, we are going to use the example from the “How it Works” section. As we discussed earlier in the document, we are interested in understanding how many widgets of each size and shape combination company A produced. To accomplish our task we are going to set our filters, dimensions, and values.
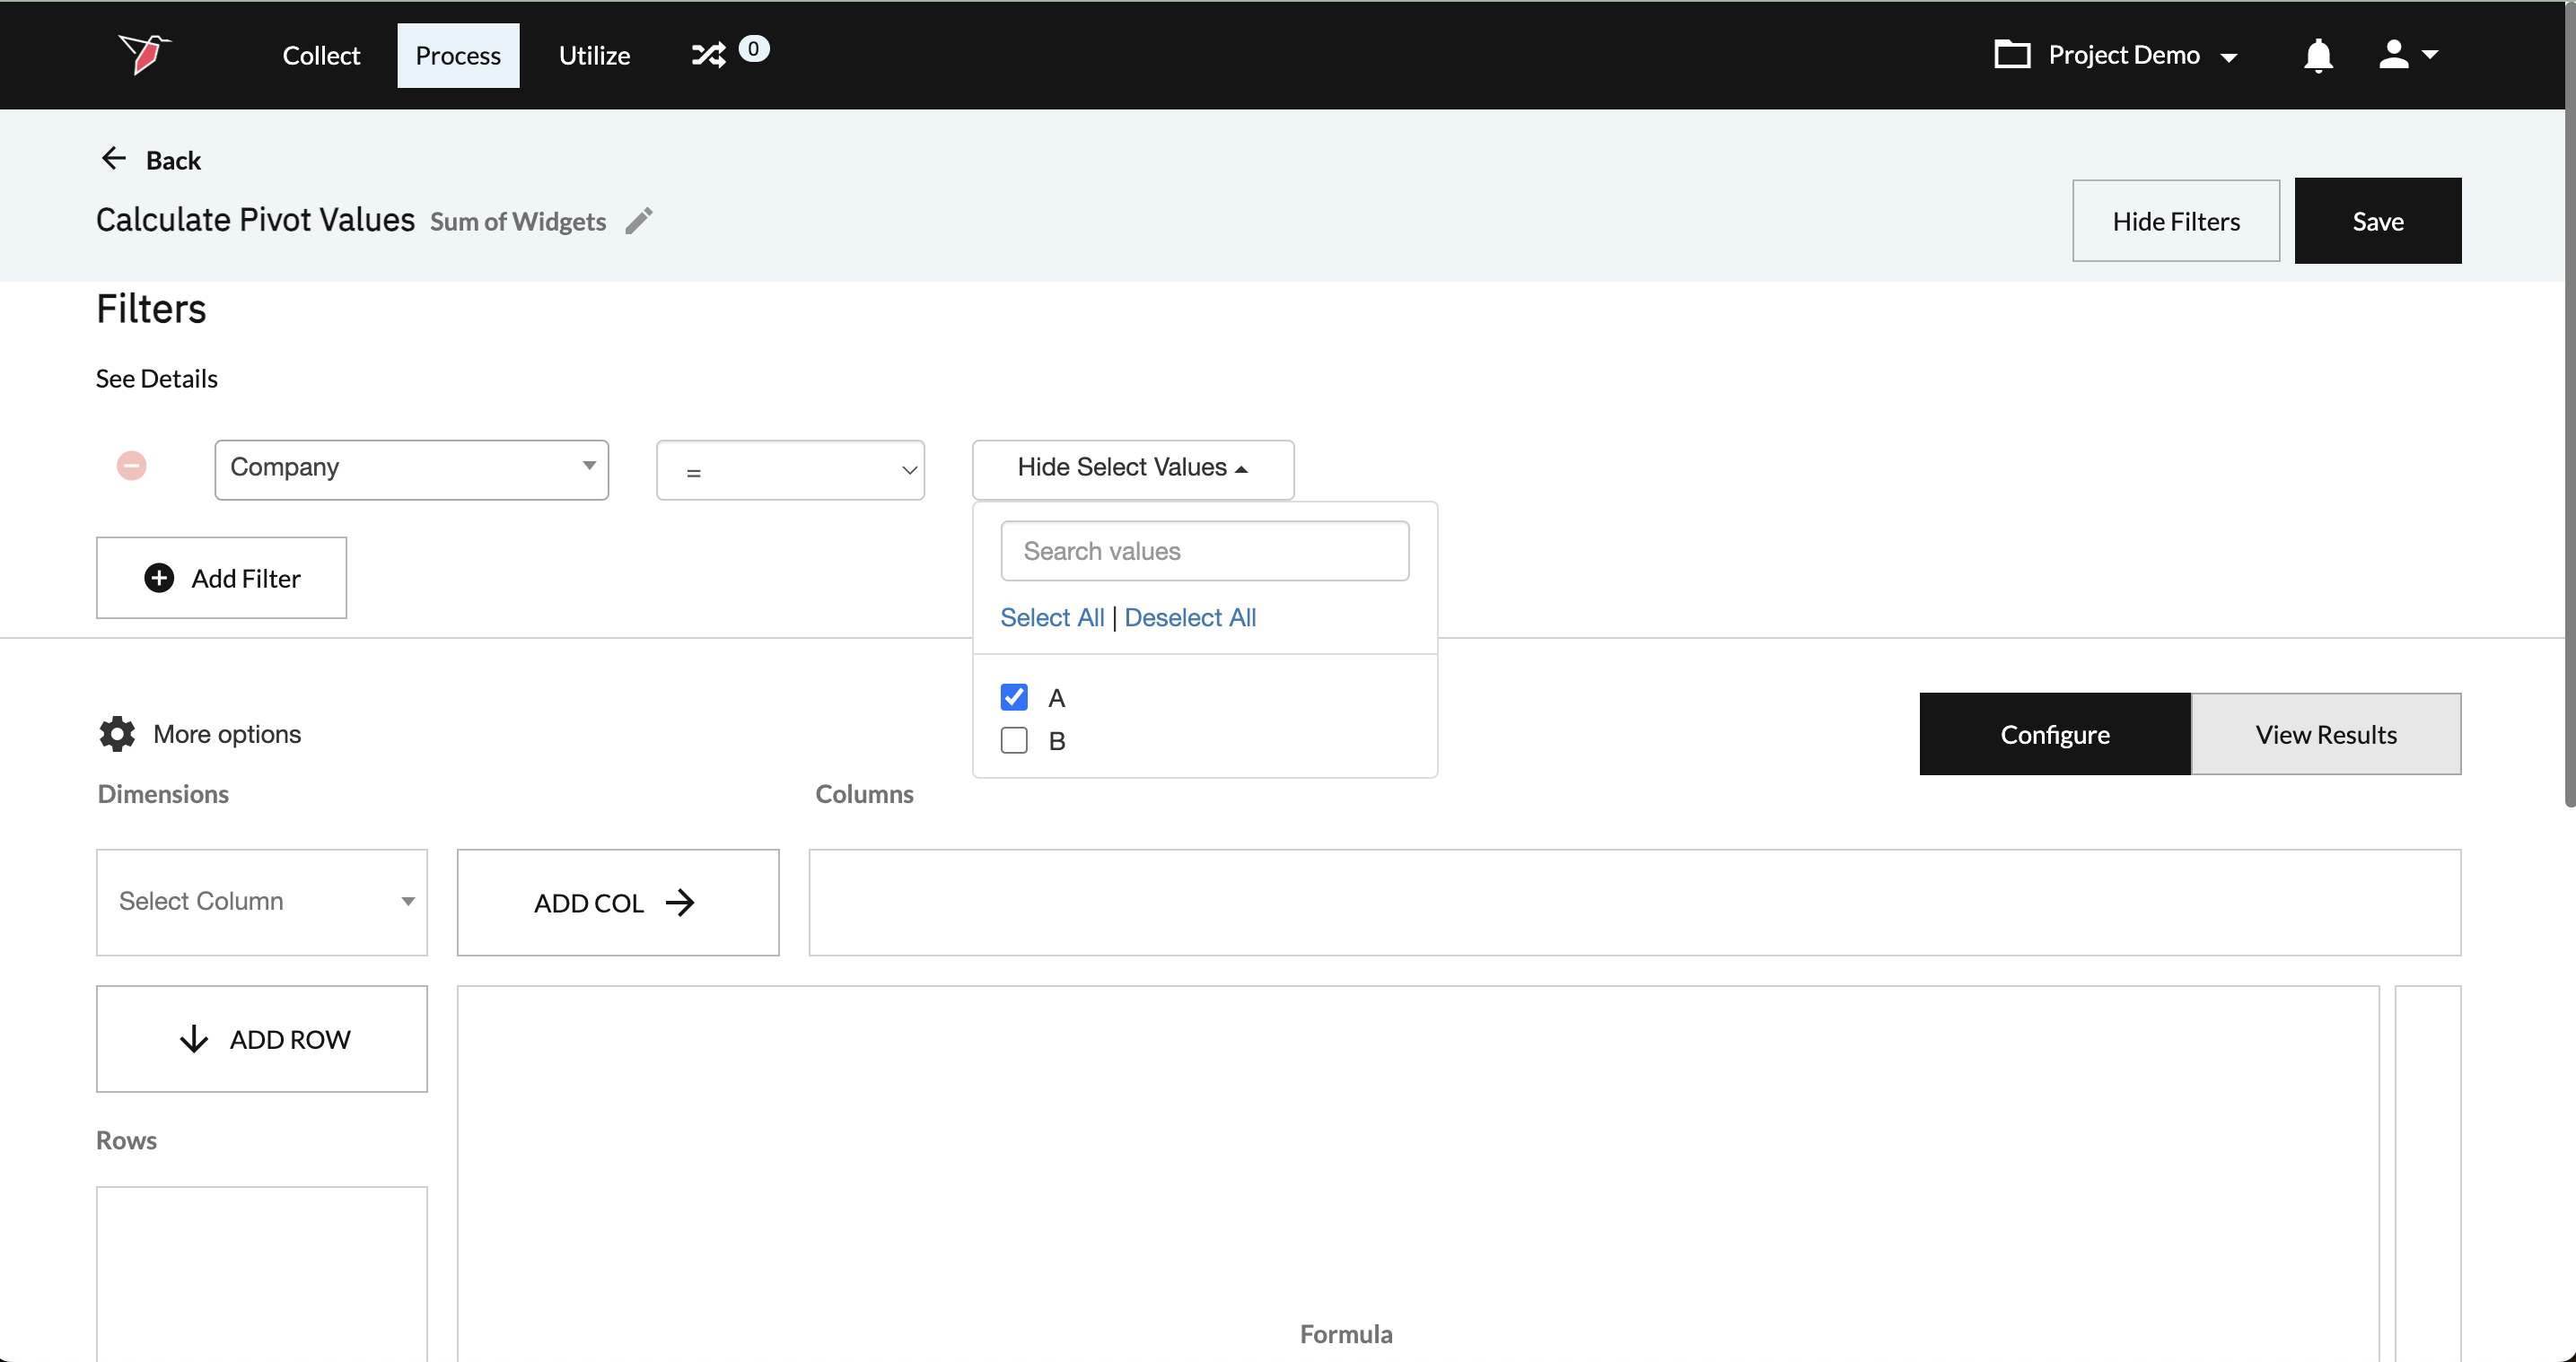
To filter click on Show Filters --> Add Filter. Select: Company = A
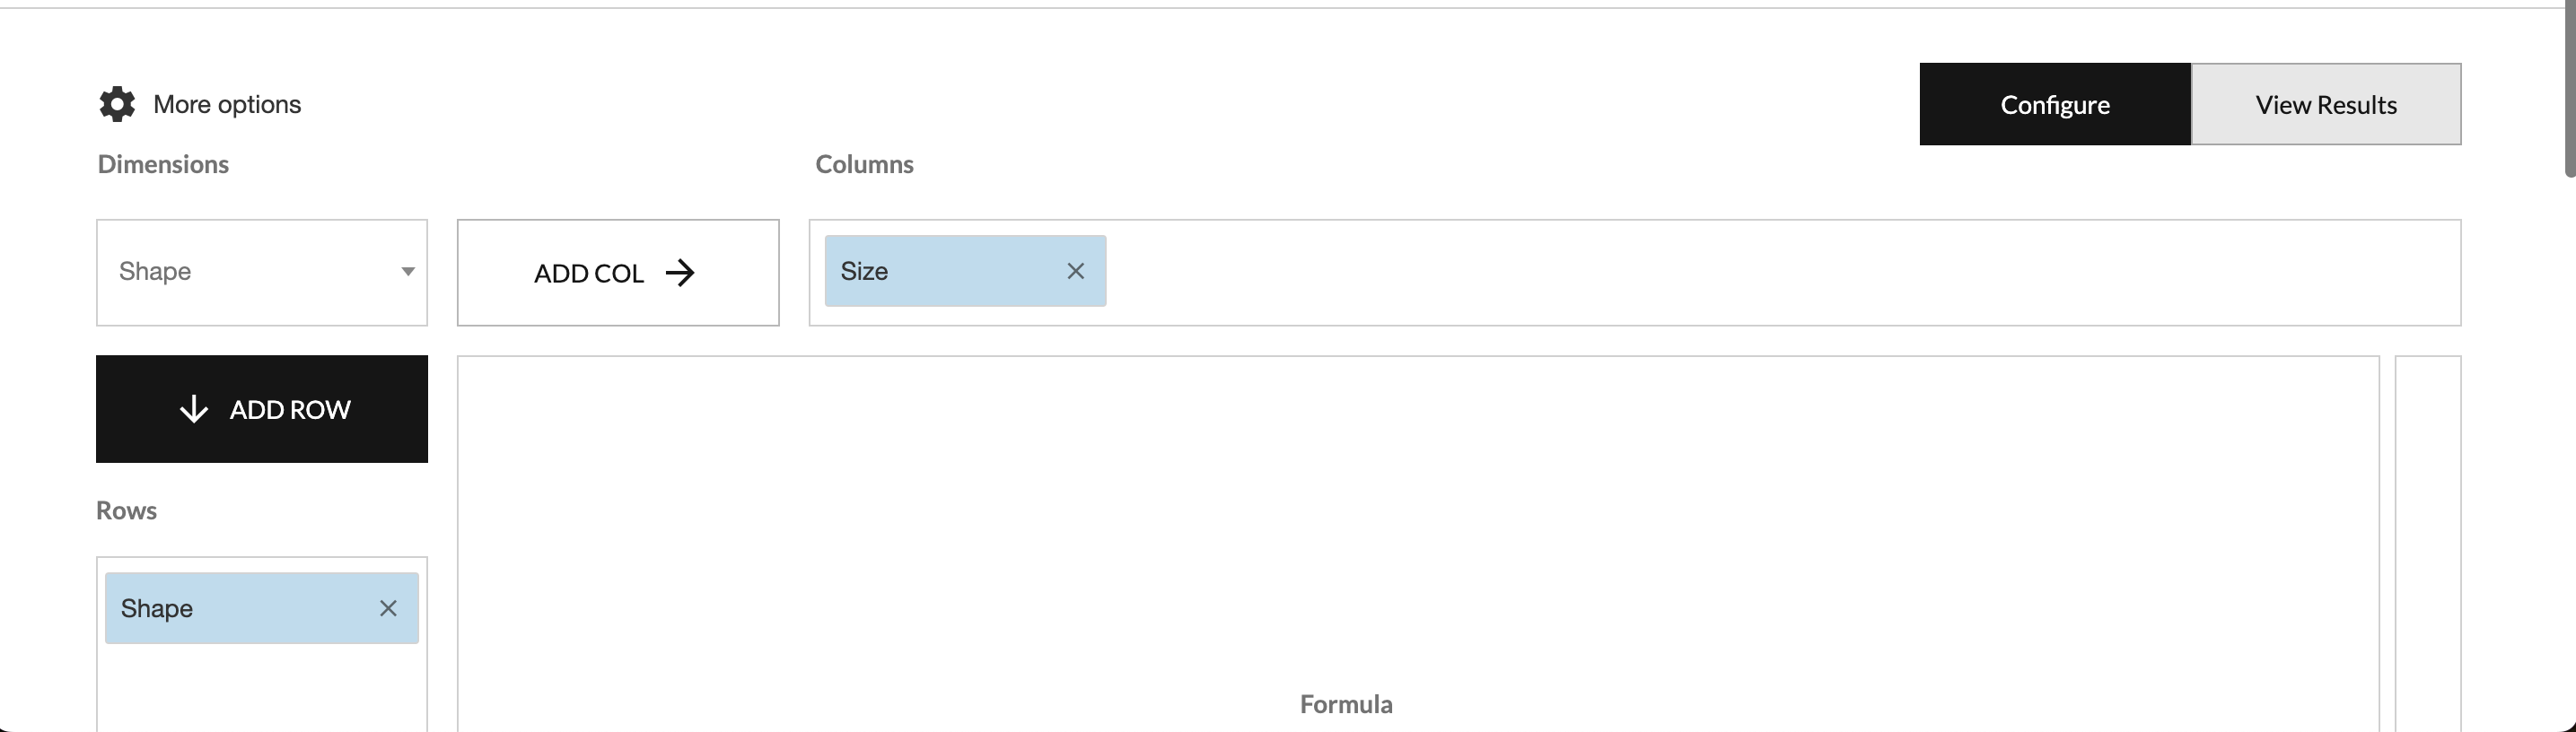
Dimensions = Shape and Size
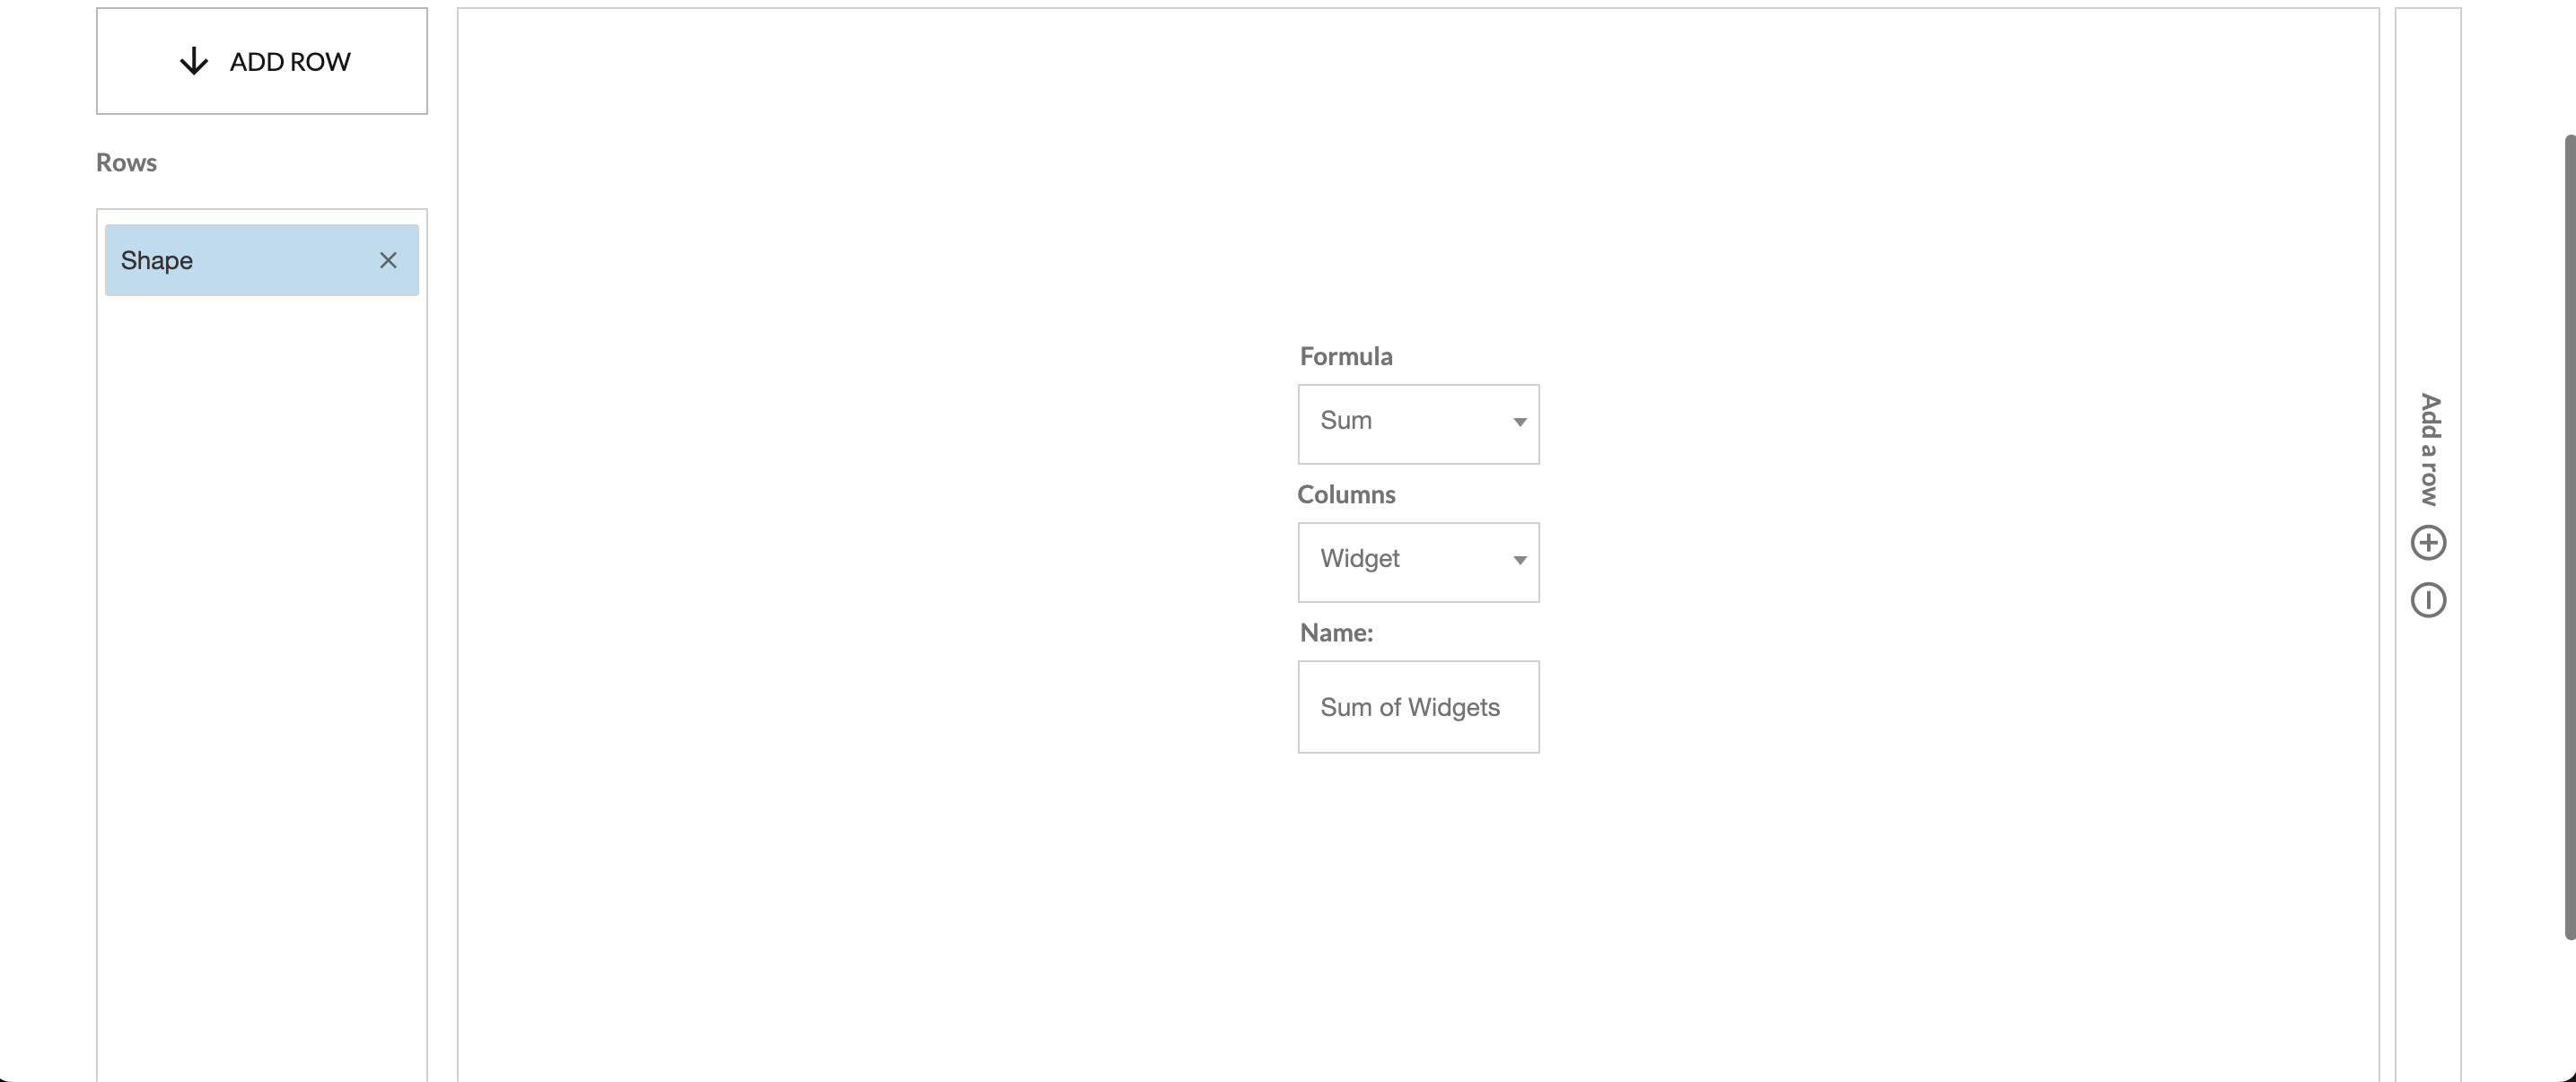
Values = Sum of Widgets
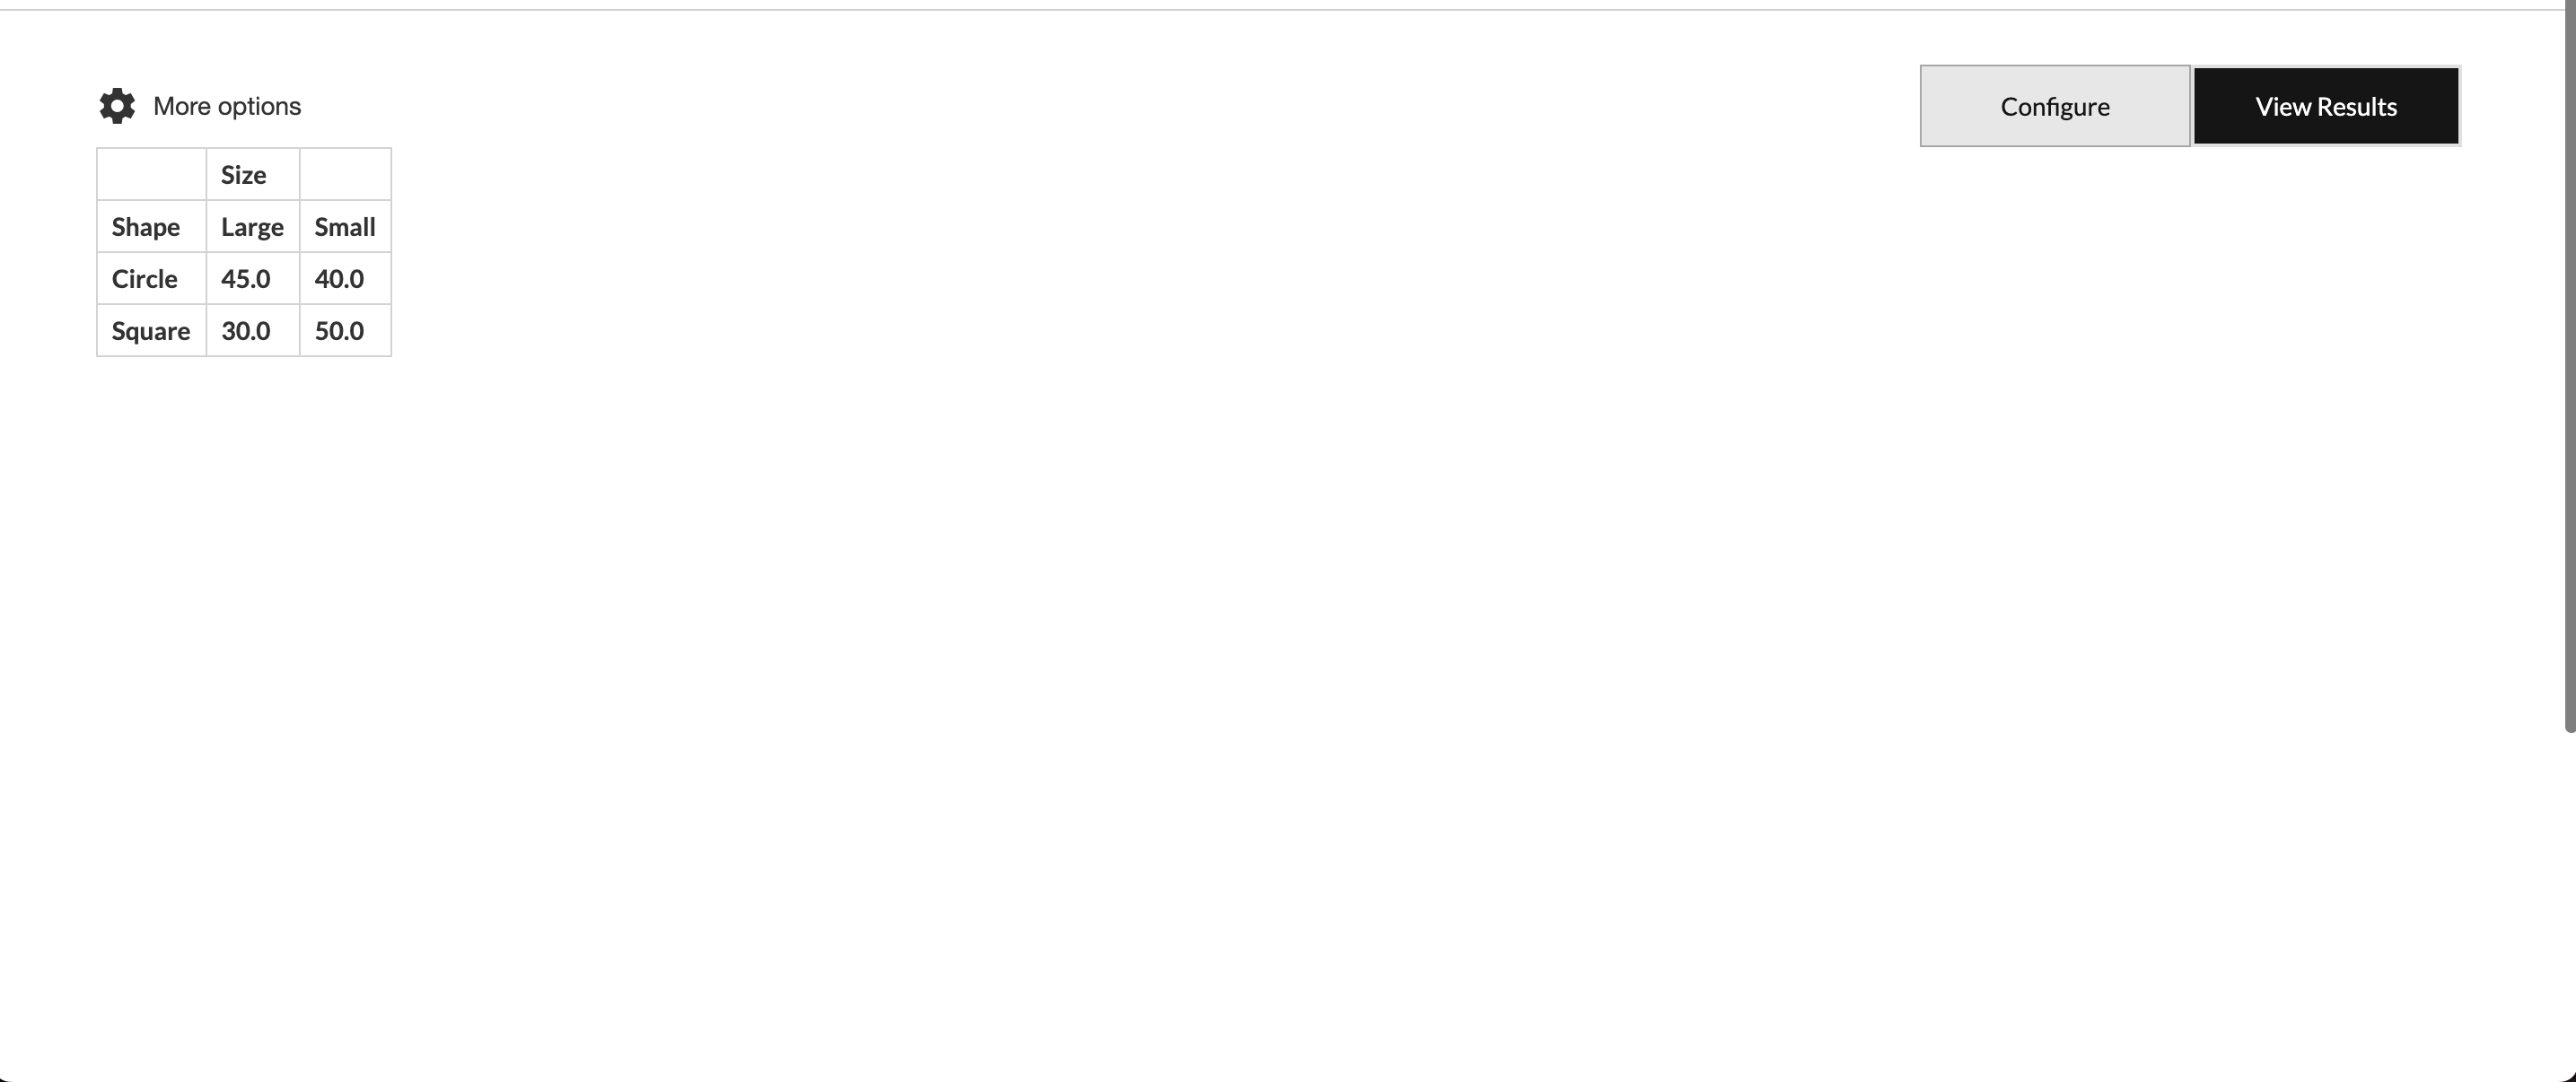
Tip:Prior to running your macro, you should confirm that your data is aggregated in the way you expected. You can preview your data by clicking View Results, which will give you a tabular view of your configurations. Please note that View Results will only show data that is part of the original dataset, but will not work with data that was created by other operations in the macro.
The above example represents a relatively simple use case. For more complex analysis, users have the ability to:
- Add multiple filters to further refine their original dataset by clicking on Add Filter.
- Select multiple dimensions to their rows/columns by selecting a dimension in the Dimensions field and clicking Add Row or Add Column.
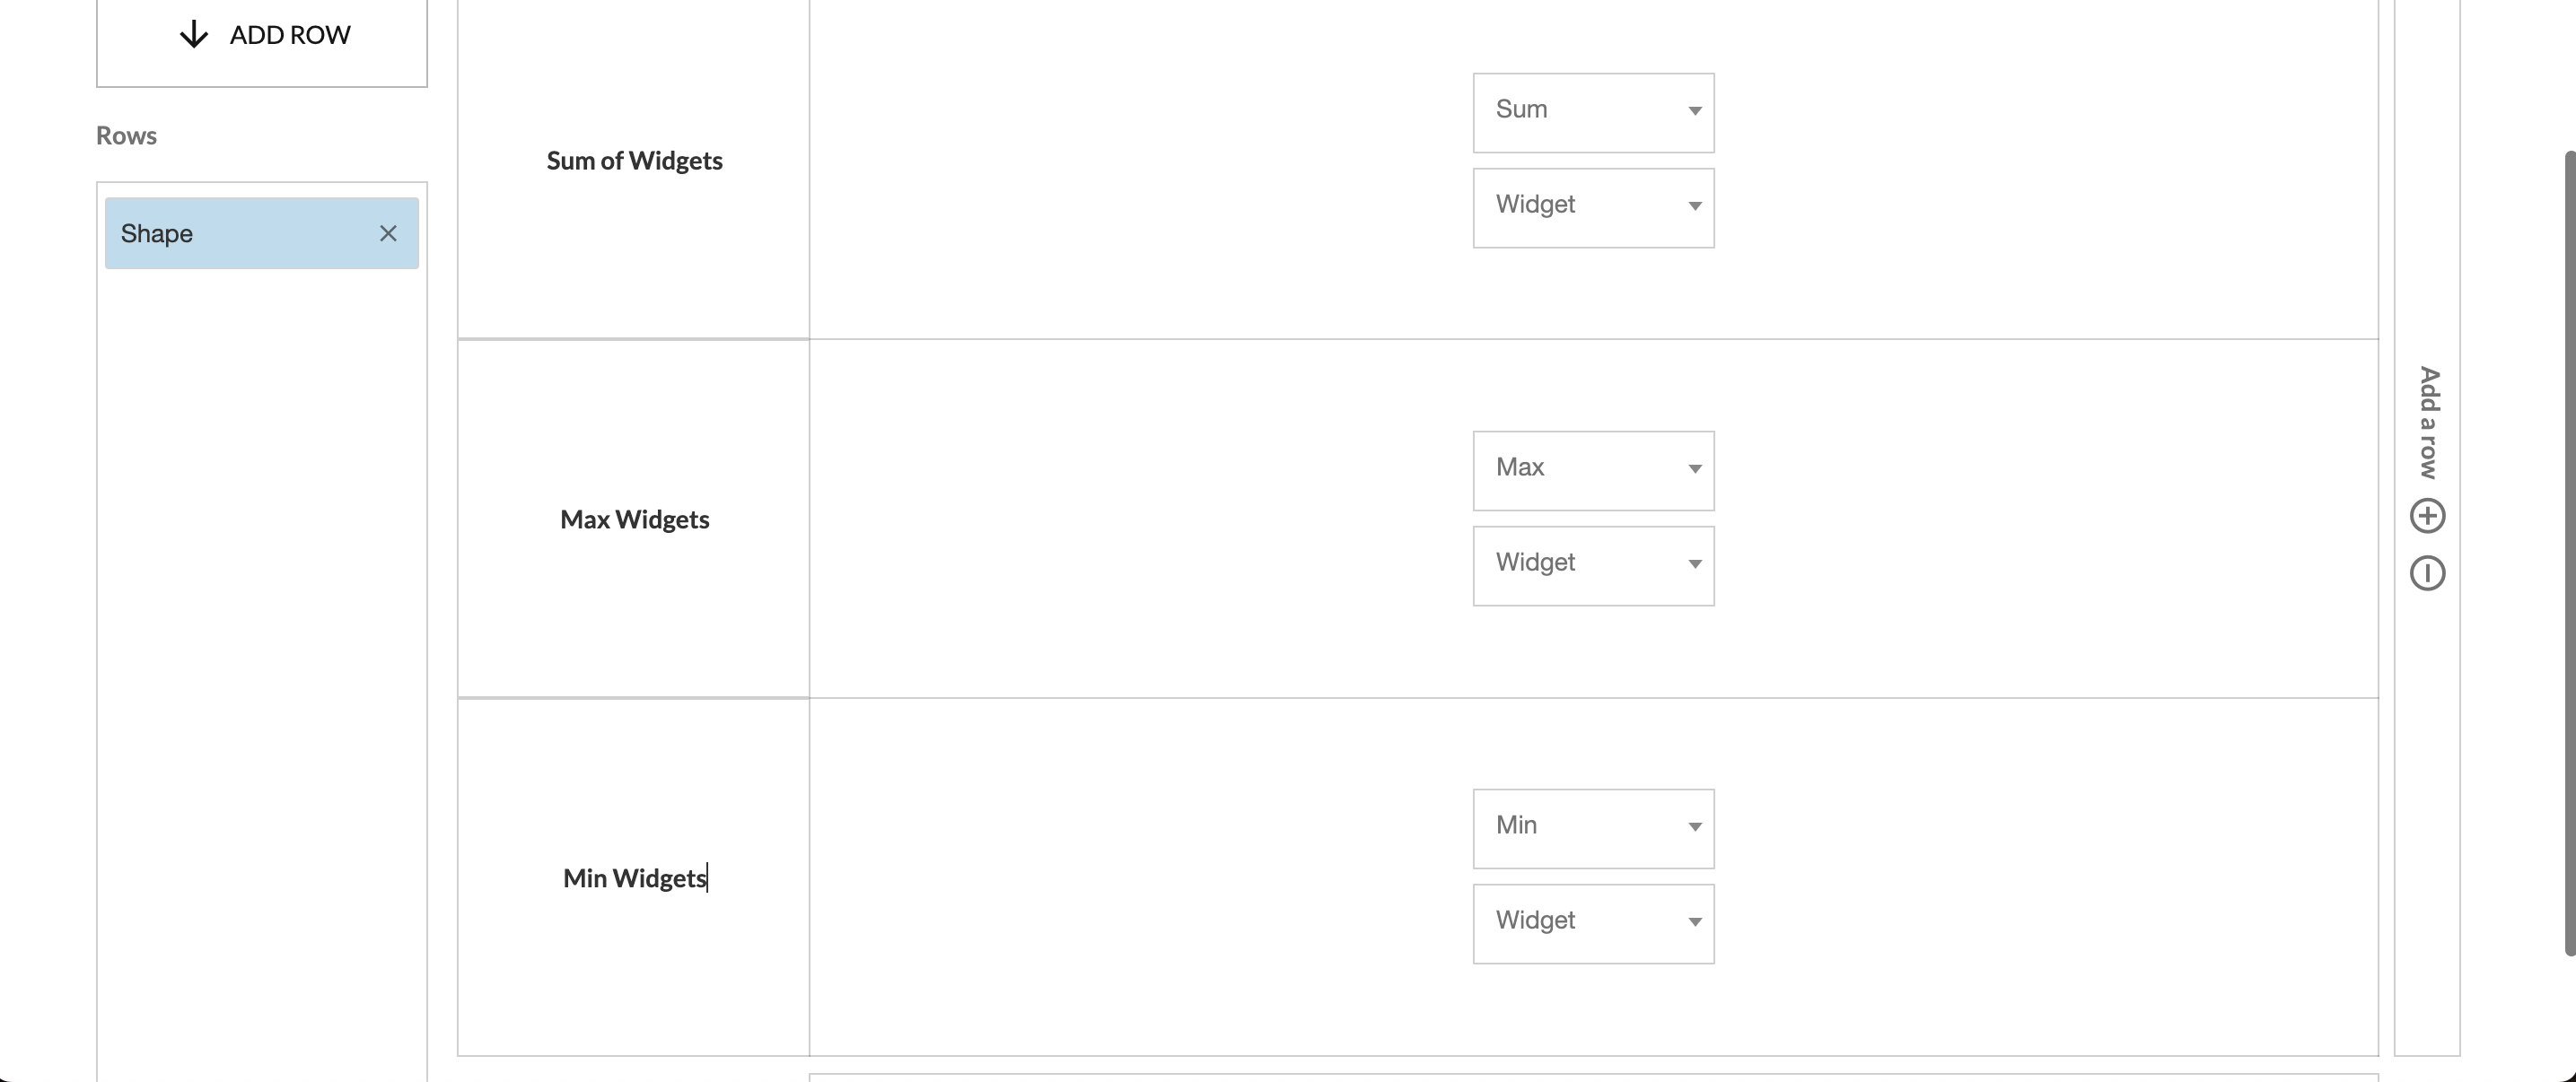
- Add additional value calculations to analyze different metrics across your dimensions by using the +/- buttons located on the right and bottom edges of the values area. For example, we may want to expand our analysis to not only look at the sum of widgets by shape/size but also the max and min number of widgets by shape/size. The below screenshots highlight how you can configure multiple values to generate useful insights.
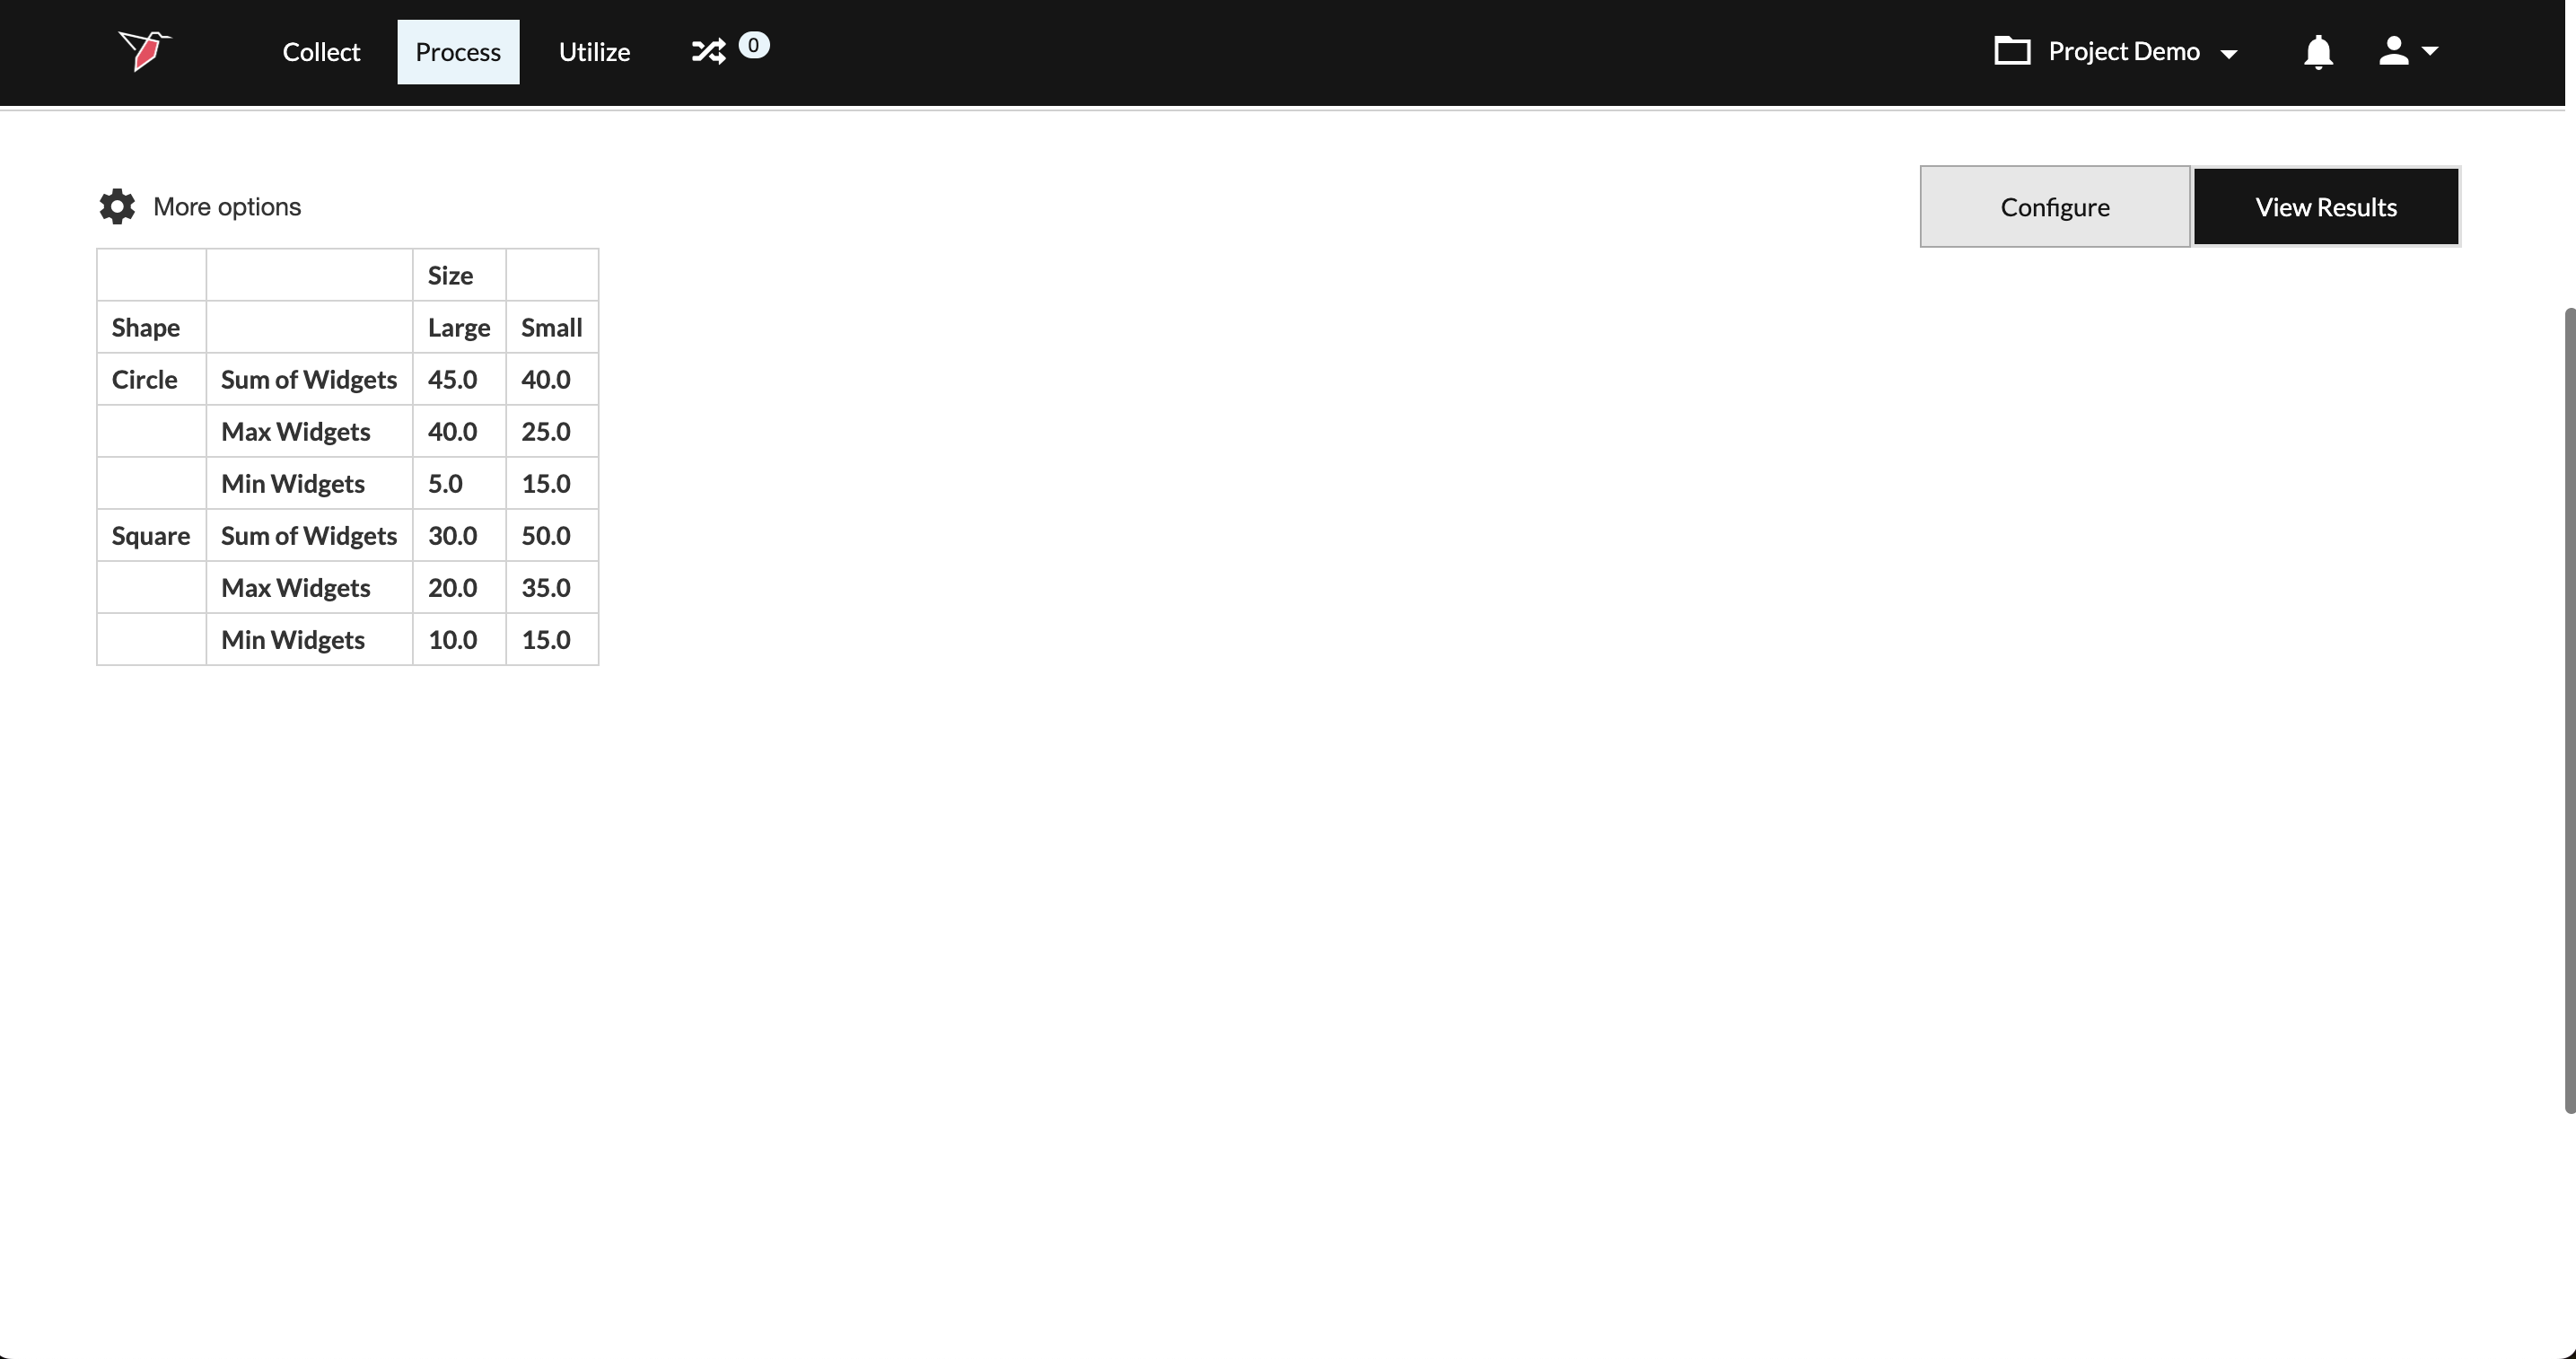
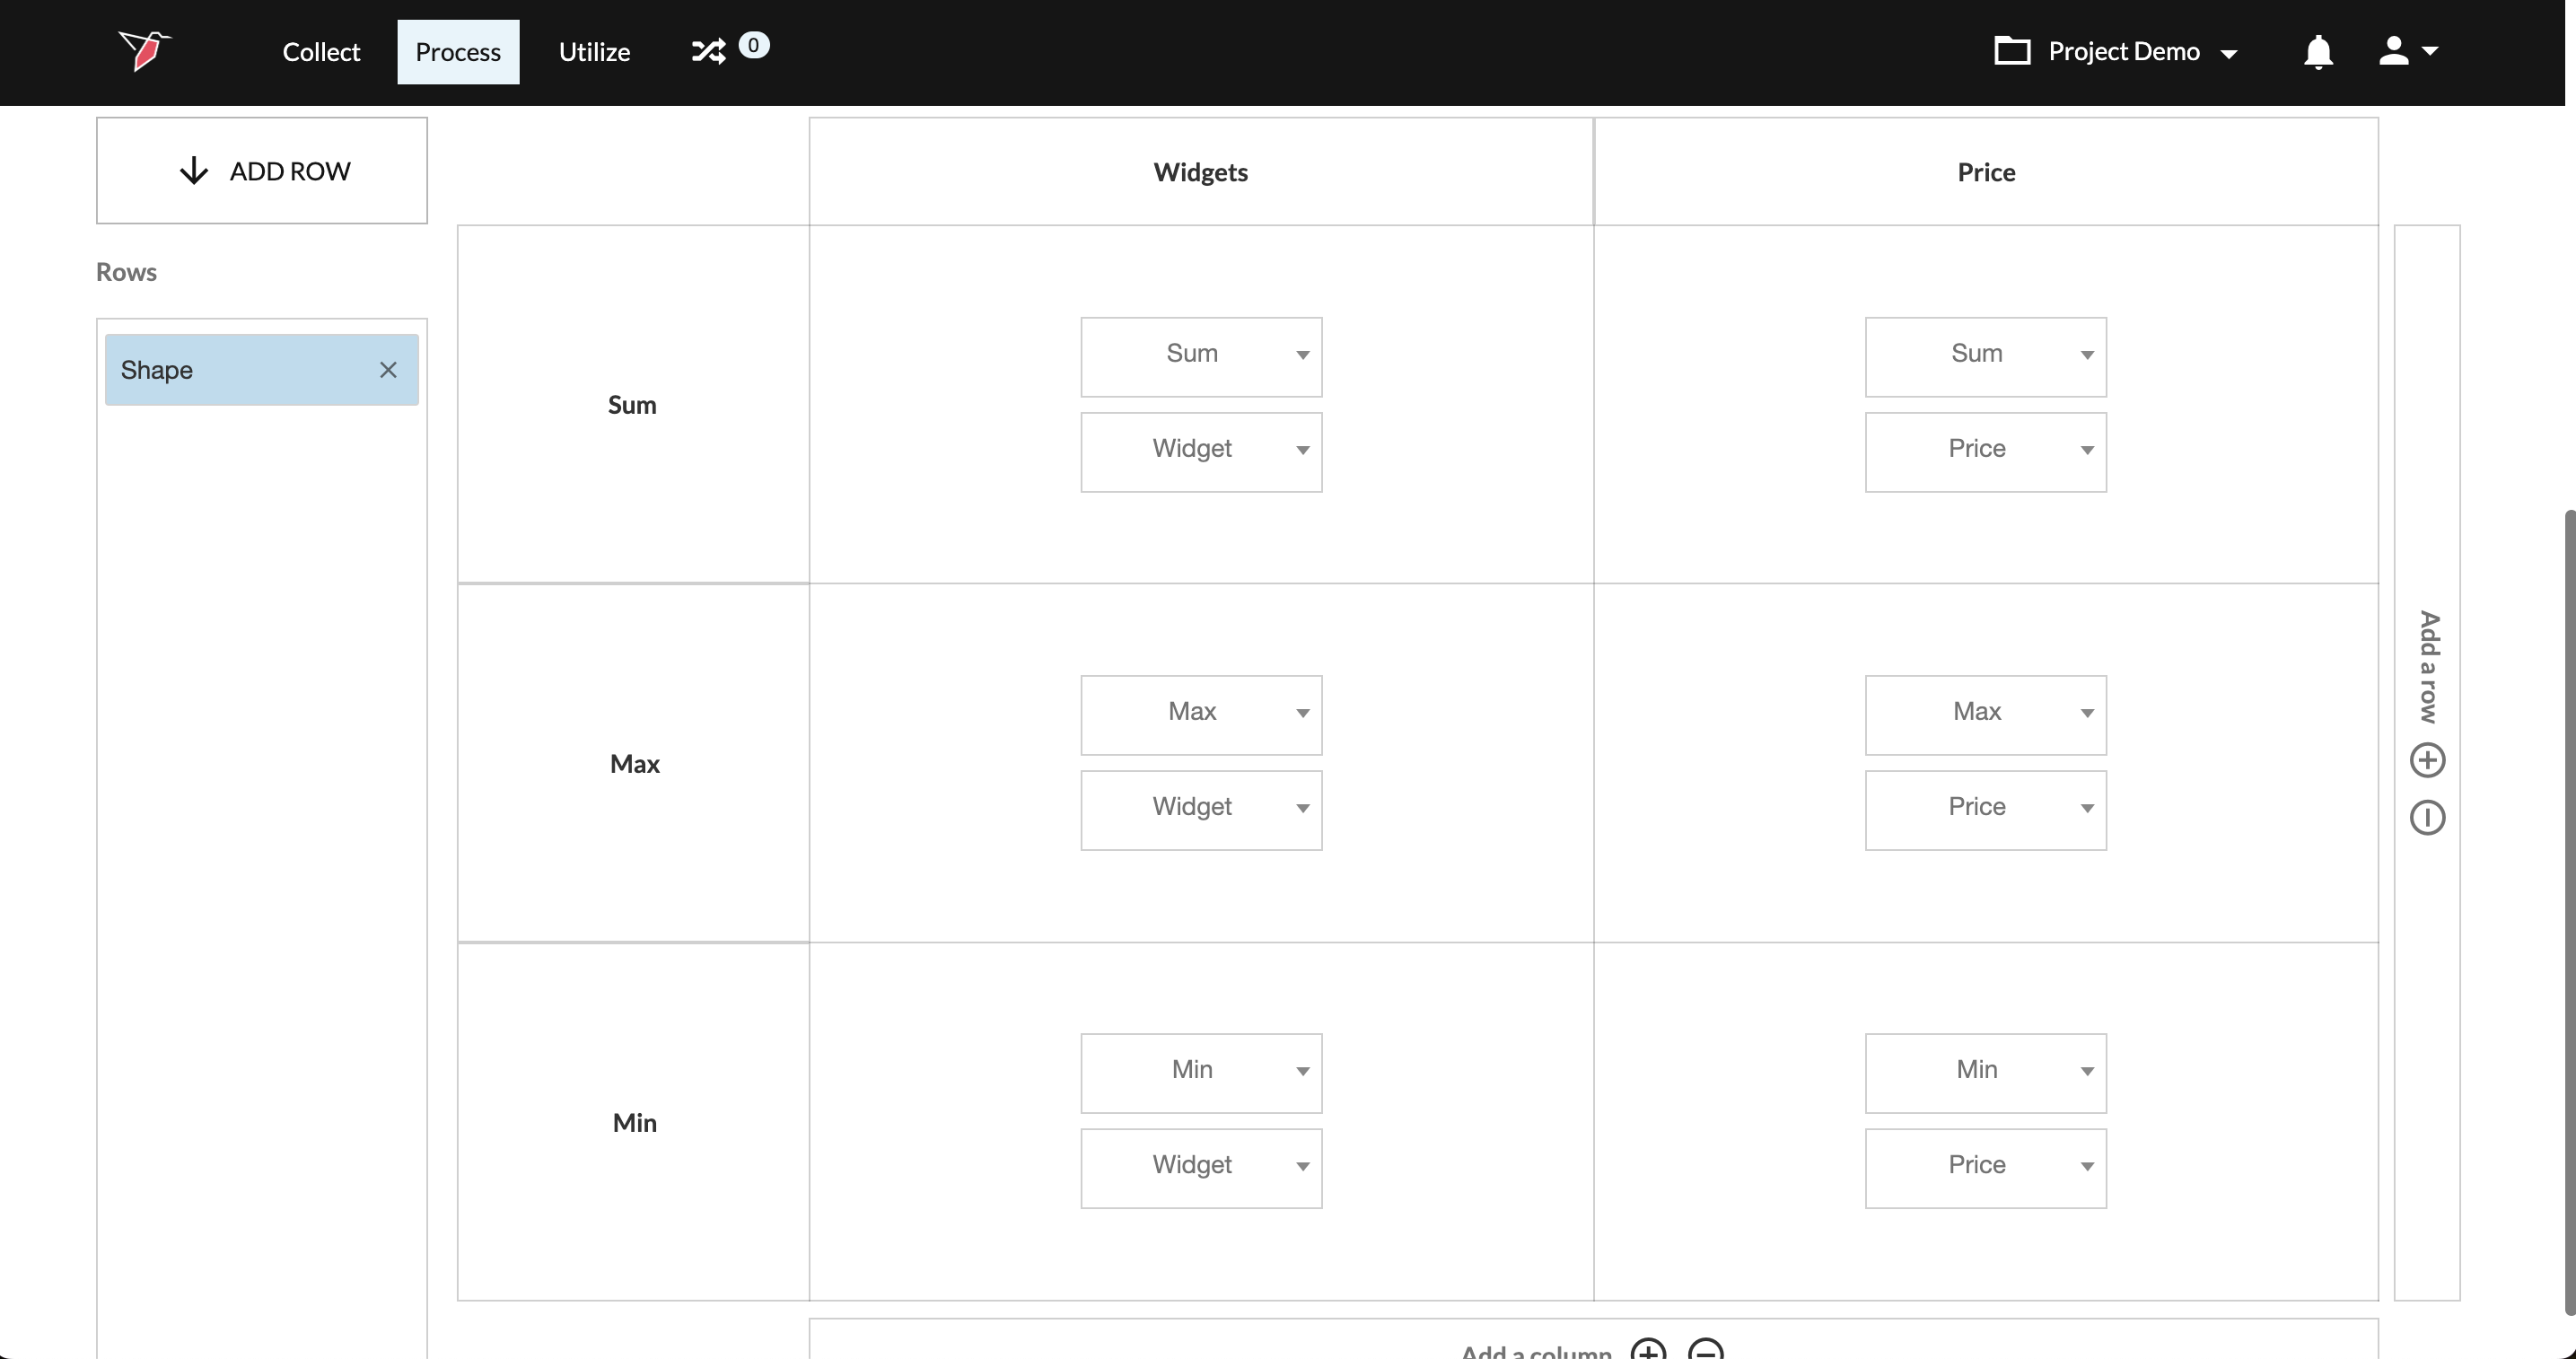
In the above example, we highlighted how we can expand the number of values we analyze vertically. It is also possible to expand the values we want to analyze horizontally. By using the +/- buttons located at the bottom of the values area, we can analyze additional metrics. For example, we may want to explore the sum, max, and min values for price. The below screenshots highlight how we can aggregate our data both vertically and horizontally.
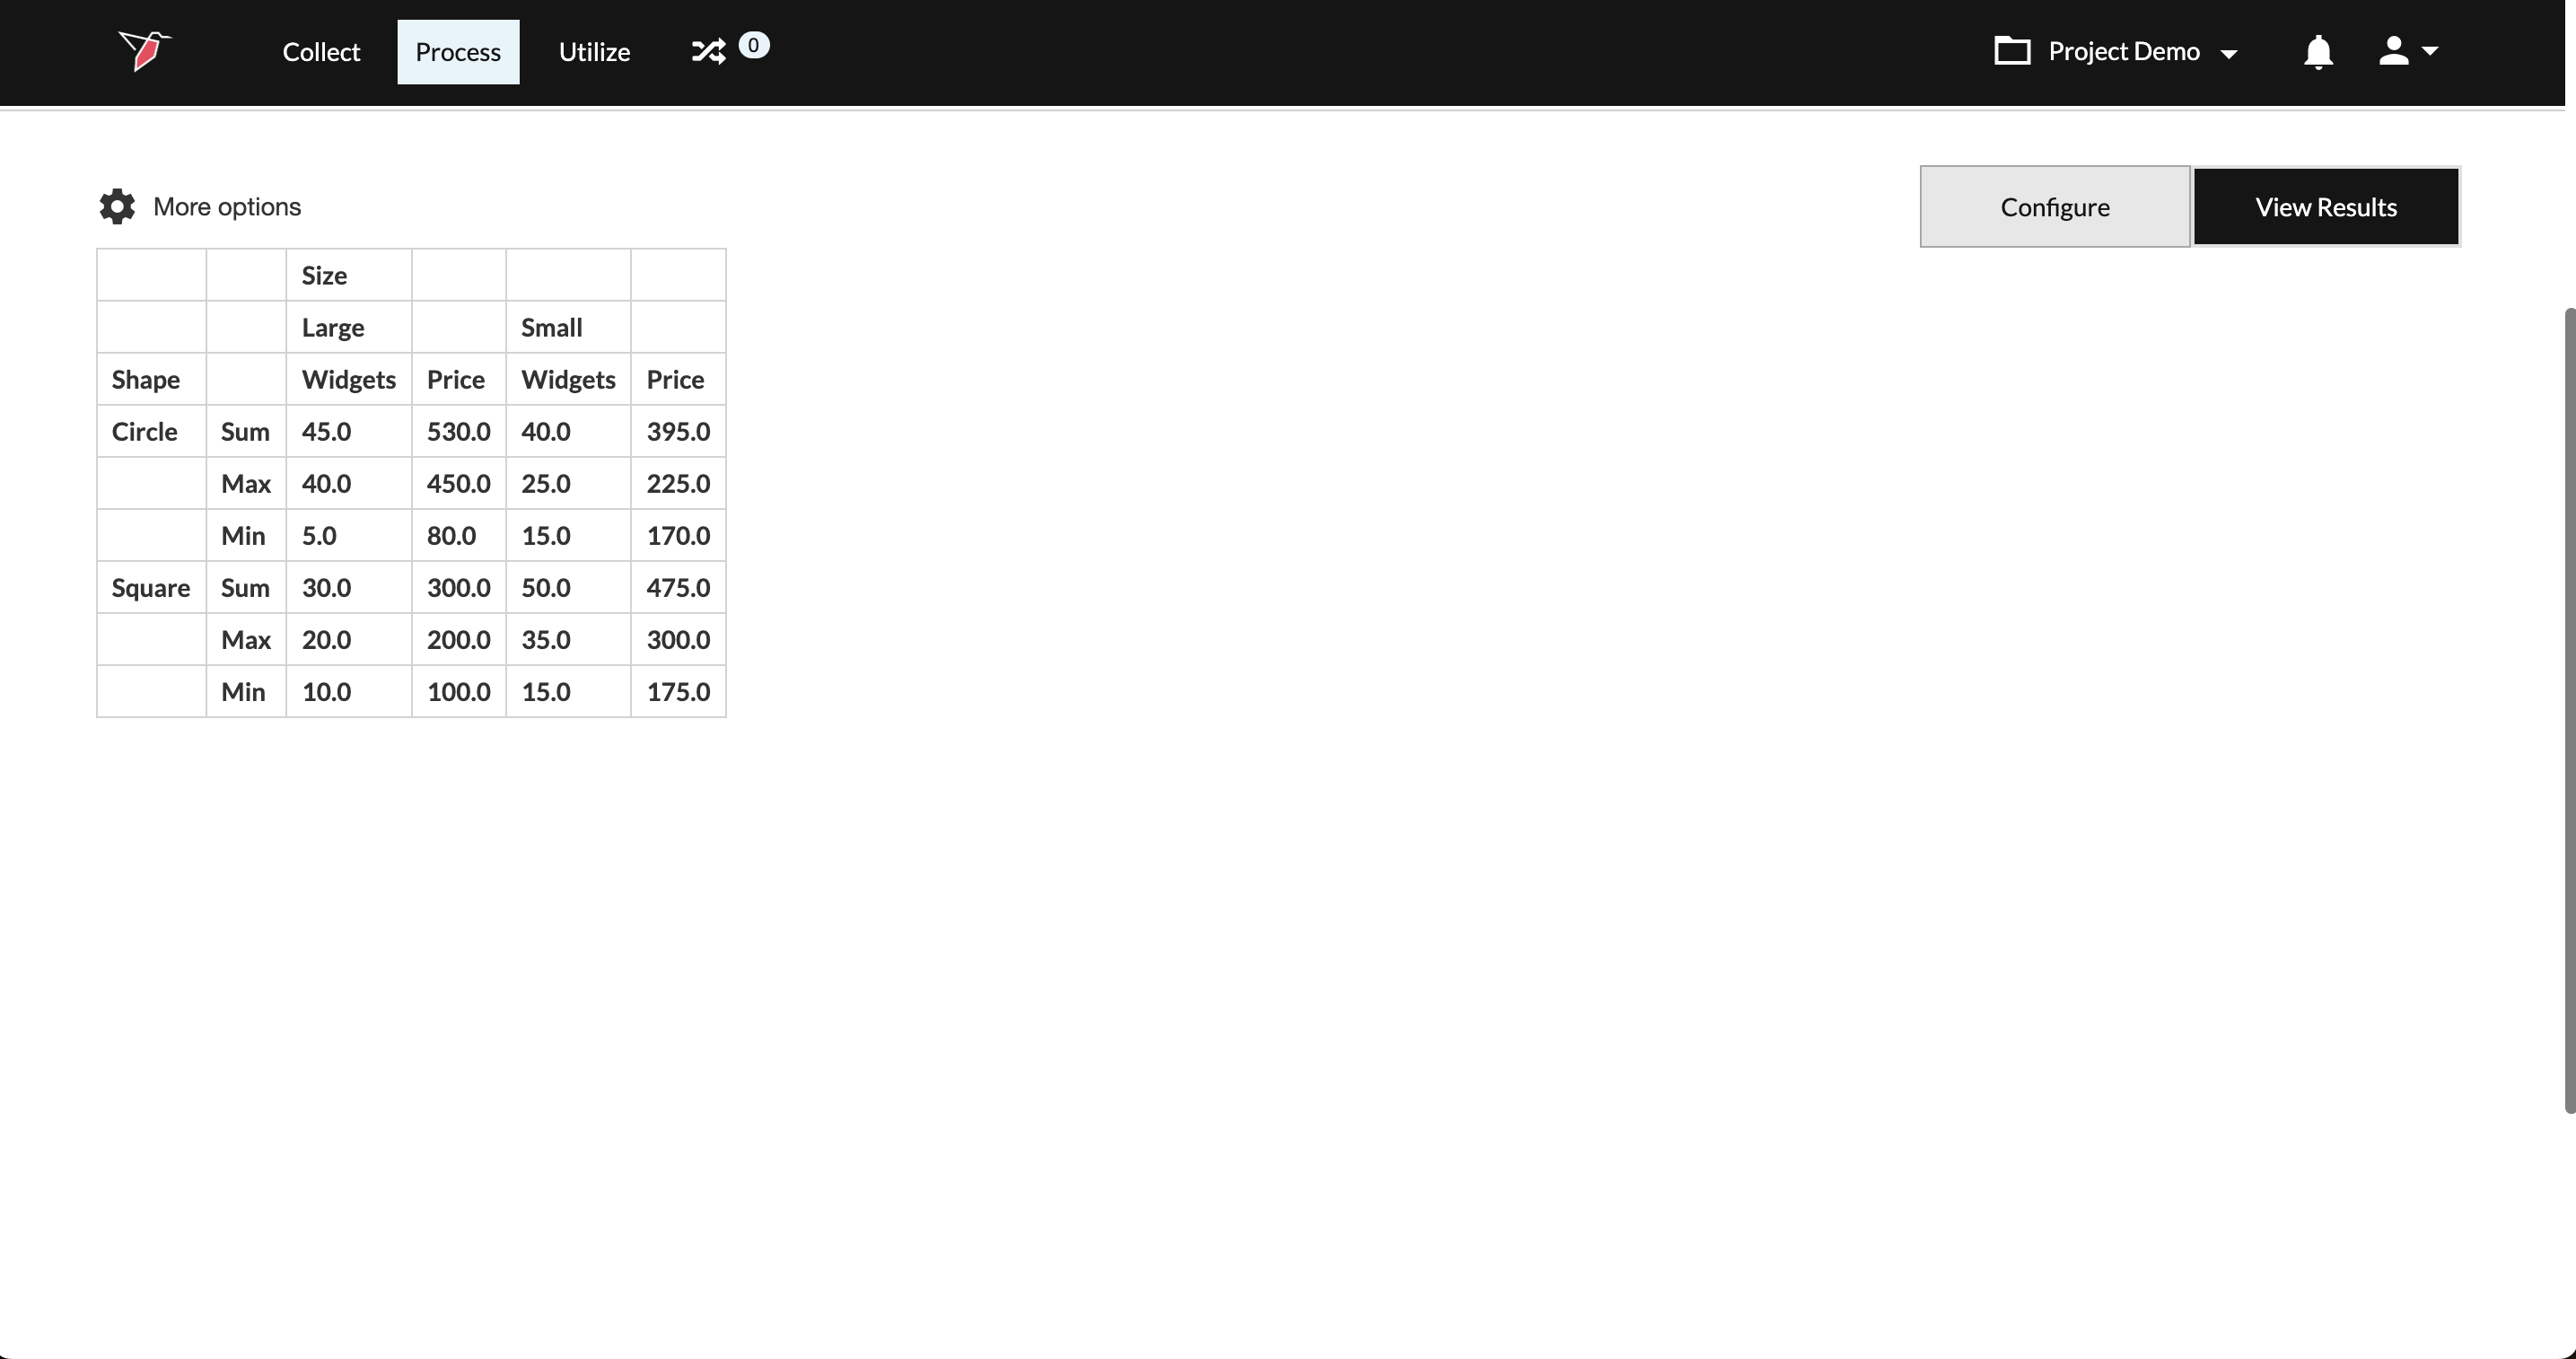
Important:If you decided that you will be adding values both vertically and horizontally, the new columns that are created in your output will combine the names of the labels you set in the configuration. The new columns will follow the pattern of row label + column label.
- Click Save once you are comfortable with the output
- Run the macro
Updated 5 months ago