Getting Started with Dashboards
Introduction
The Redbird platform enables users to produce automated multi-view dashboards using an extensive set of tools and capabilities. Through an easy-to-use point-and-click interface, users can quickly create reusable configurations that accelerate the production of high-fidelity dashboards at scale. This guide will walk through the basics of getting started with your first Redbird dashboard.
Key Terms and Definitions
- Dashboard Object (“Object”): A configurable element that enables users to display analytical outputs and other entities (e.g. a chart, table, textbox, image, word cloud).
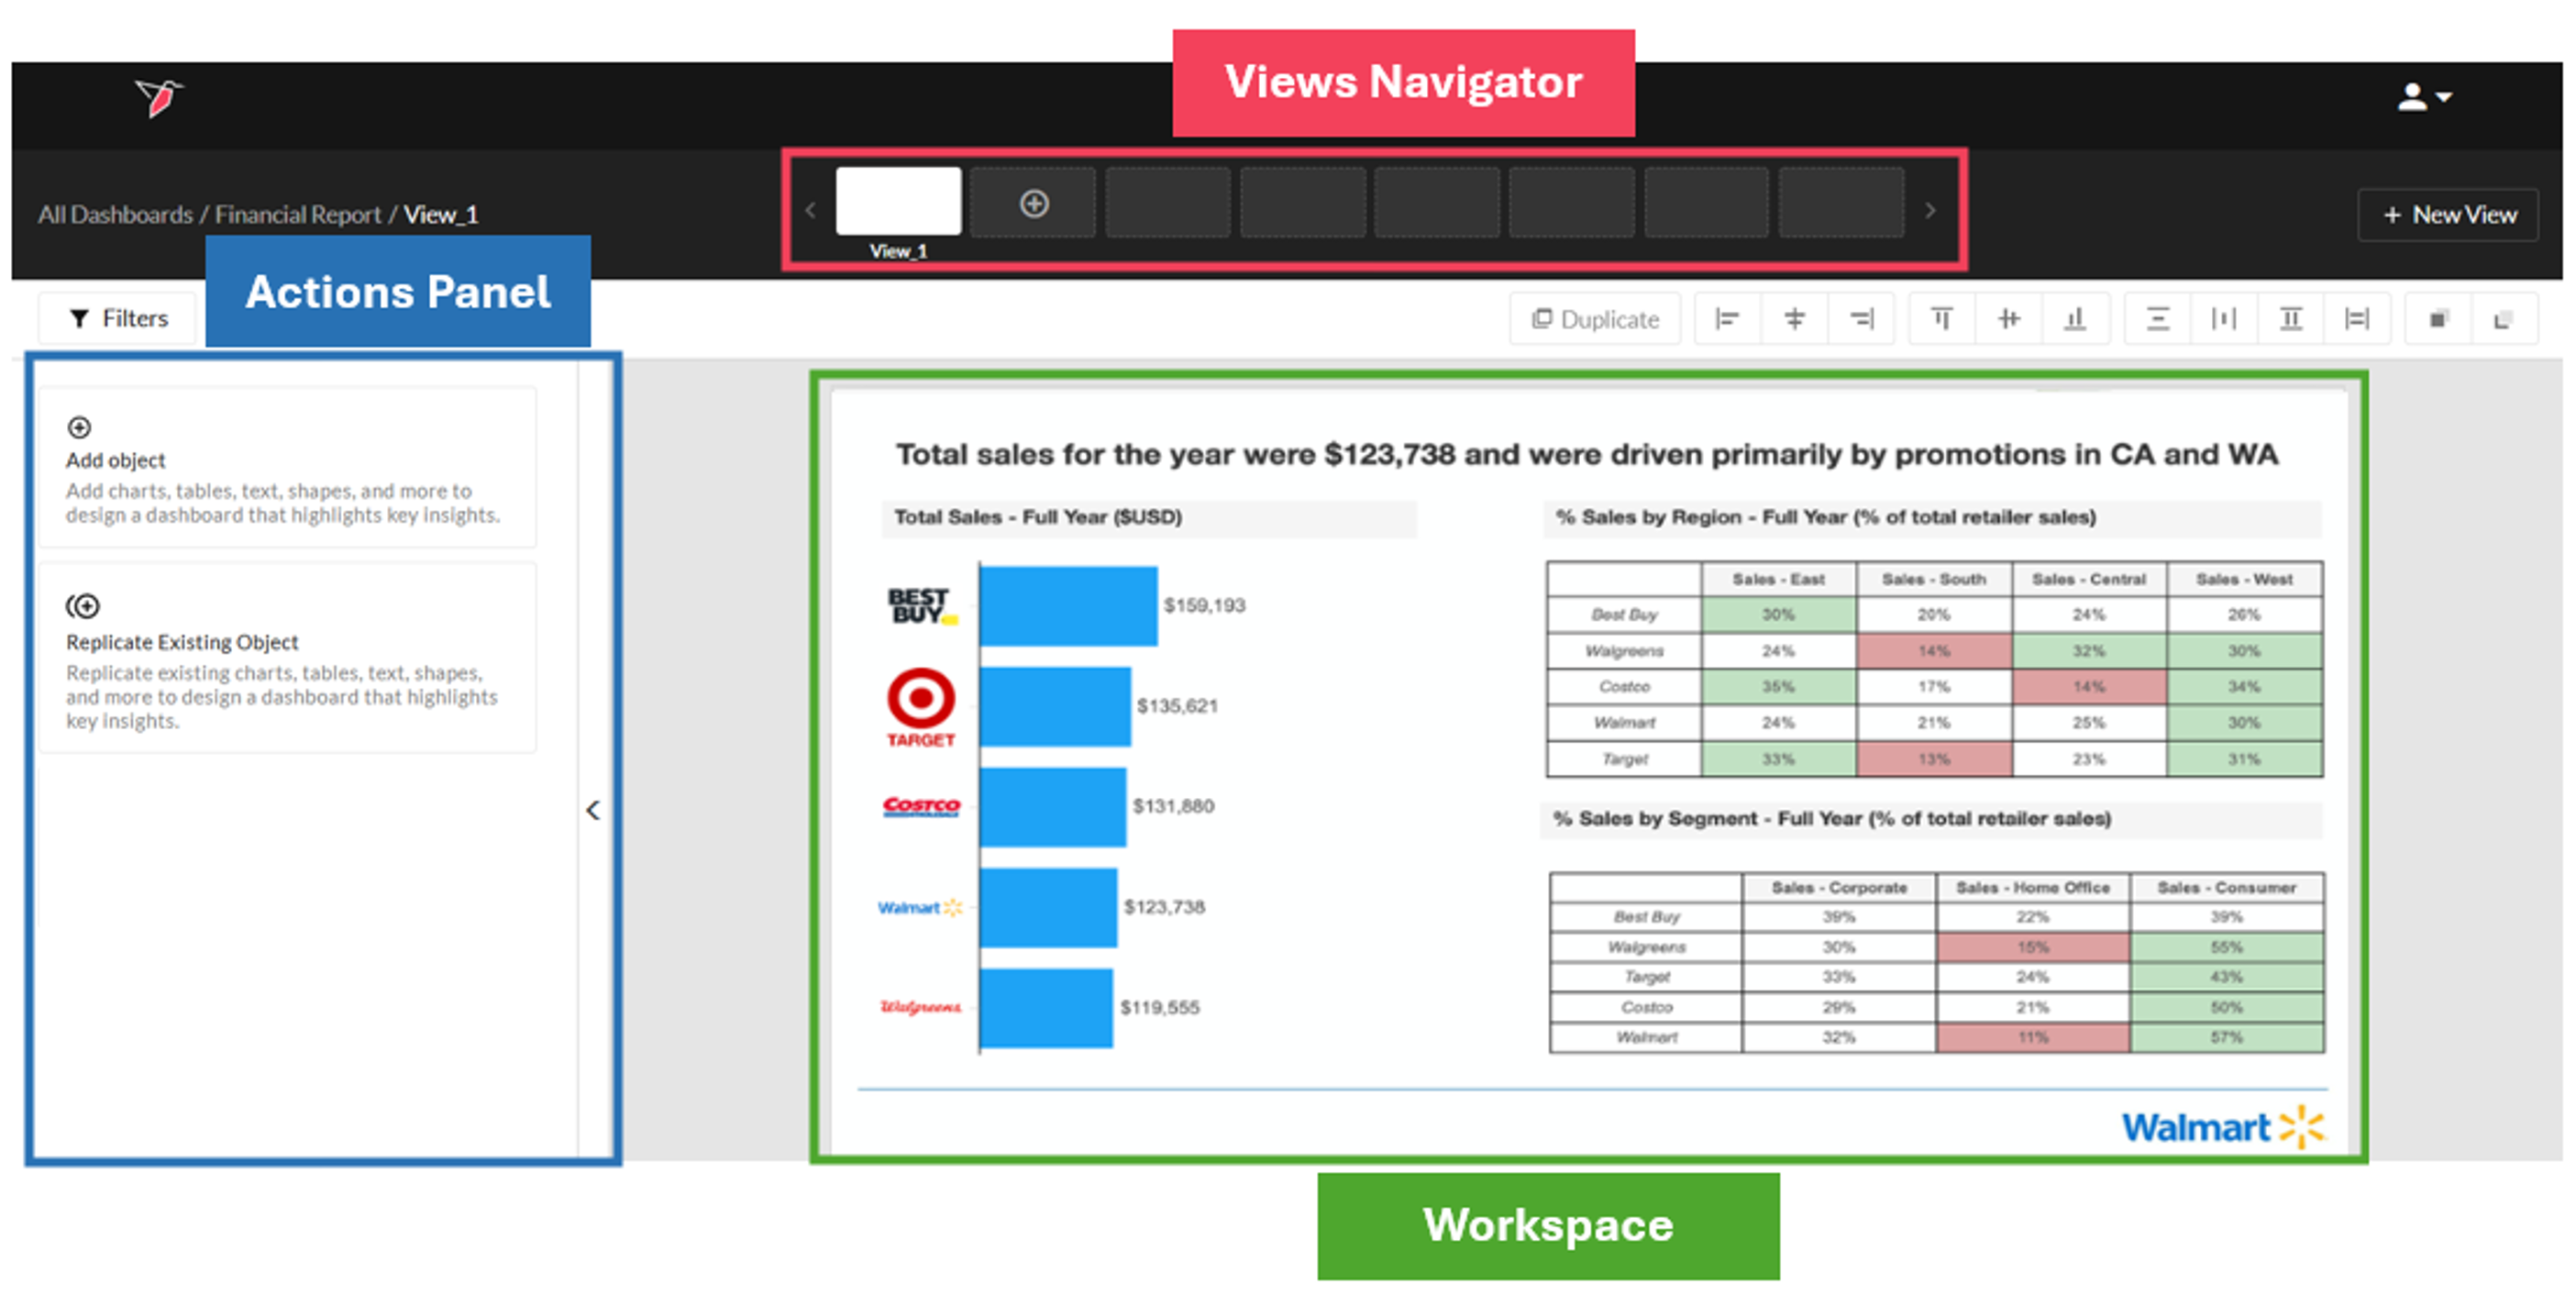
- Dashboard Workspace (“Workspace”): The dashboard builder canvas that the user utilizes to create multi-view presentations within Redbird. Before any objects have been added to a view, the workspace will be empty. As the user adds objects to their workspace, the workspace becomes populated.
- Style: Look and feel elements attached to objects that can be configured to meet the user’s desired criteria. Object styles cut across dimensions such as size, style, color, format, border, alignment, list type, etc. Additionally, Redbird affords the flexibility to save chart styles to a library for rapid reuse and standardization of styles across different views/presentations.
- Interactivity: The ability to double-click on specific data points to dive deeper into the underlying data and understand what is driving an analytical output at a granular level.
- Object Arrangement: Criteria that define the alignment, distribution, and positioning of objects across the workspace. Upon selecting objects, a user can determine relative alignment (left, right, center, top, bottom), distribution (horizontal or vertical), dimensions (width or height), or layering (front, back, forward, backward) relative to other objects in the workspace.
- Actions Panel: The collapsable panel to the left of the dashboard workspace that allows a user to add, configure, filter, arrange, and style objects. As the user makes selections in the actions panel, the workspace will adjust to reflect changes.
- Published Dashboard: A published dashboard is one that has been set for sharing across an organization. Published dashboards are published to a project folder of the publisher’s choosing and can be set with limited view-only permissioning for executive-level access via a shared link. Whereas Published dashboards can be refreshed and updated with new data by running a workflow, any structural changes made to a dashboard in builder mode after it has been published will not be carried through to the published dashboard. The dashboard would need to be republished if you wish to carry these changes through, however, you can republish to the same public link if required.
- Slide Template: Slide blueprints, uploaded from PowerPoint, to ensure a consistent look and feel for your Redbird dashboard.
Note: Dashboards work with standard structured tabular datasets only. If your underlying data is in a File Collection node, you must first extract or transform it into a structured dataset before connecting it to a dashboard.
See more information here.
The Dashboard Building Process
There are several steps that go into building, reusing, and sharing a dashboard. The high-level process is outlined below:
Step 1: The user creates a new dashboard, selects a name, and uploads a default template.
Step 2: The user utilizes the actions panel to add and configure objects in their workspace.
Step 3: The user can add multiple views, establish styling, arrange objects, and interact with data points to ensure a robust presentation
Step 4: Filters can be adjusted for individual views or the entire dashboard to update the data being visualized
Step 5: Sharing with executives and relevant stakeholders via a published dashboard or Powerpoint/PDF export
Step 6: Re-run the dashboard workflow manually or on a set schedule to benefit from automated efficiency
Important:Dashboard creation within Redbird ensures that data workflows can be fully automated across the data life cycle: Collection -> Processing -> Outputs. Although outputs are exportable to PowerPoint, we advise leveraging this capability for sharing purposes only (and not to change Redbird dashboard objects) to ensure workflows remain intact and repeatable.
To create your first Redbird dashboard, follow the steps below:
- Click the plus icon in the upper left-hand corner to open the panel. Select Outputs and drag and drop a "Dashboard Builder" node onto the workflow canvas. Connect it to your dataset node.
- Double-click the dashboard node to start editing. In this step you are also able to name the dashboard and upload a slide template from PowerPoint to ensure a consistent look and feel across your presentation. For more details about utilizing templates, view our Slide Templates guide.
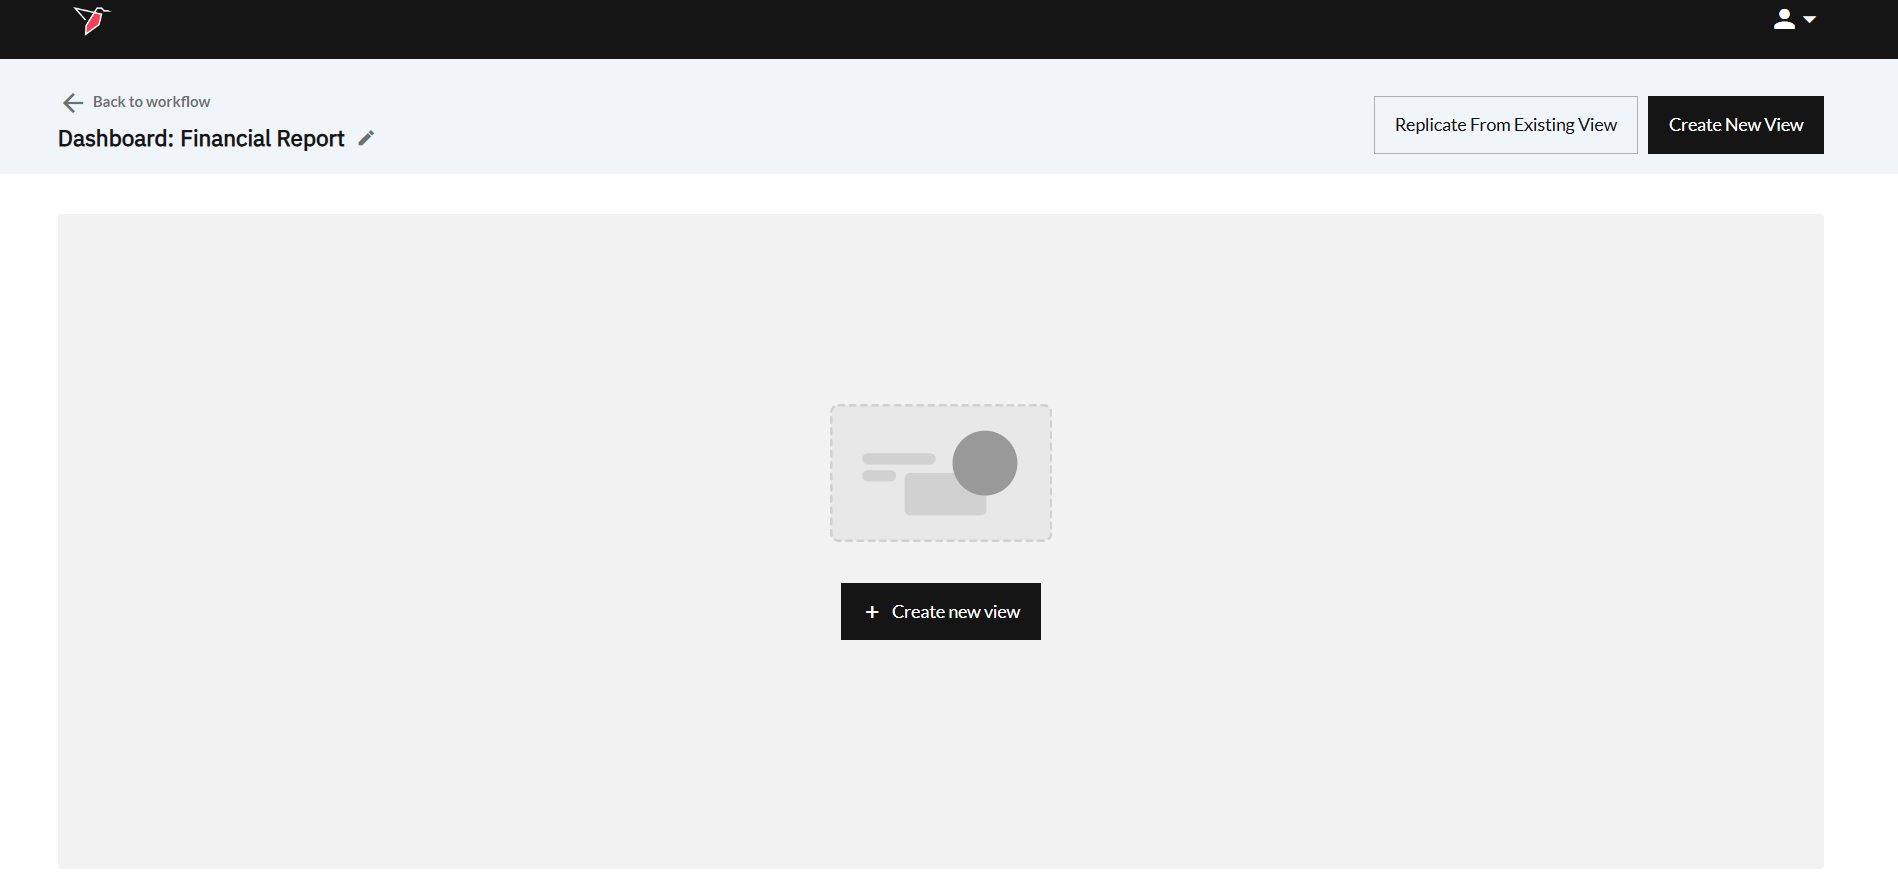
- Once you click Done, you can start adding views to your dashboard by clicking Create New View in the top right or in the middle of your screen. You are also able to replicate a view from another dashboard in the same project folder by clicking the Replicate From Existing View button.
- Double click the view you just created and build your dashboard by adding, arranging, and styling objects in your Workspace using the left Actions Panel. Once you have the relevant objects configured, you can also use the actions panel to filter which data drives your outputs dynamically. Use the Views Navigator functionality to quickly move between views in your dashboard.
- Click the name of your dashboard in the breadcrumbs in the top right to go back to the list of views within this dashboard. From here, you can drag and drop views to change their order. You can access additional options by returning to the canvas, clicking the dashboard node and using the Actions Menu. Additional options include:
- Edit to see the Views associated with the dashboard and make changes.
- Publish Dashboard to share your dashboard with other users via a permission-limited link within Redbird. For more information on publishing dashboards, view our Publishing Dashboards guide.
- Change Template to upload a new slide template of your choosing. Additional information about slide templates can be found in our Slide Templates guide.
- Run to refresh all the objects in the dashboard, for example, to display any new data that has entered the workflow.
- Delete to permanently delete your dashboard. You can also delete multiple slides at once by clicking select in the top-right of the screen, then clicking on all slides you wish to delete, finally click Delete Selected.
- Share to grant View or Edit access to other users.
- Download to create an exportable, deep copy of your presentation in PowerPoint. More information on exporting to PowerPoint can be found here.
- Connections shows which nodes are upstream and downstream of the selected node.
- To replicate this dashboard and reattach to new data using Redbird’s mapping wizard, click the copy icon at the top of the screen and paste it into the desired canvas (using the paste clipboard icon next to it). For more details about copying a dashboard, visit our Copying Dashboards guide
- Select and
Now that you’ve created your first dashboard, you can explore more advanced dashboarding concepts using the subsequent articles in this guide, beginning with Navigating The Workspace.
Updated about 2 months ago