Dashboard Management - Publishing Dashboards
Background
After you have built a dashboard within the Redbird platform, you may find it necessary to share the dashboard with internal or external stakeholders. Using the Redbird platform, you can publish the dashboard and configure its settings to meet your specific sharing requirements. For example, you can:
- Make your dashboard available to other team members within the Redbird platform
- Create a publicly accessible URL to be shared with non-Redbird users
- Rename filters or datasets
- Reorder datasets
- Consolidate filters from various datasets to create universal filters that update the whole dashboard at once
- Control how viewers can utilize the Explore feature within a dashboard by controlling their access to filters, show/hide columns, and permission to download the underlying data
Once a dashboard is published, its contents are fixed at the point of publication—even if the underlying dashboard (from which you published) is later updated.
The published dashboard will only refresh when it is explicitly run by opening it and clicking Run in the right-side panel.
How to Publish a Dashboard
To publish a dashboard:
- Click on the dashboard builder node that you want to publish. Within the right side panel, select Publish Dashboard.
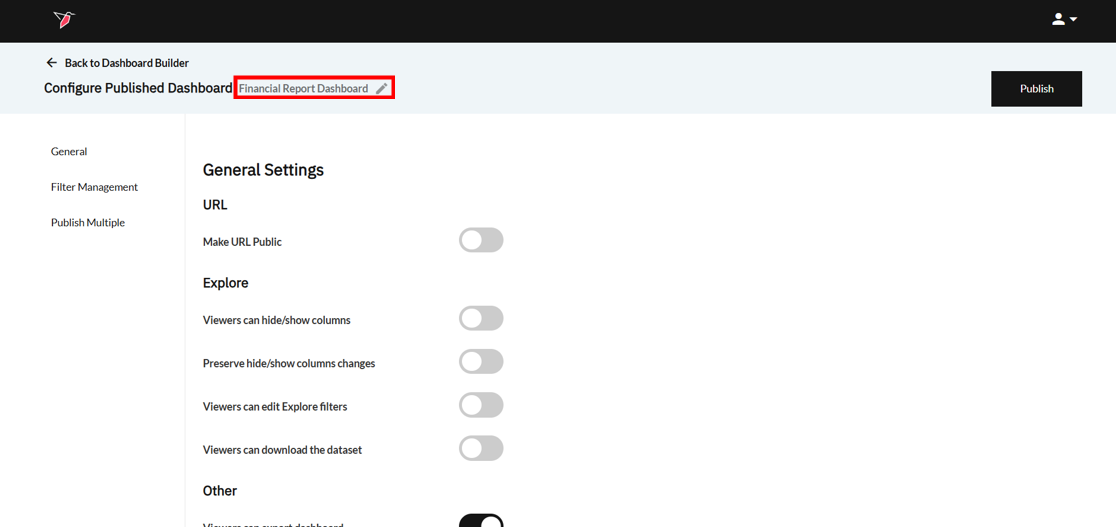
- Provide your published dashboard with a name for future reference. This name will be associated with your published dashboard node and other stakeholders within Redbird or individuals with access to the URL can see it.
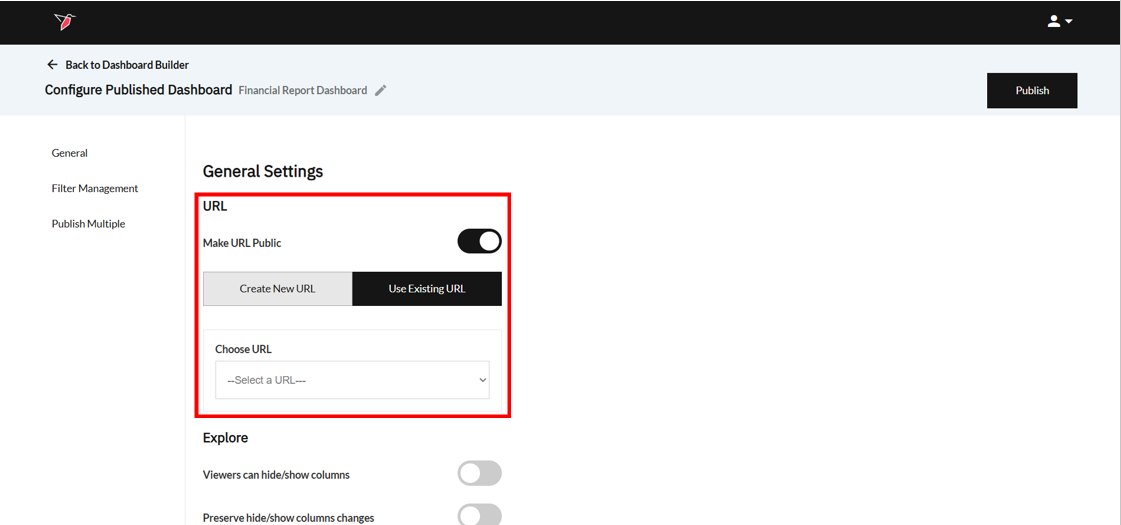
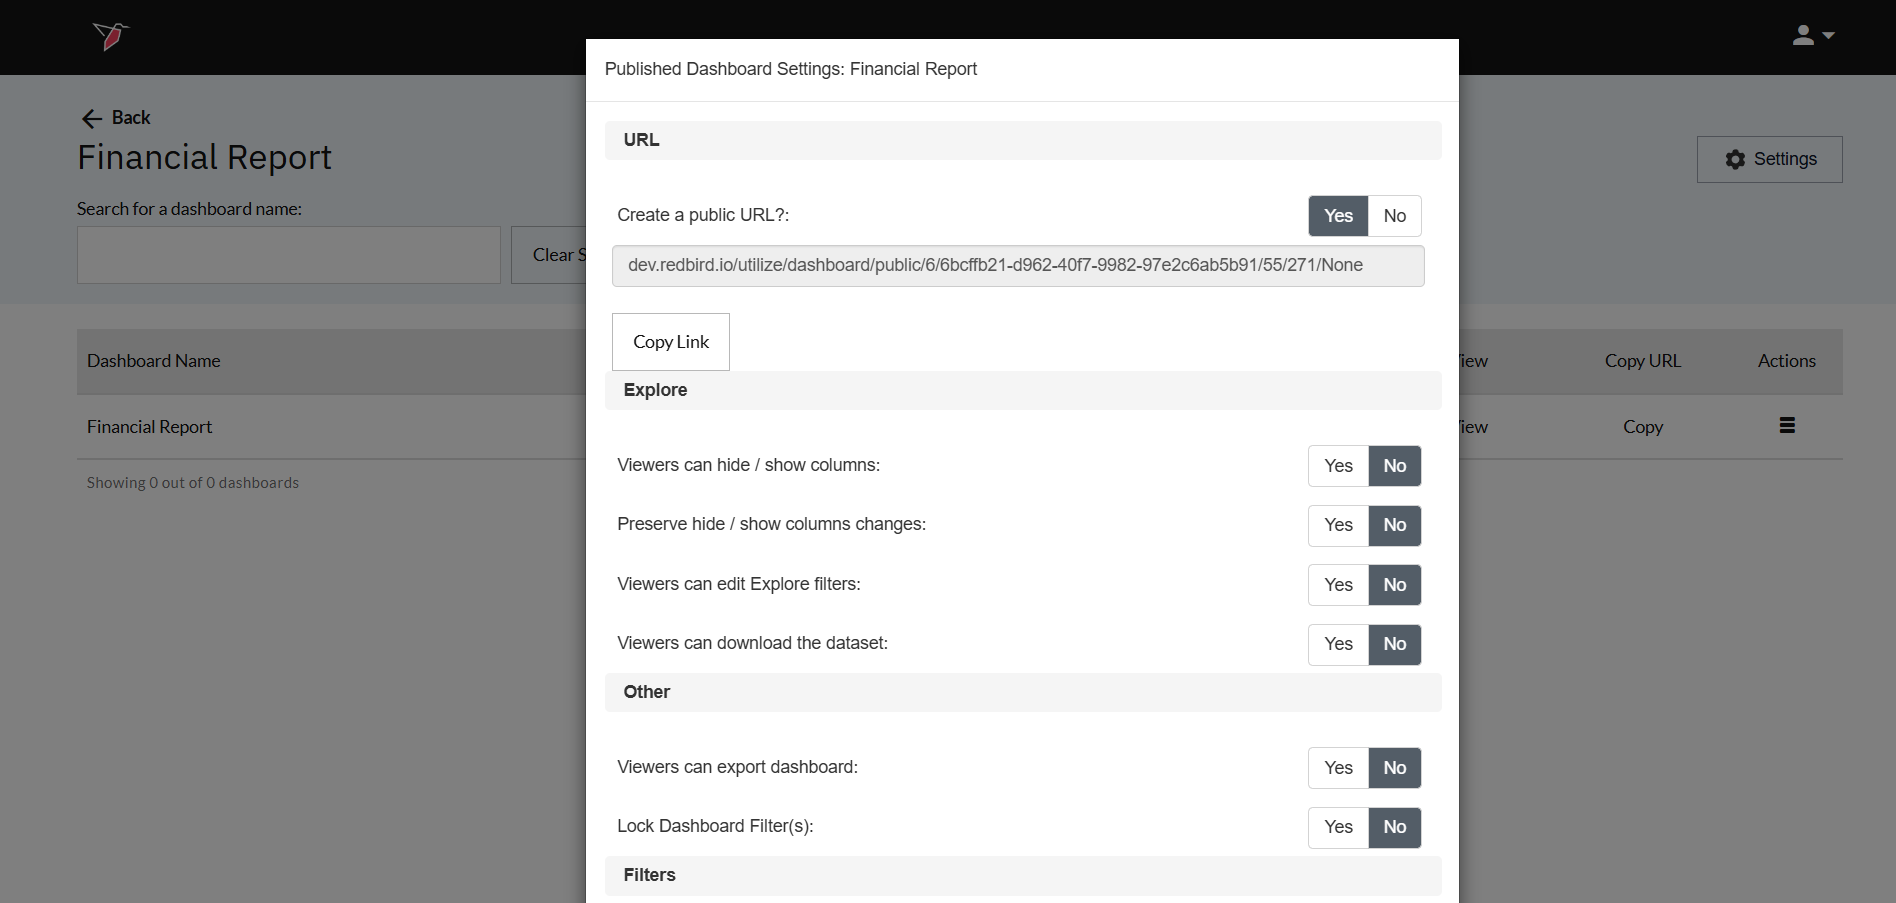
- The dashboard will be accessible on the workflow canvas you created it on. To also share access to the published dashboard without needing to log in to Redbird, toggle on Make URL Public within the URL section. You will then have the option to Create a New URL or Use Existing URL(if you have previously published a dashboard to a URL).
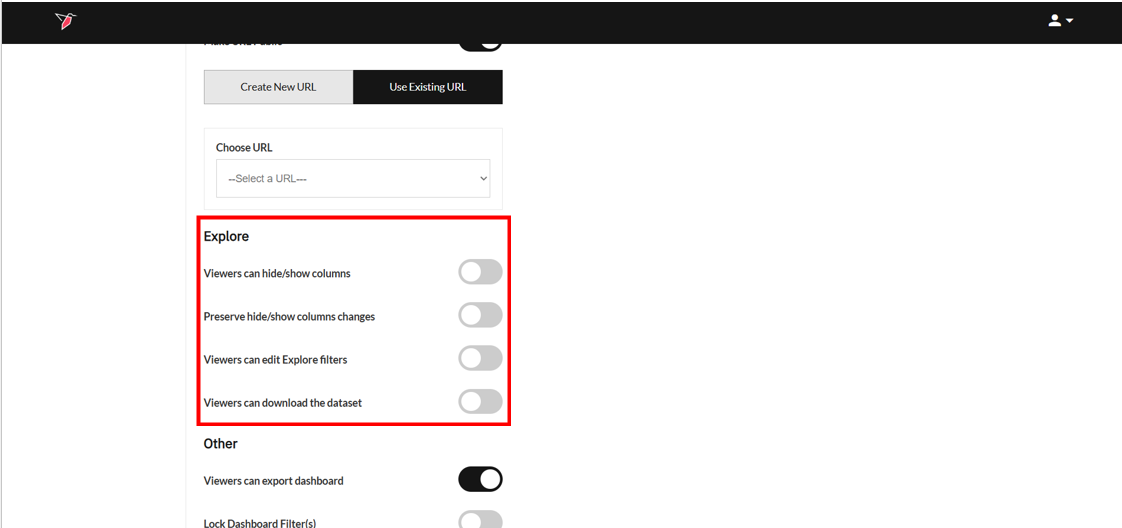
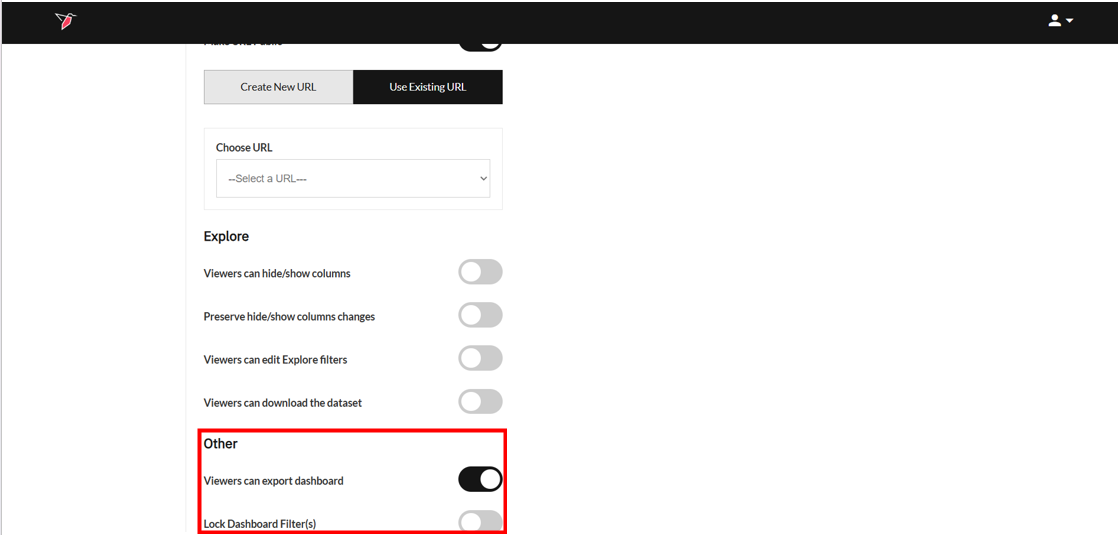
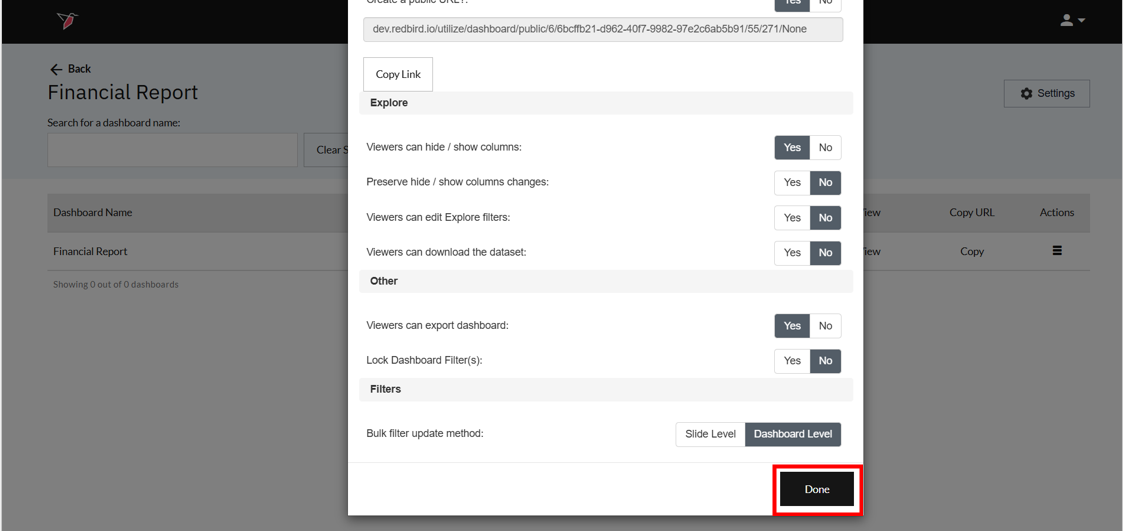
- Within the Explore section, you can enable certain permissions for the viewer when using the 'Explore' function to see the underlying dataset (accessed through double clicking on a data point in a chart or a cell in a table). Toggle on or off whether:
- Viewers can hide/show columns
- Any hide/show column changes a viewer makes are preserved
- Viewers can edit Explore filters
- Viewers can download the dataset
- Within the Other section, you can enable the ability for viewers to export the dashboard to Excel and/or lock the left side panel so users don't have to open and close the filters.
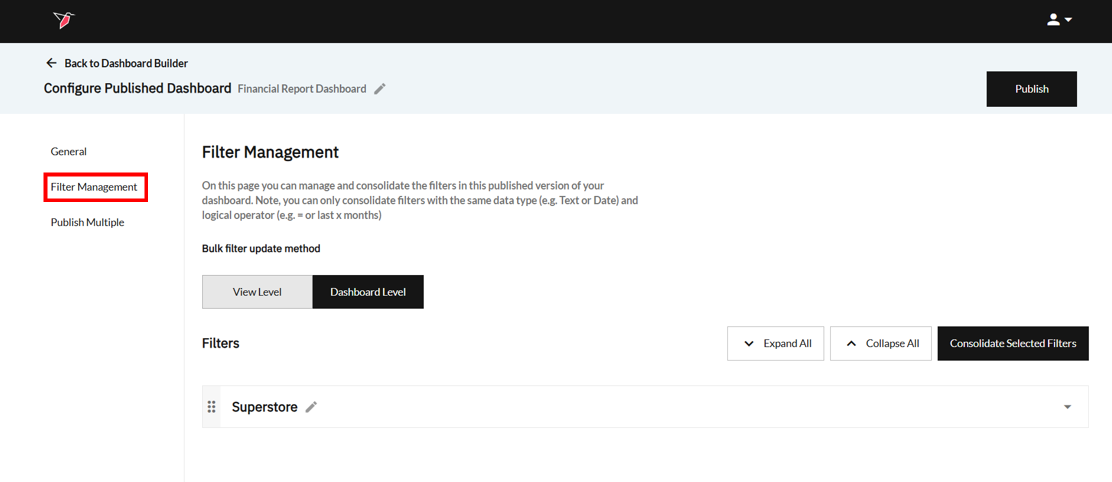
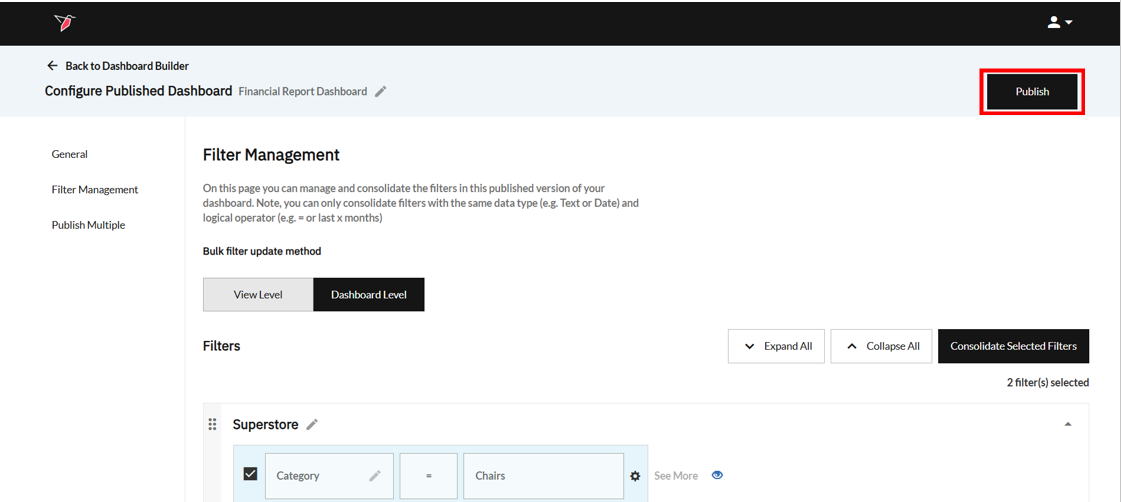
- Shift to the Filter Management page by clicking Filter Management in the left-side navigation, if you wish to consolidate or edit how filters appear in the published dashboard.
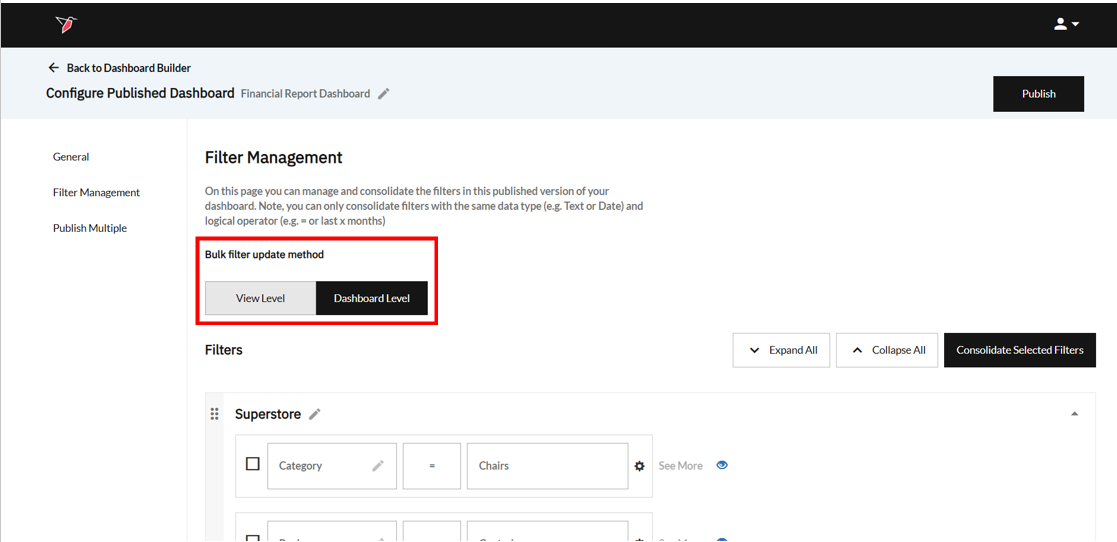
- Under the Bulk Filter Update Method section, choose how you want the filters to appear in the left-side navigation pane of the published dashboard. View Level means only filters from the current view are visible, whereas Dashboard level will show you all filters from the dashboard at once.
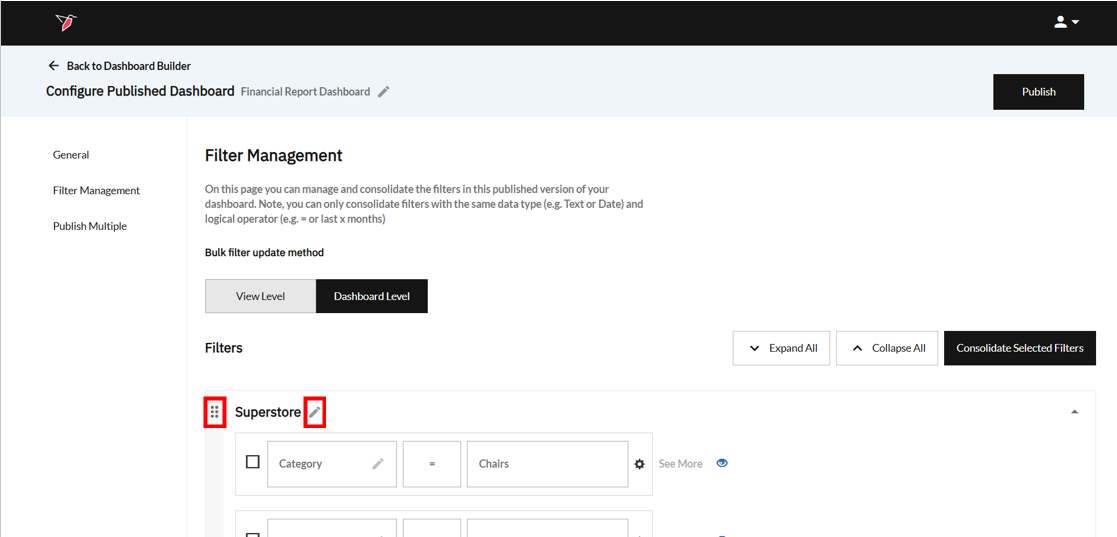
- Within the Filters section, you will see each dataset used in the dashboard in its own collapsable container. You can rename it by clicking on the pencil icon and reorder them by grabbing the 6 dots.
- Review the filters that are currently associated with your dashboard. Filters are grouped under the datasets to which they belong. Rename them if you wish by clicking on the pencil icon. You can hide any filters you don't want to be shown on the published dashboard by clicking the blue eye icon.
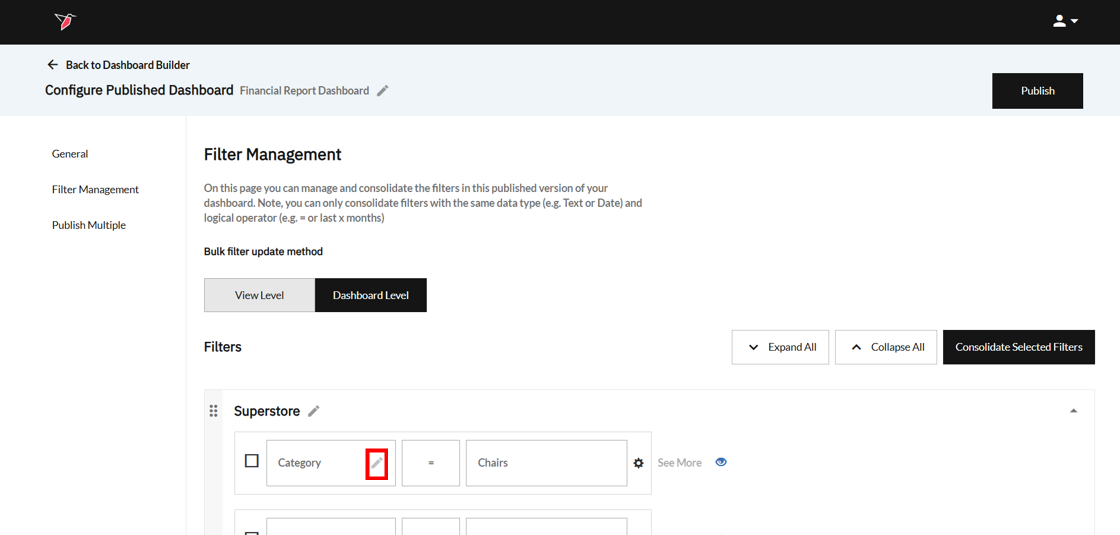
Note: Changing Selection TypeBy default, filters will be multi-select. You can change the filter type to single-select by clicking on the settings cog on the right-hand side of any filter while on the Filter Management page.
- You can also consolidate filters. To do so, select the individual filters you wish to consolidate by clicking the checkboxes, then click Consolidated Selected Filters.
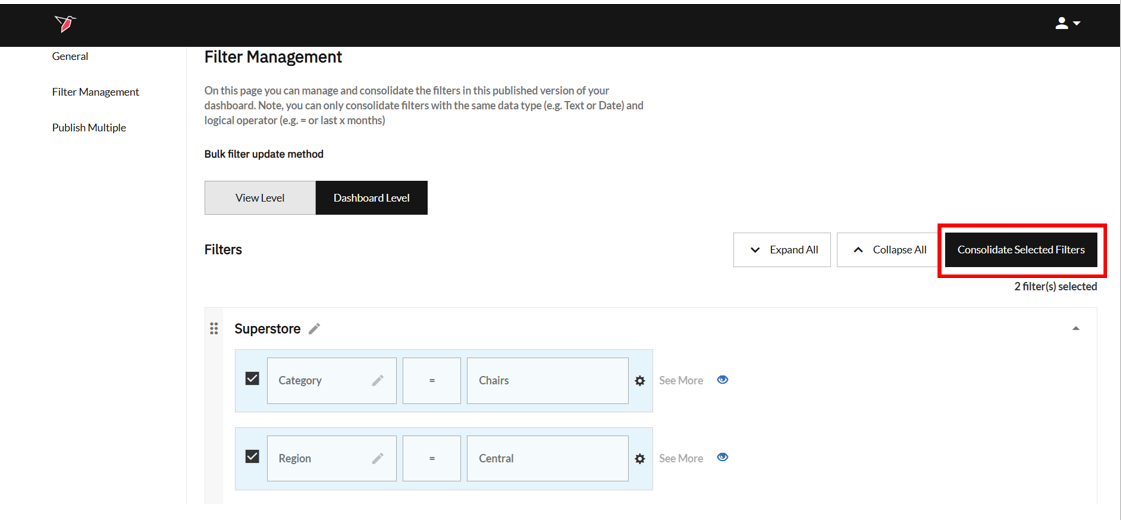
- The consolidated filters will appear in a Consolidated Filters section (which can be renamed if needed). Here you can rename them accordingly or delete them if no longer required, by clicking the delete icon.
Note:You can only consolidate filters of the same data type e.g. Text or Binary, and with the same operator e.g. > or <. Furthermore, date filters must all be set to the same date if you wish to consolidate them.
You can only use each filter once in a consolidated filter.
- Click the Select Values drop-down and ensure the selected values for your filters are correct.
- If you need to publish multiple versions of your dashboard based on a filter that you have in your dashboard, you can use the Publish Multiple
Note:This functionality only works for one dataset, so make sure your data is streamlined upstream before publishing multiple dashboards.
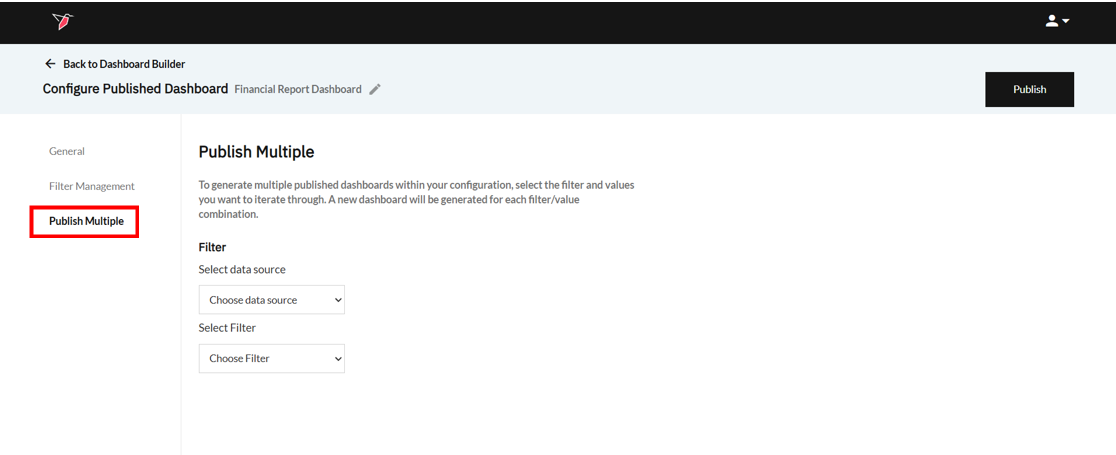
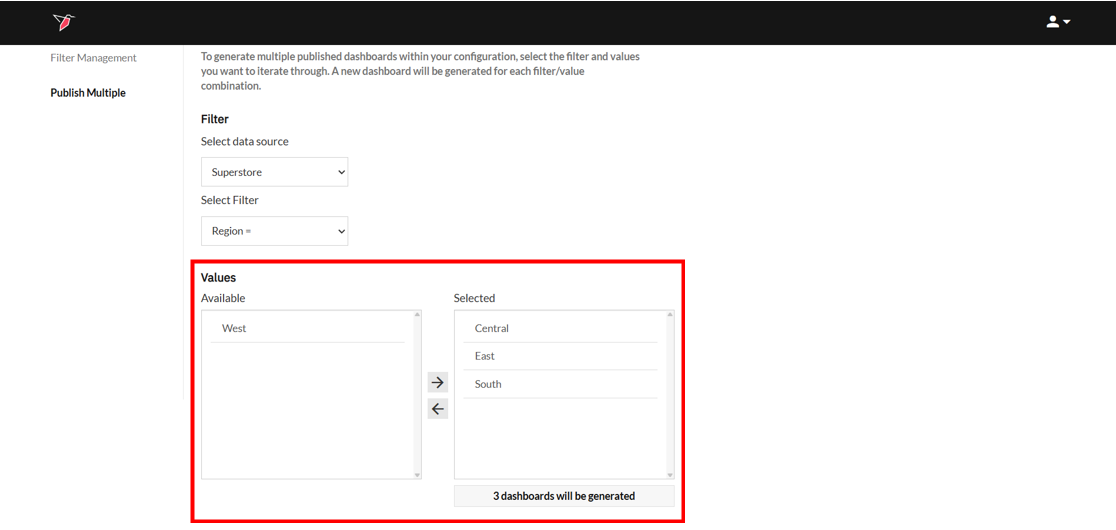
- Select your dataset and the filter you want to iterate through. Using the left to right picker, select which of the values you want to iterate through and create distinct dashboards for.
- Click Publish to publish your dashboard. Your published dashboard node will appear on the canvas connected to the original dashboard builder node.
Updating the Settings of Your Published Dashboard
You can also update the settings of a published dashboard using the node. To do so:
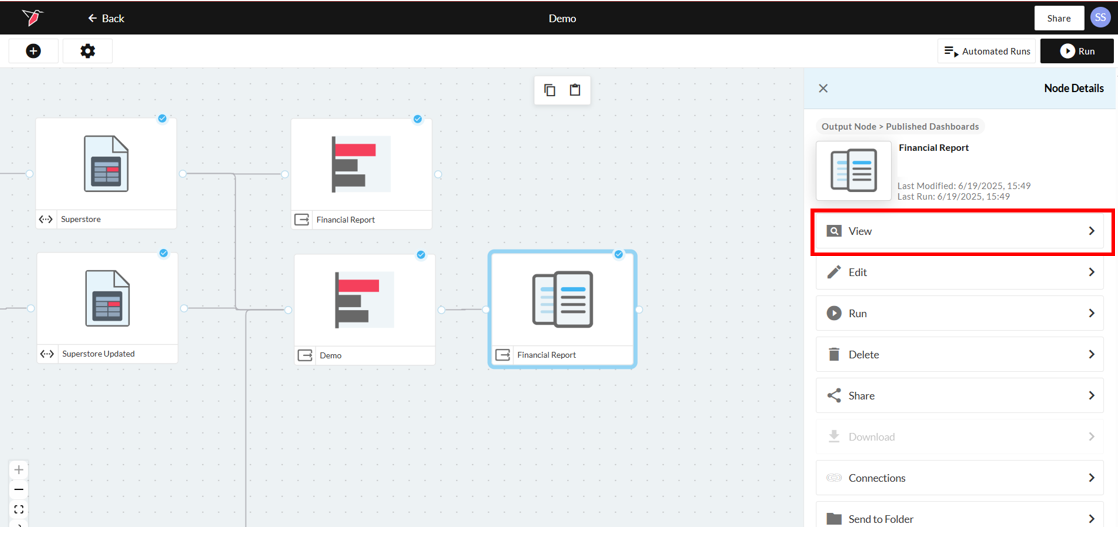
- Click the published dashboard node and the right side panel will open. Select View.
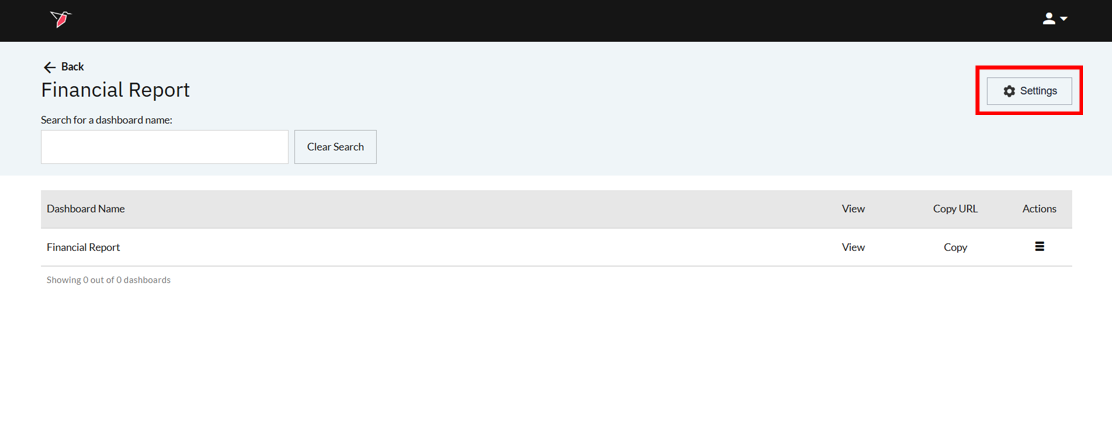
- Click Settings and a modal will pop up where you can make the necessary changes.
- Configure your dashboard to meet your requirements.
- Click Done once you have configured your published dashboard’s settings.
Note - Clicking Edit in the right-side panel will take you through the full publish dashboard workflow again, for example if you wanted to incorporate any newly added filters and republish the dashboard.
Accessing a Published Dashboard
Once you have published your dashboard(s), access them or their URLs:
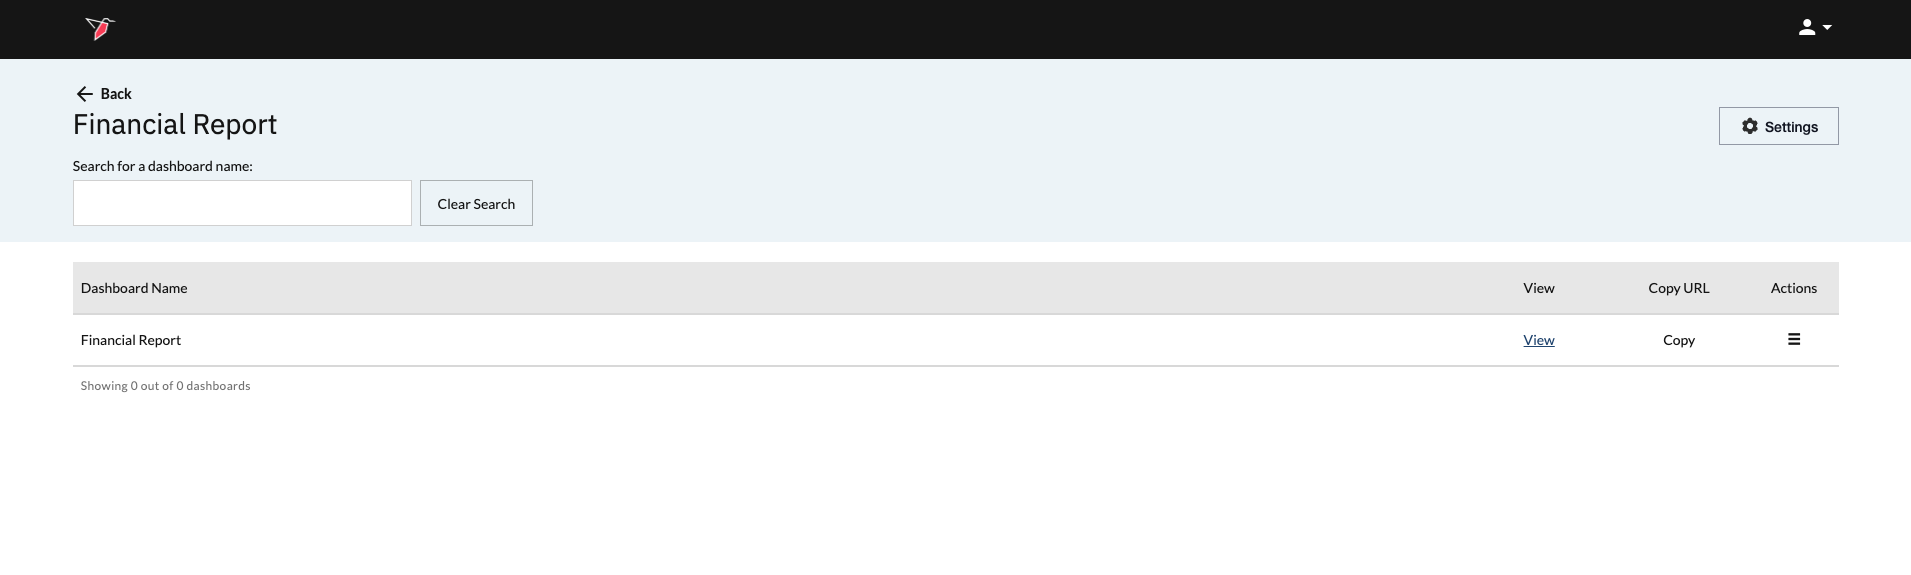
- Click the published dashboard node, then click View from the right side panel.
-
From this page, clicking View will take you directly to the dashboard. You can also copy the dashboard URL by clicking Copy under Copy URL.
-
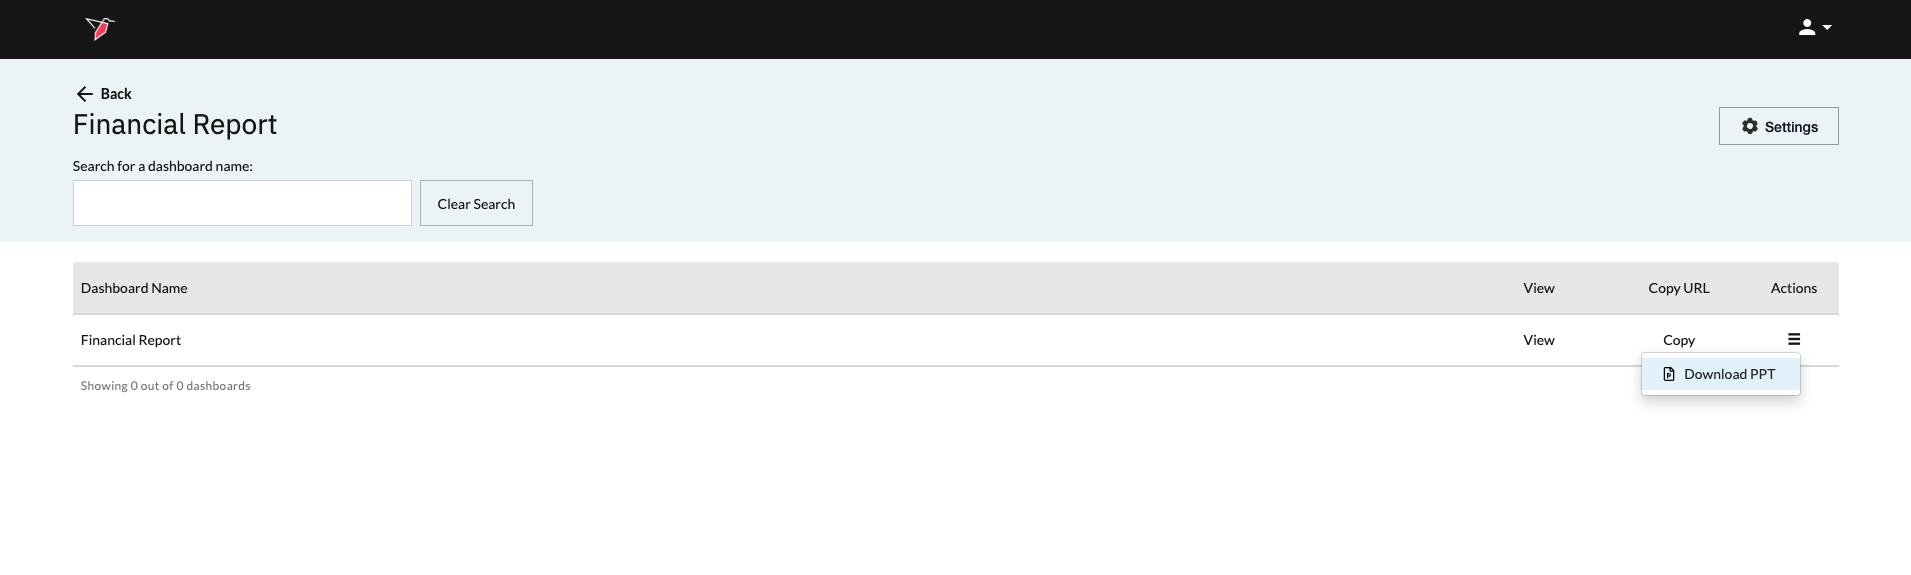
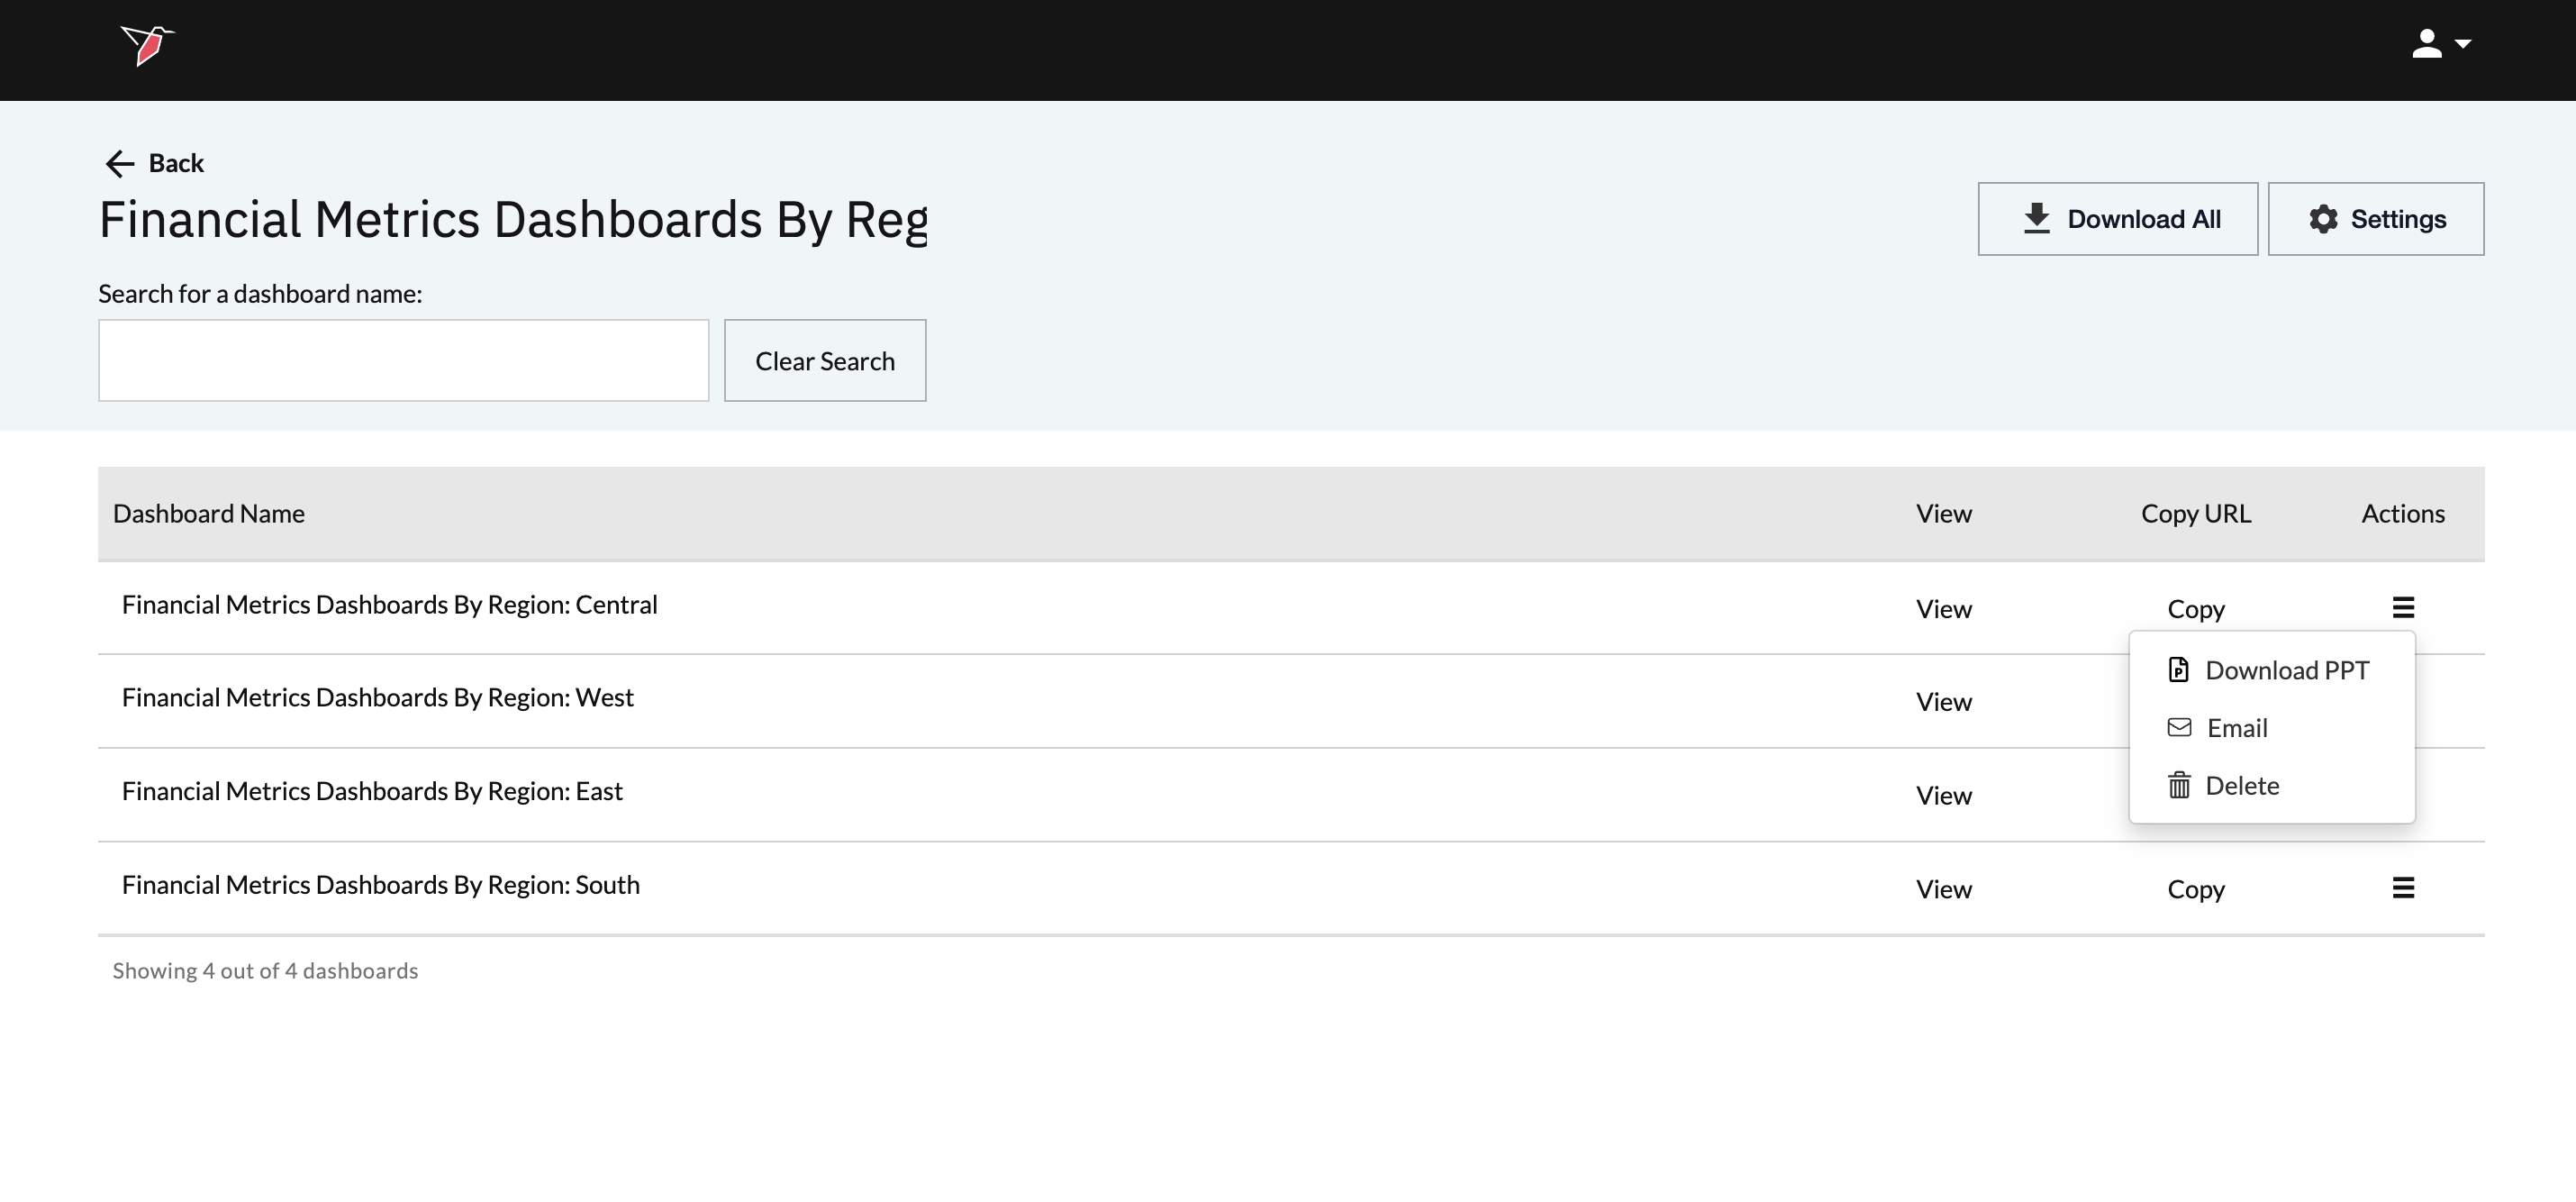
Clicking the Actions menu icon gives you the option to export that published dashboard to PowerPoint.
- In the case of a single published dashboard, you will only have the option to download the PowerPoint (PPT).
ii. In the case where the dashboard is part of a series published using Publish Multiple, you will also have the option to delete the dashboard or email it to users.
Sharing Your Published Dashboard
If you’d like to share a Published Dashboard with other users, you have a few options. You can share the dashboard URL directly (as described in the section above), which will be accessible to anyone with the link and does not require a login. Alternatively, you can share the entire canvas with other Redbird users—note that this requires them to log in and will grant access to the full canvas. See here for more information on how to share workflow objects with other users.
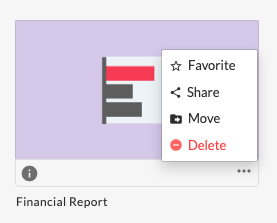
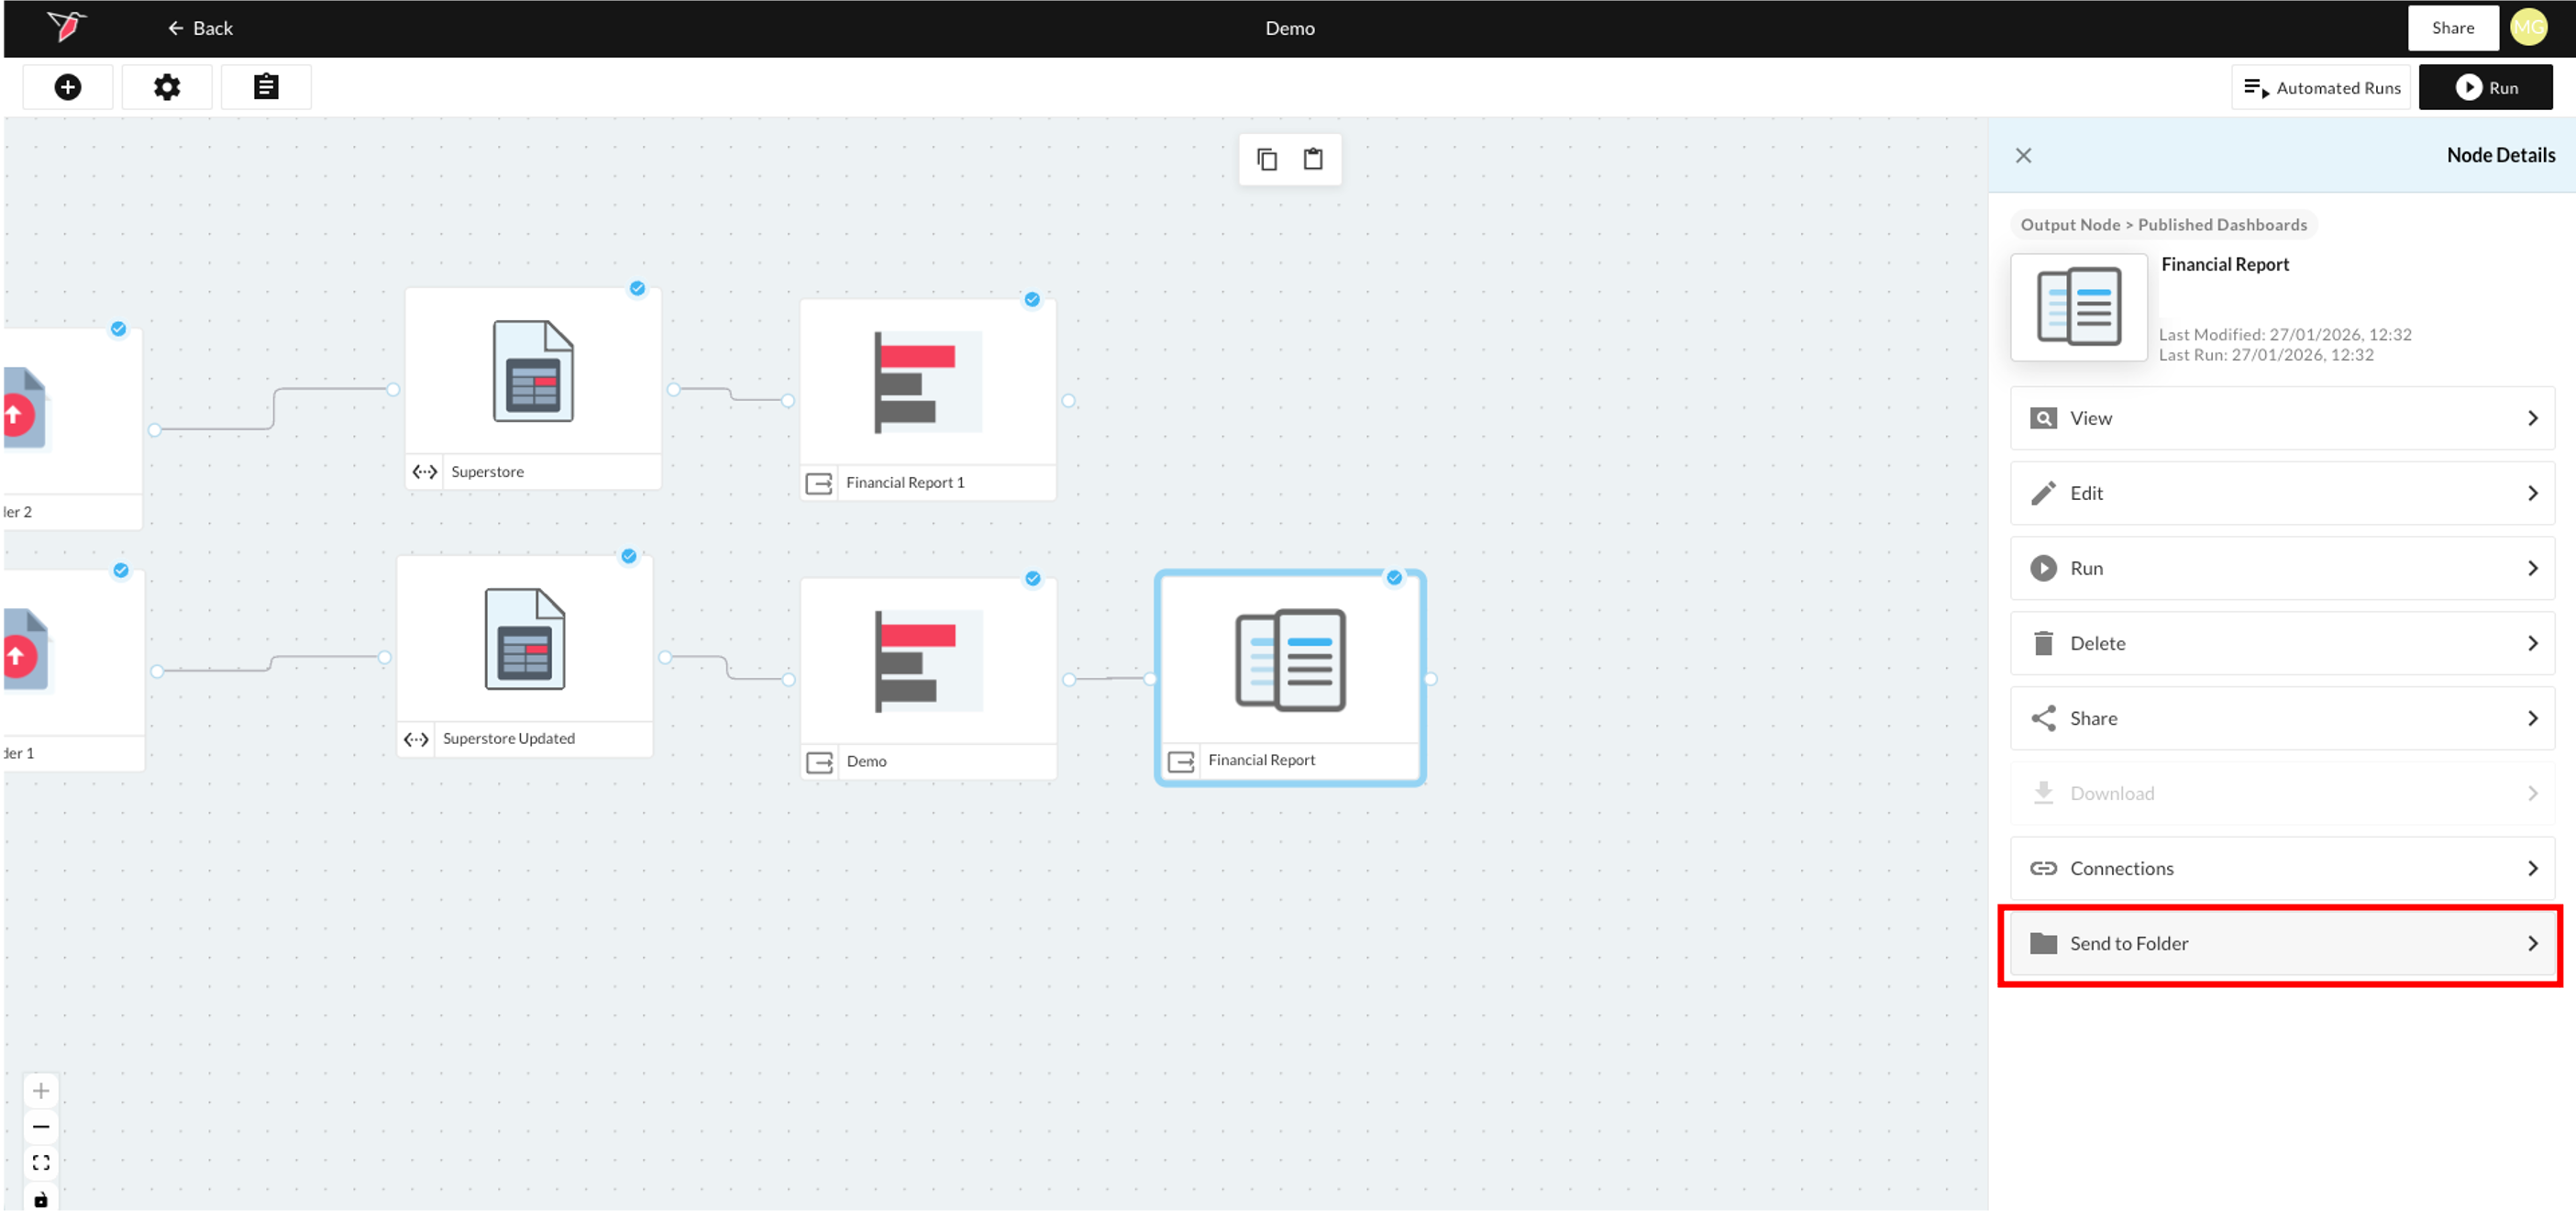
If you only want to share the Published Dashboard node itself—so users can view the dashboard but not see or edit the underlying canvas—you can send the published dashboard to a Folder and share that folder instead.
To do this, click the Published Dashboard node to select it. In the right-side panel click Send to Folder. This will move the Published Dashboard node to the parent folder of the workflow as an easy-access published object.
From there, navigate to the parent folder to view the published object. You can share the published object with the users you want to have access by clicking on the Share option within the object’s context menu. You can select users to share with in the right side panel that appears.