Navigating the Dashboard Workspace
Overview
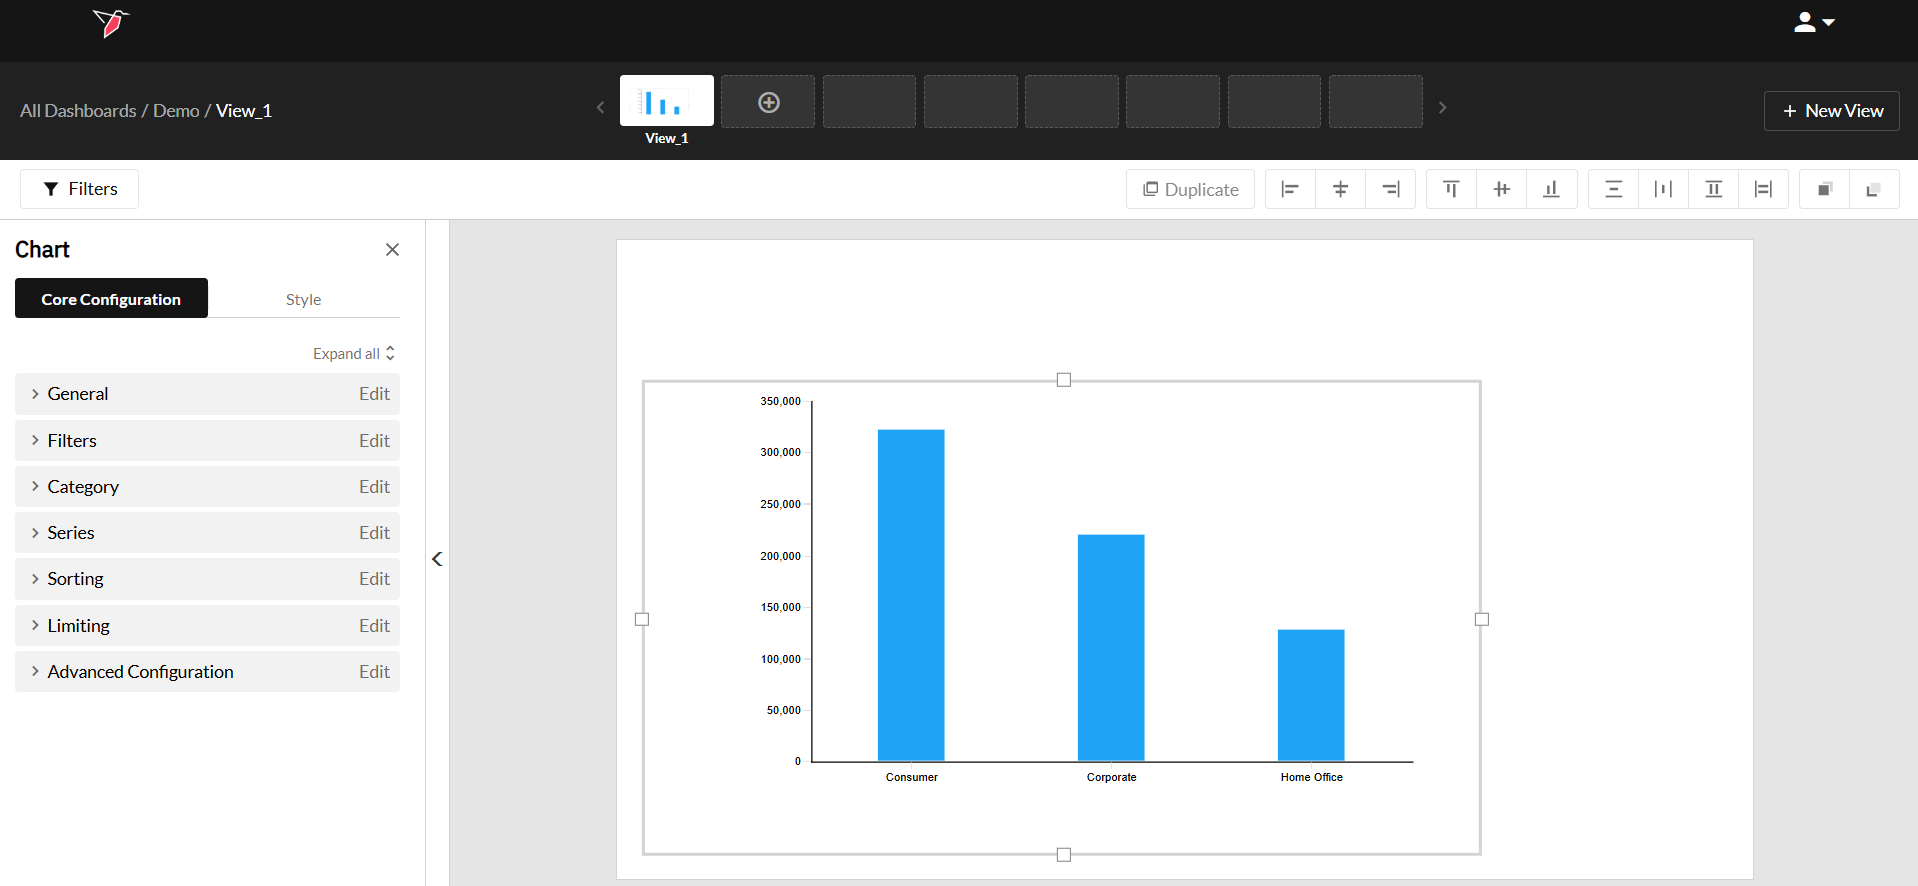
Dashboards on Redbird allow you to create high-fidelity, flexible reporting outputs that you can design using the dashboard builder. The Workspace is the canvas where you will add dashboard objects like charts, tables, textboxes, images, etc., to build out your data-driven and interactive dashboards on Redbird. The image below shows the layout of the workspace.
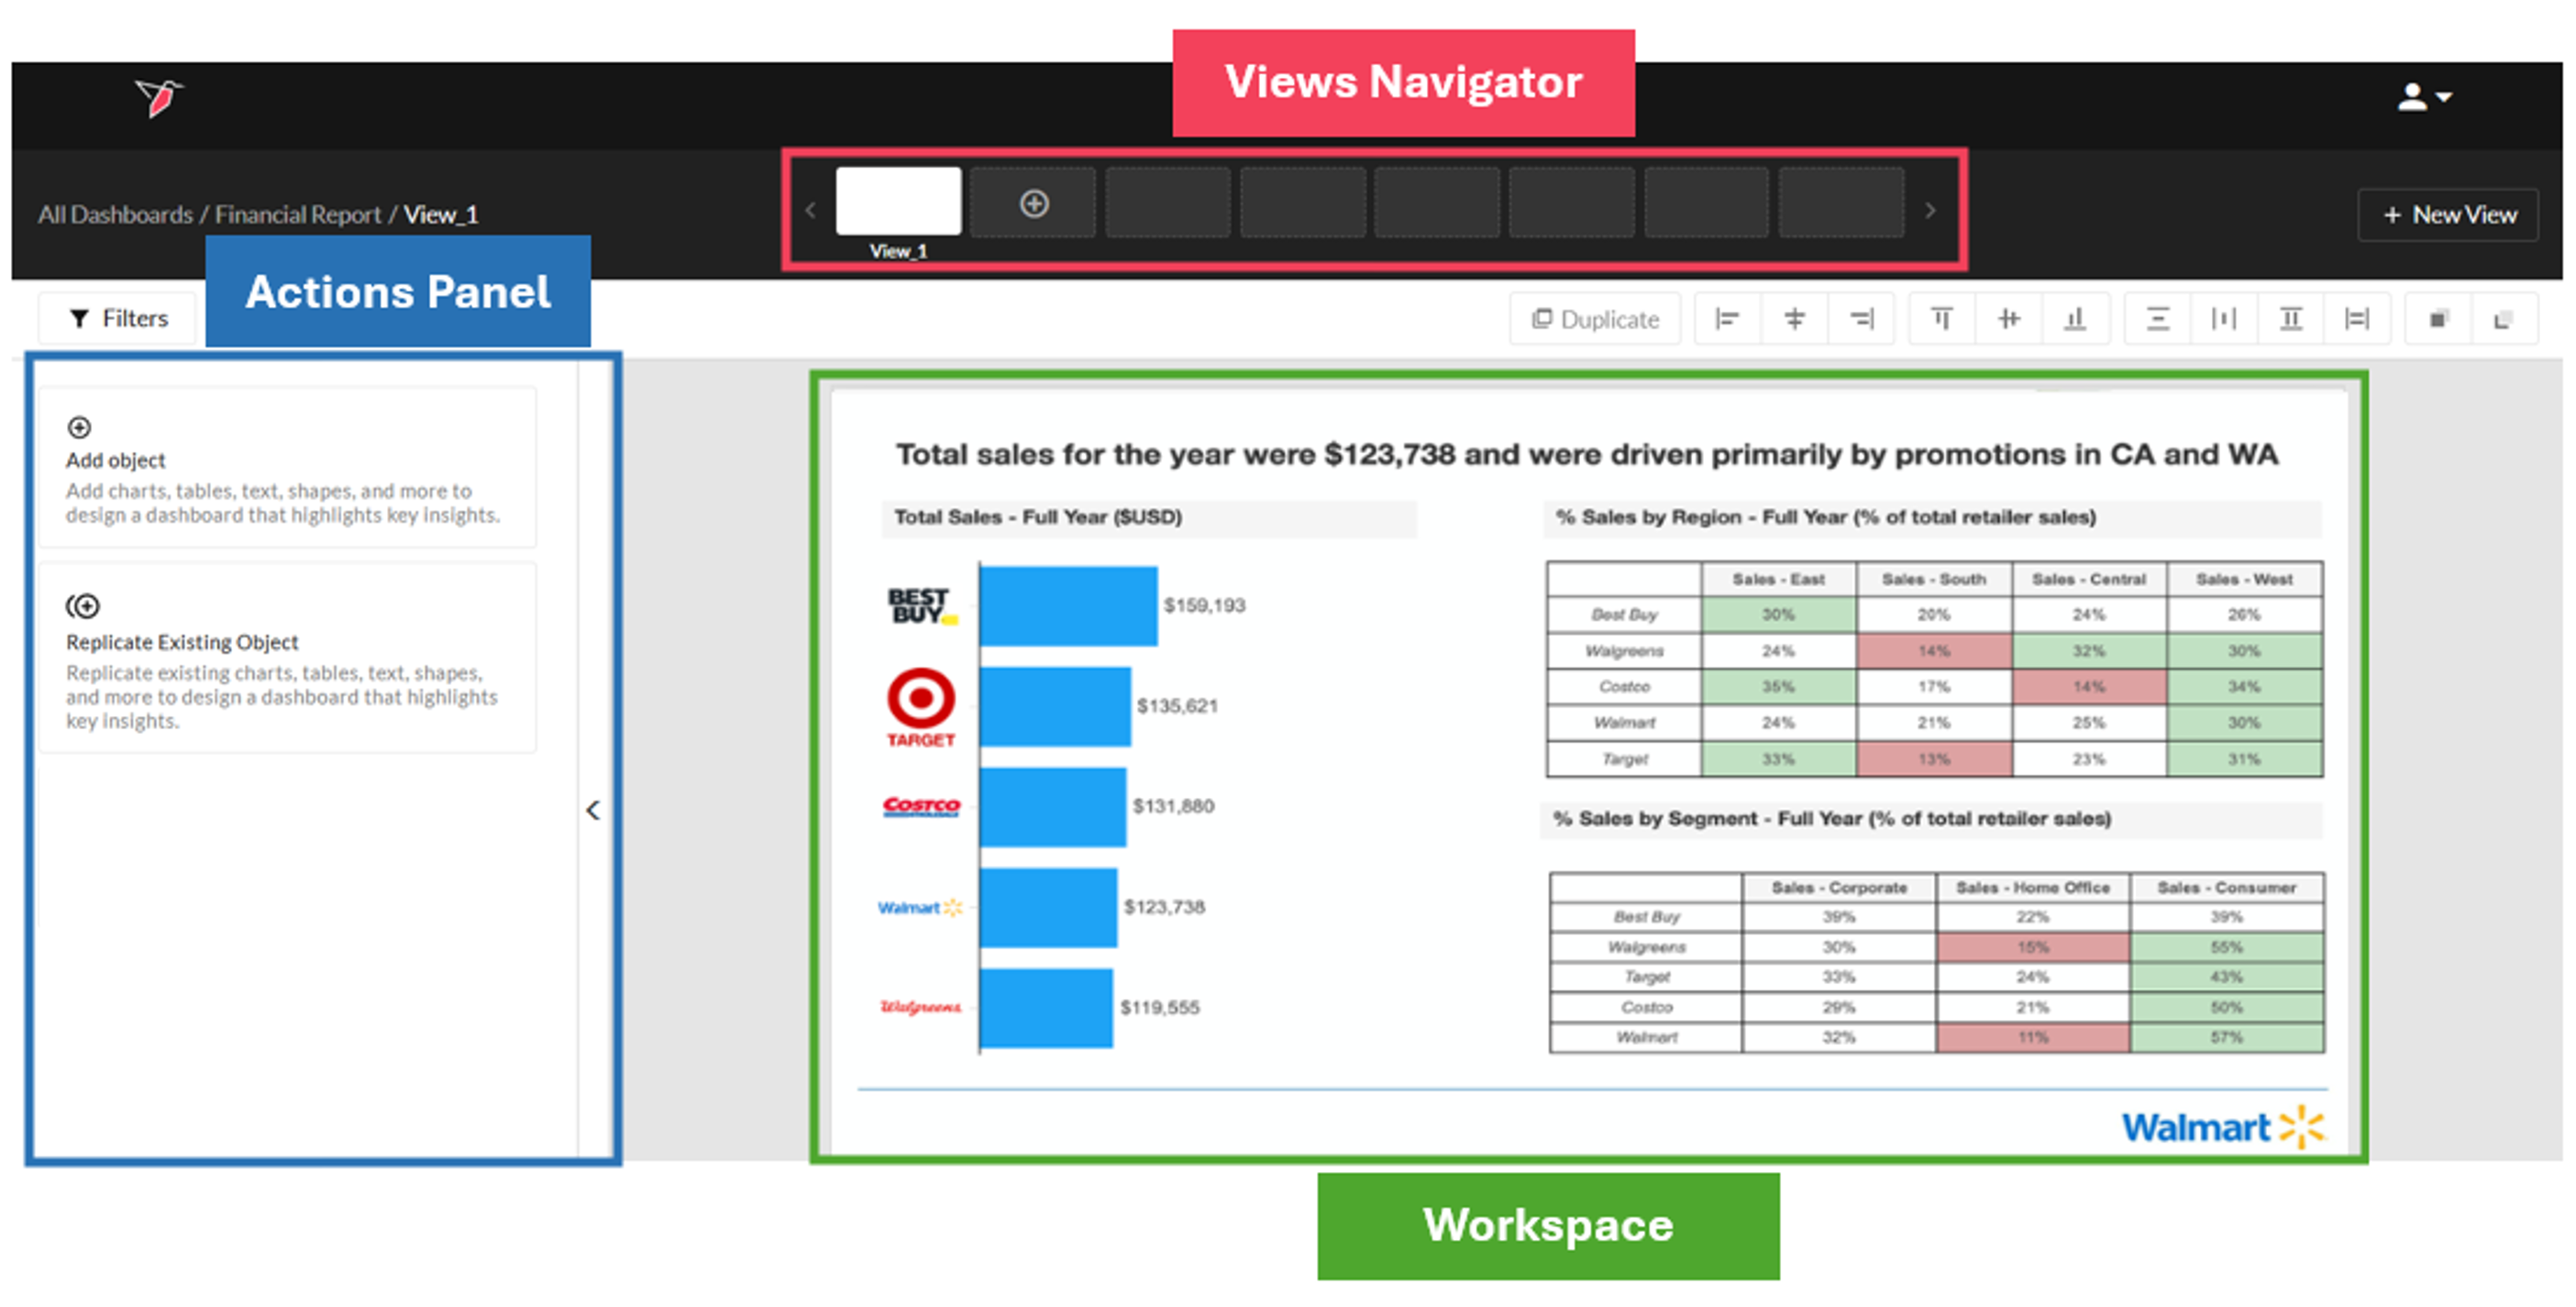
The workspace has three sections:
- Views Navigator: A dashboard in Redbird can have more than one view. The views navigator at the top of the page allows you to seamlessly switch between views.
- Actions Panel: The Actions Panel allows you to add, format, arrange, style, and filter dashboard objects. The Actions Panel has two options:
- Add object: Selecting this option brings you to a submenu where you will choose the object you want to add to the canvas.
- Replicate Existing Object: Users can copy objects that they've already configured on a different view by choosing this option.
- Workspace: The workspace is the primary working area of the dashboard. This is the canvas where you can add objects and format them based on your desired look and feel. The workspace appears blank by default unless you selected a default layout while creating the dashboard.
Dashboard Objects
Dashboard objects are user-configurable interactive elements that act as the building blocks of dashboards. You can use these objects to visualize your data or communicate insights. Some objects are data-driven, meaning they use the datasets loaded on Redbird, while others are aesthetic elements used to create a polished look and feel.
The list of dashboard objects supported by Redbird is as follows:
- Charts
- Tables
- Textboxes
- Images
- Word clouds
- Geographic Visualization
- Shapes
- Combo Chart
Adding a New Dashboard Object
To add a dashboard object to the workspace, complete the following steps:
- Within the view you are working on, click Add Object at the top of the Actions Panel. The submenu will show you the list of objects you can add to the workspace. If you haven’t created a dashboard or a view yet, read our guide on getting started with dashboards.
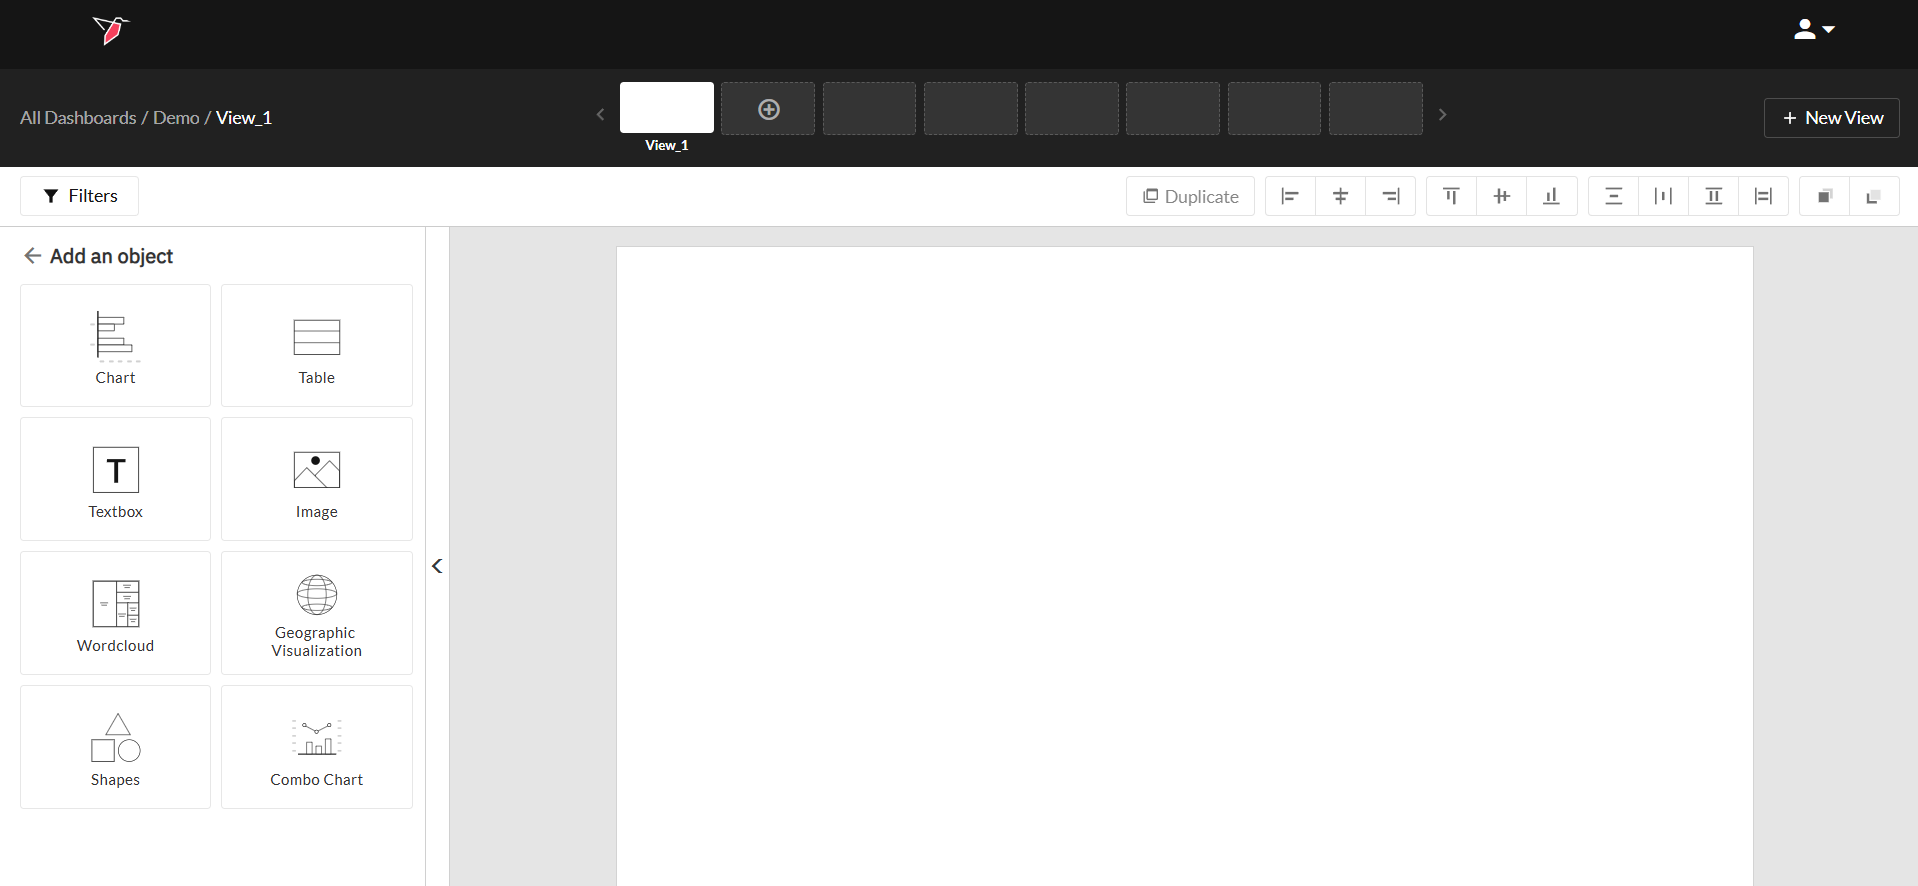
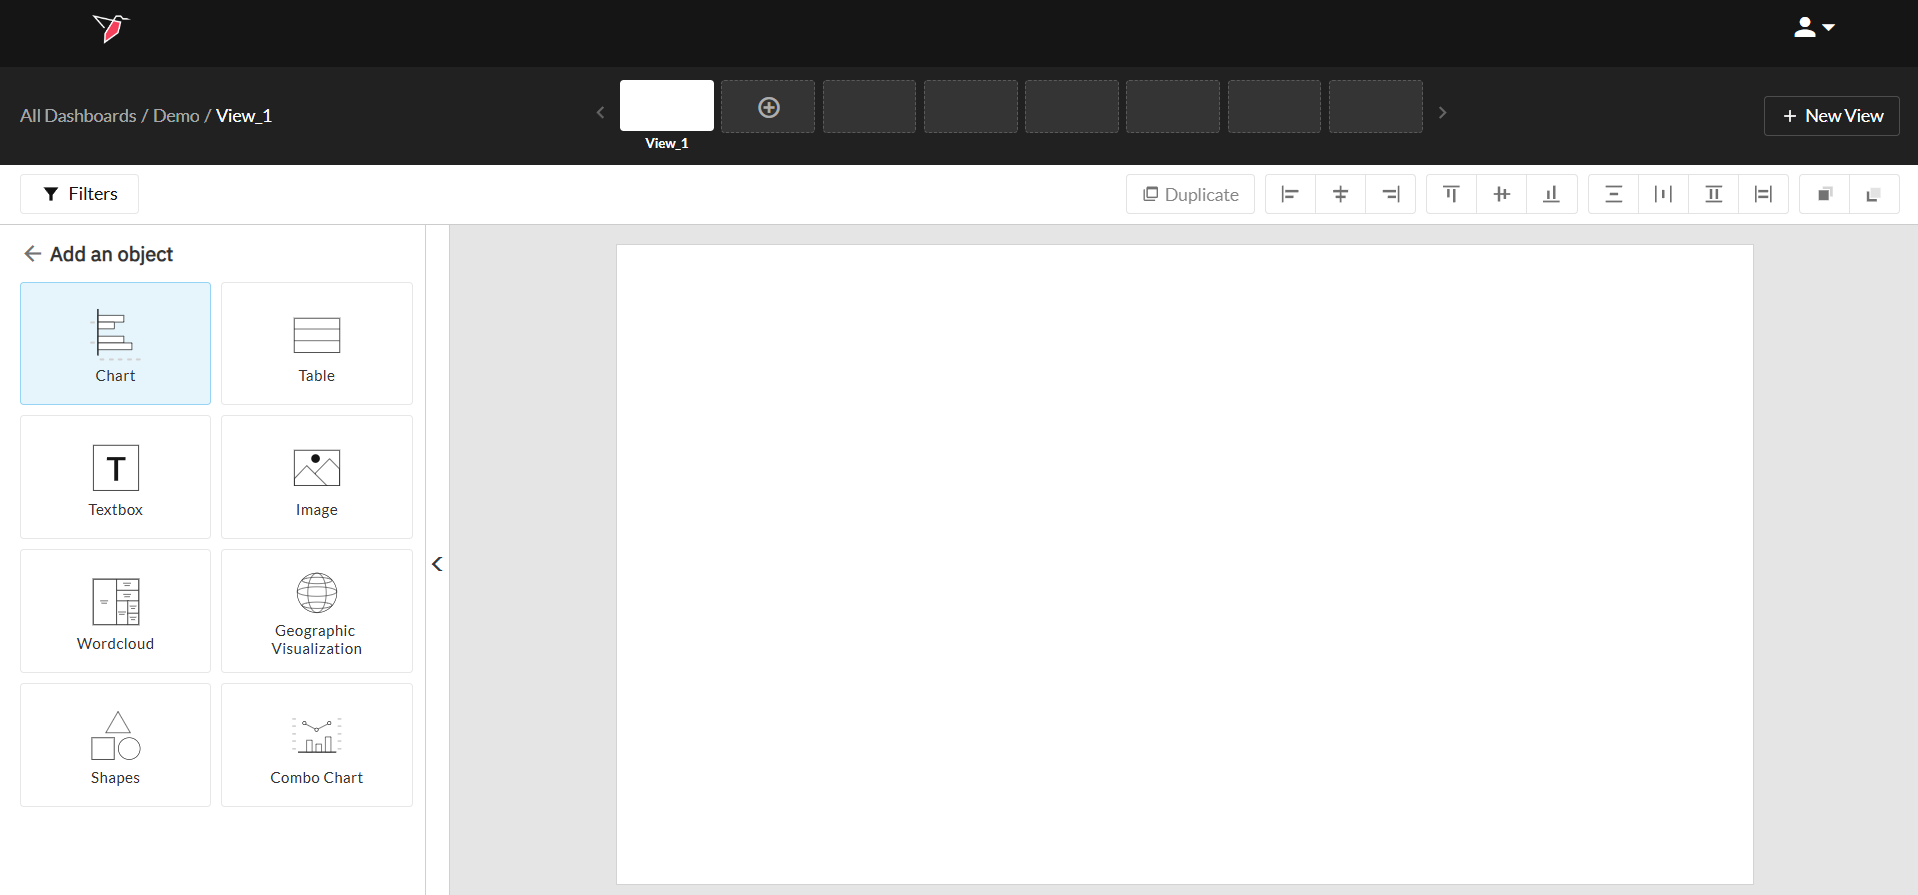
- Next, click on the object you want to add. For example, if you want to add a chart, click Chart.
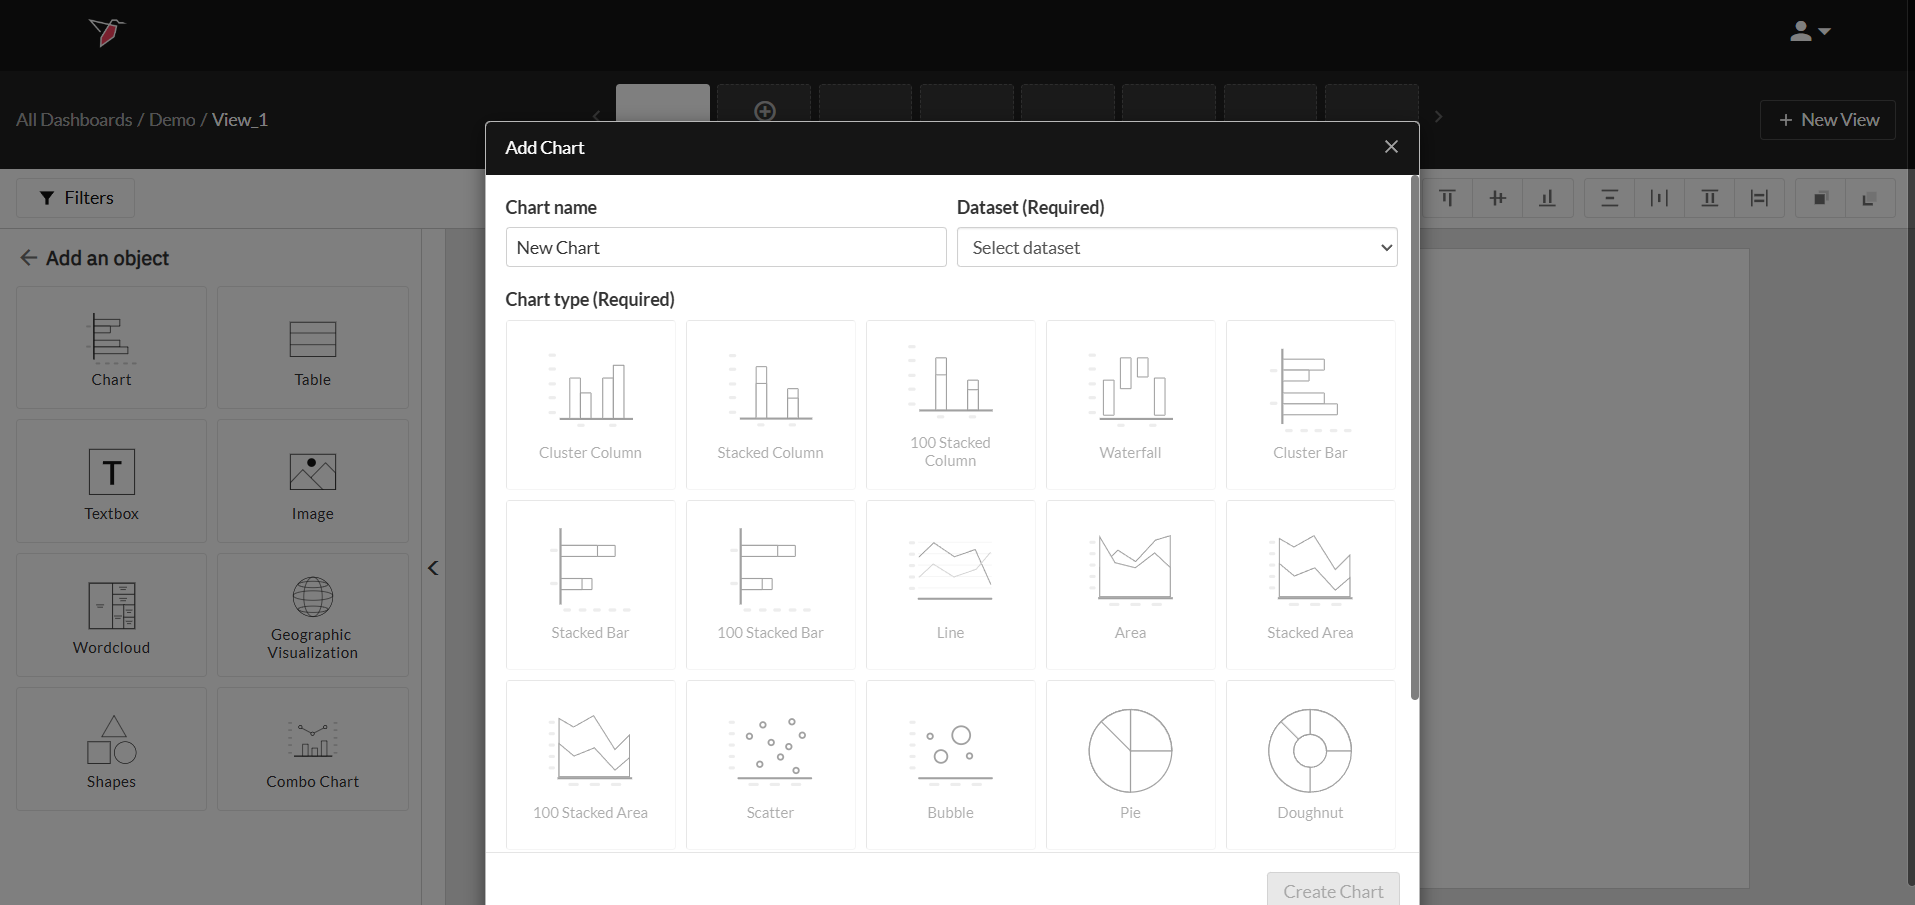
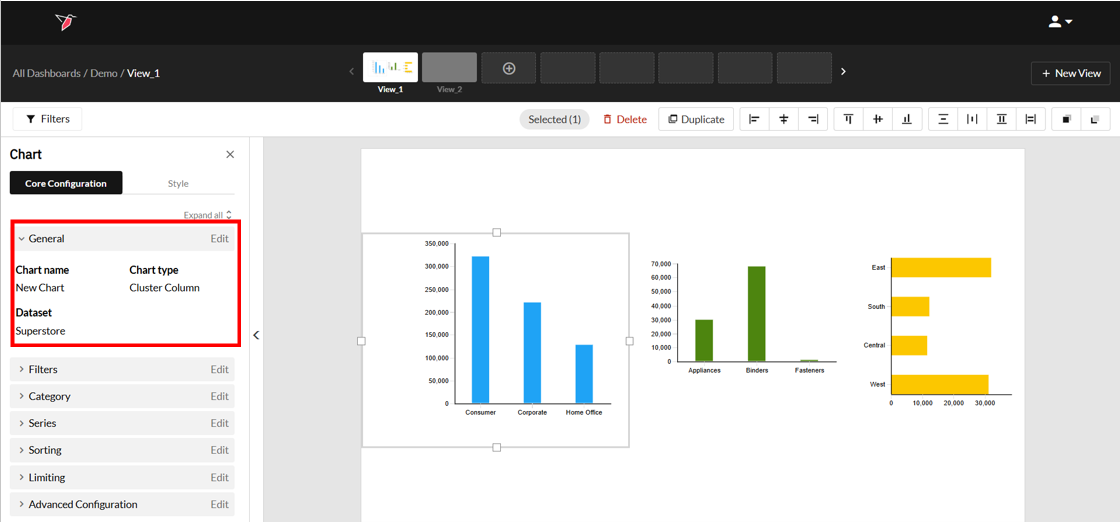
- A modal will appear allowing you to create a brand-new object that you can configure from scratch. Within the modal, you can name it and choose a dataset for your chart from the dropdown under Dataset. The dropdown lists all the datasets that are connected to the dashboard node.
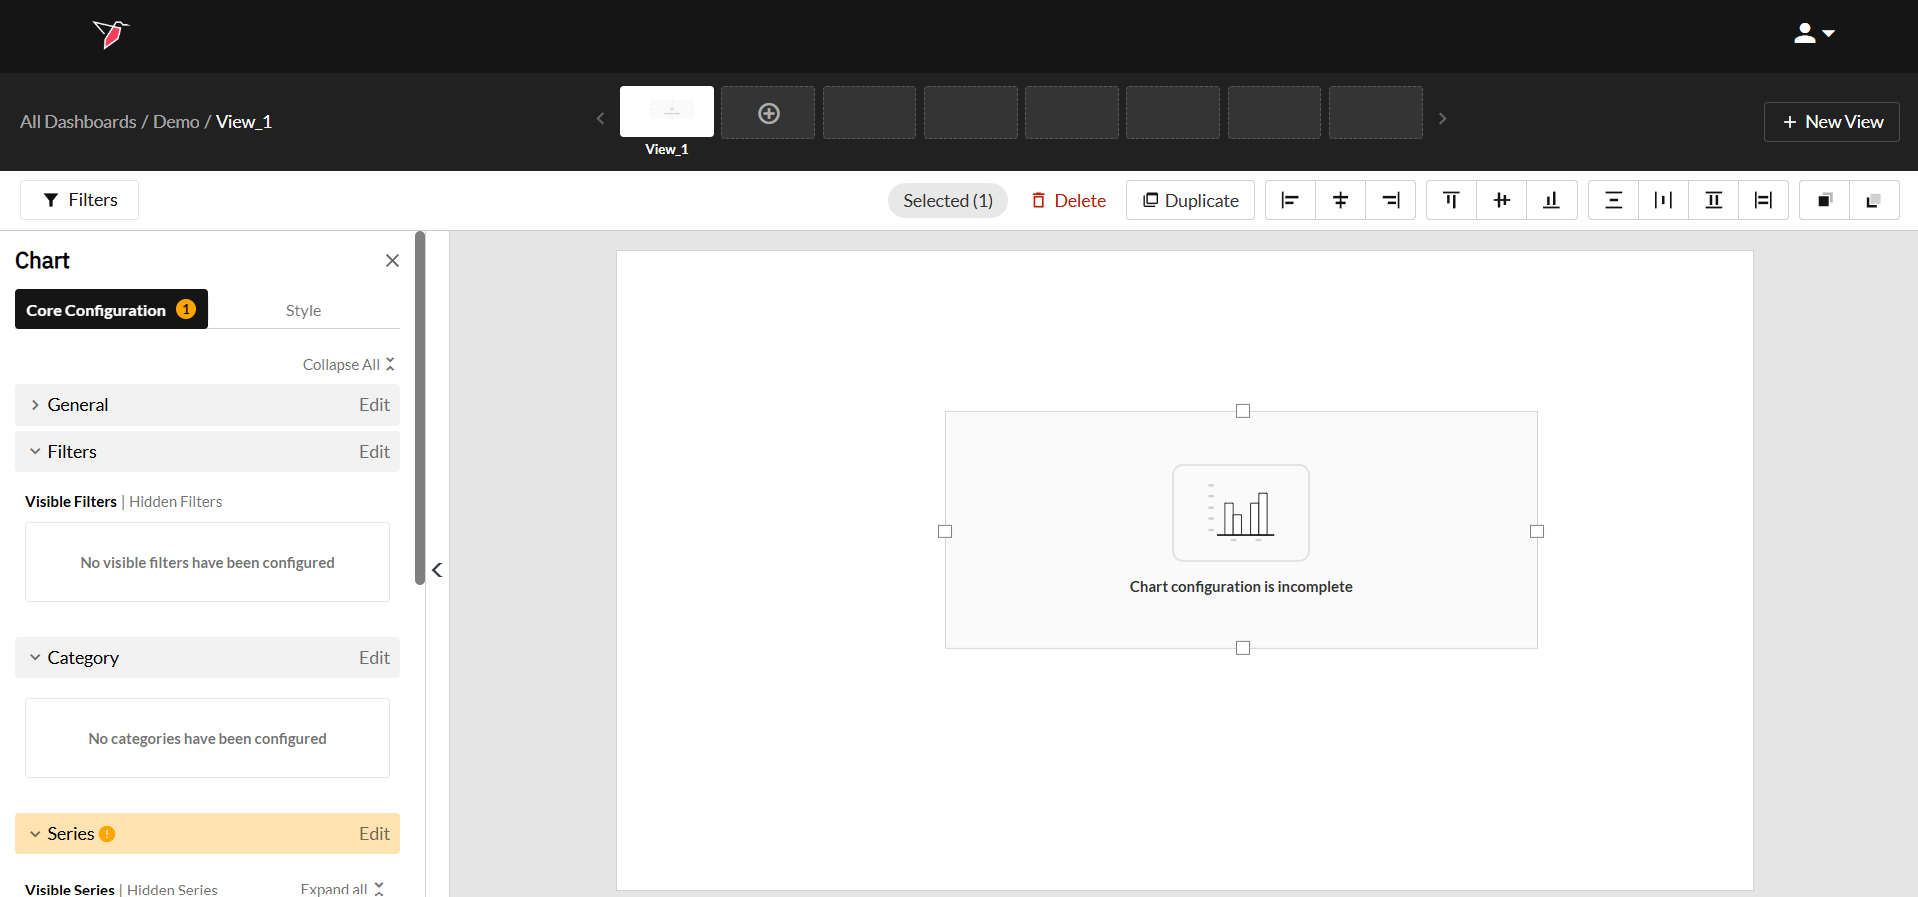
- Now, click on the object you would like to add from the list of objects, which will add the object to the workspace. Note that you still need to configure the chart using the panel on the left for it to render in the workspace.
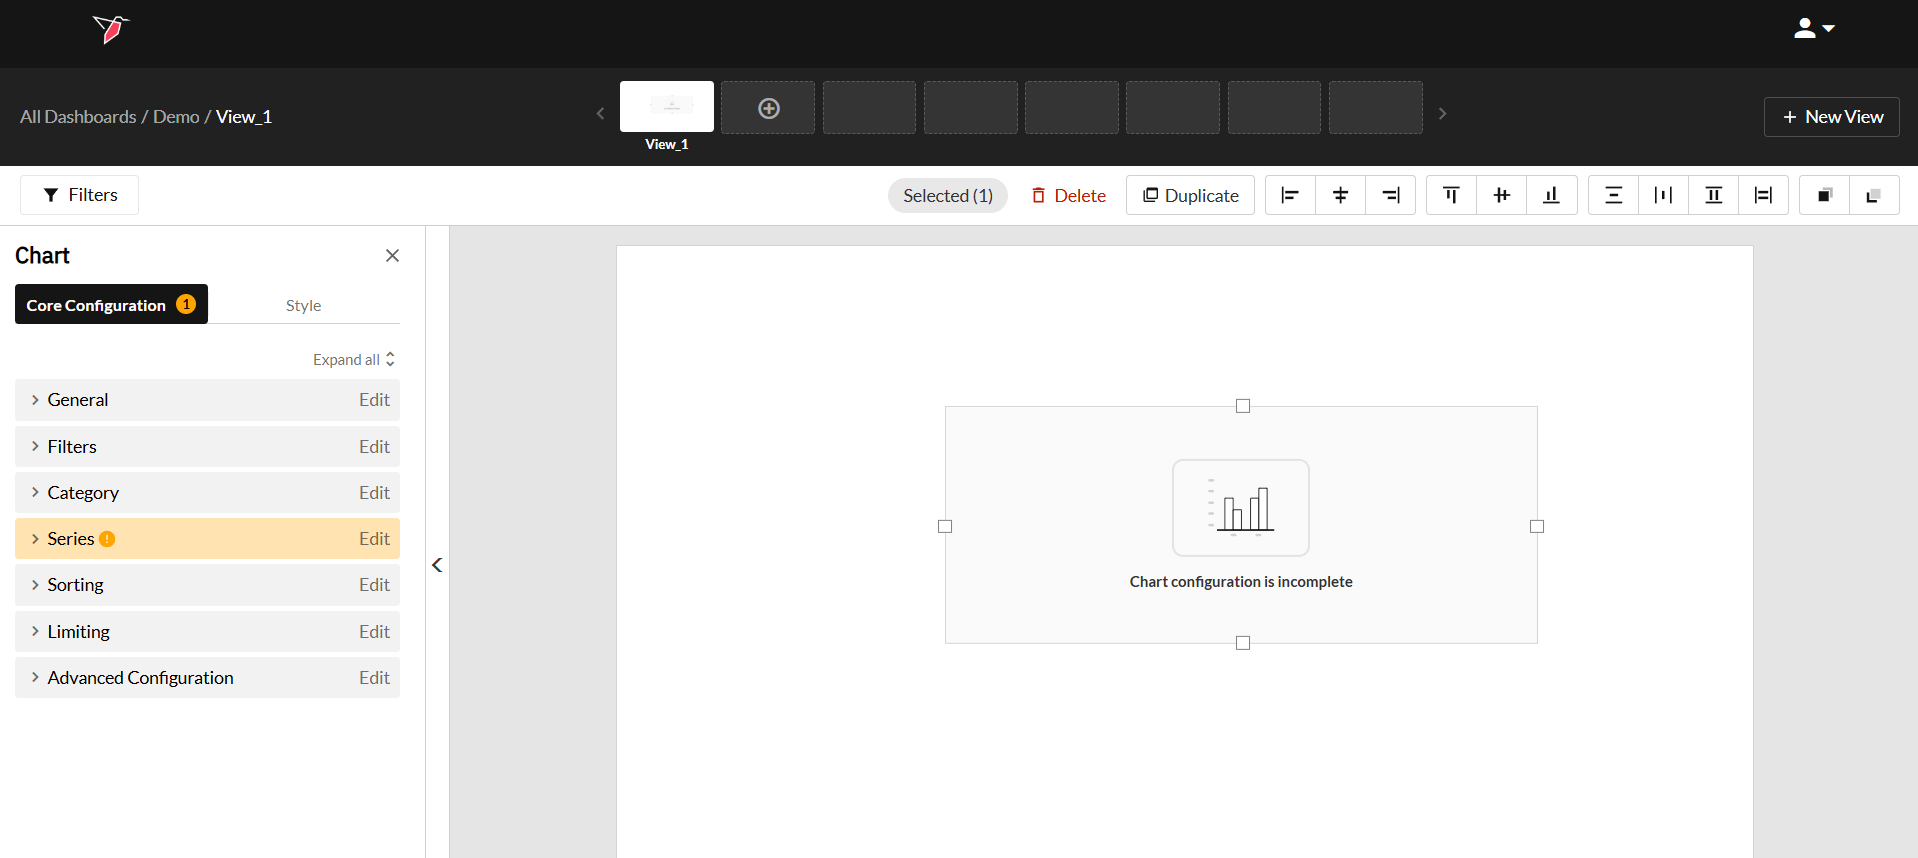
- Using the configuration panel to the left, add filters, set a category variable and add series by expanding the sub menus. For detailed instructions on configuring certain objects, use the remaining guides in this section.
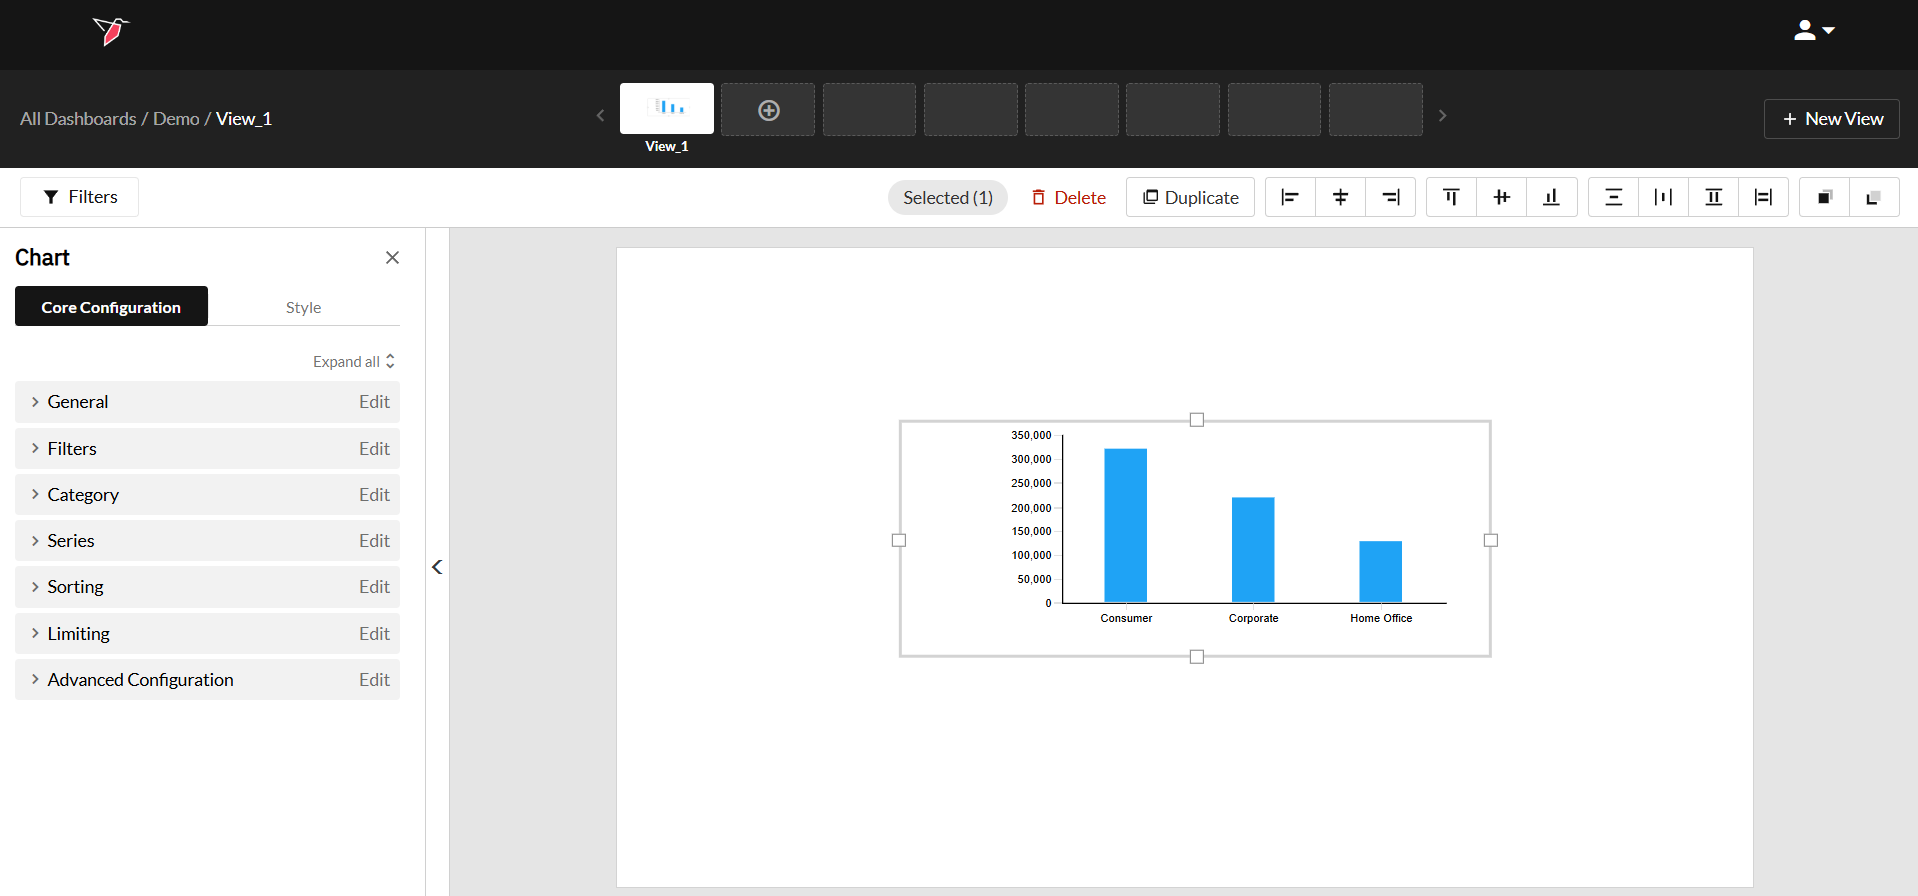
- After you finish configuring the object, it can be moved, resized or styled.
Interacting with Dashboard Objects
Once a dashboard object has been added to the workspace, you can interact with it in the following ways:
- Moving an object: You can move an object anywhere on the workspace by just clicking on the object and dragging it to the desired location.
- Resizing an object: You can resize an object by clicking on it and then dragging the handles located along the object’s perimeter.
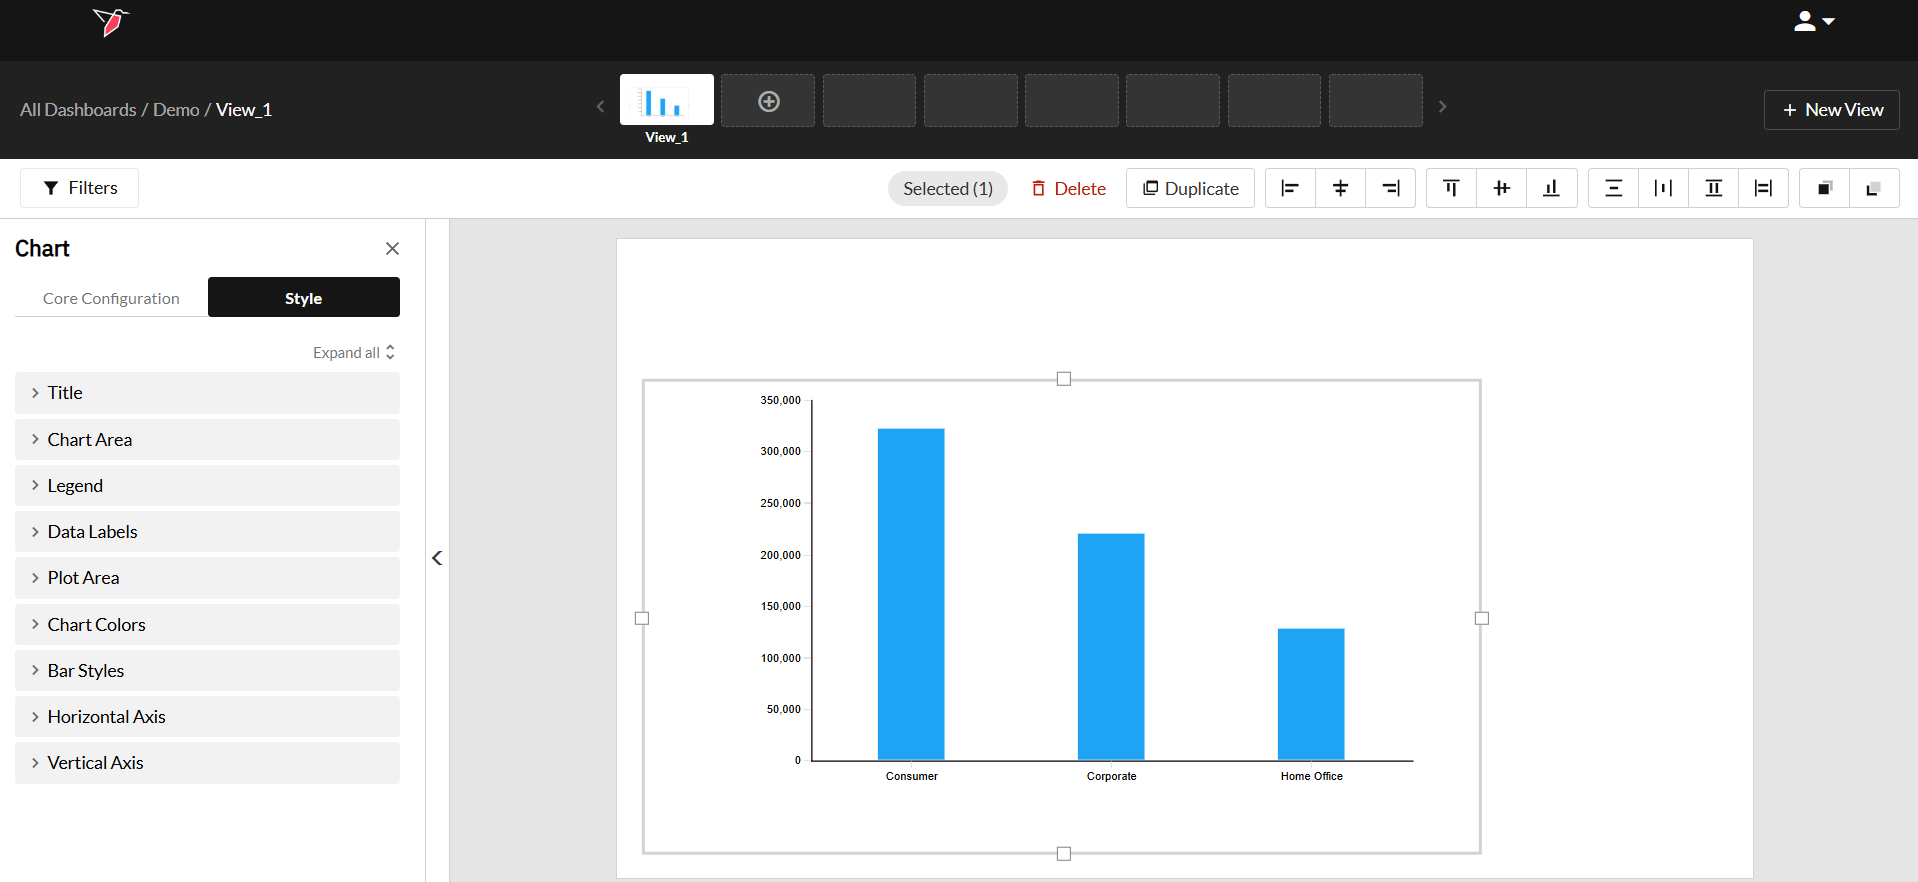
- Once you've finished the object's core configuration, you can update the styling by clicking Style in the Actions Panel.
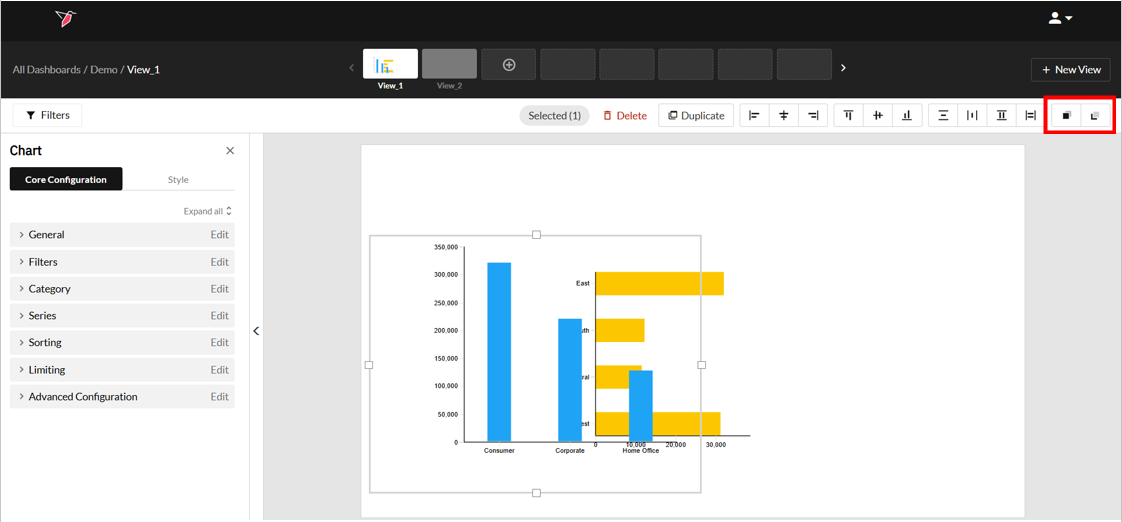
- Under the Views Navigator, there are options to delete, duplicate, align and arrange selected objects within the workspace. Note: you can also delete objects by selecting the Delete button on your keyboard.
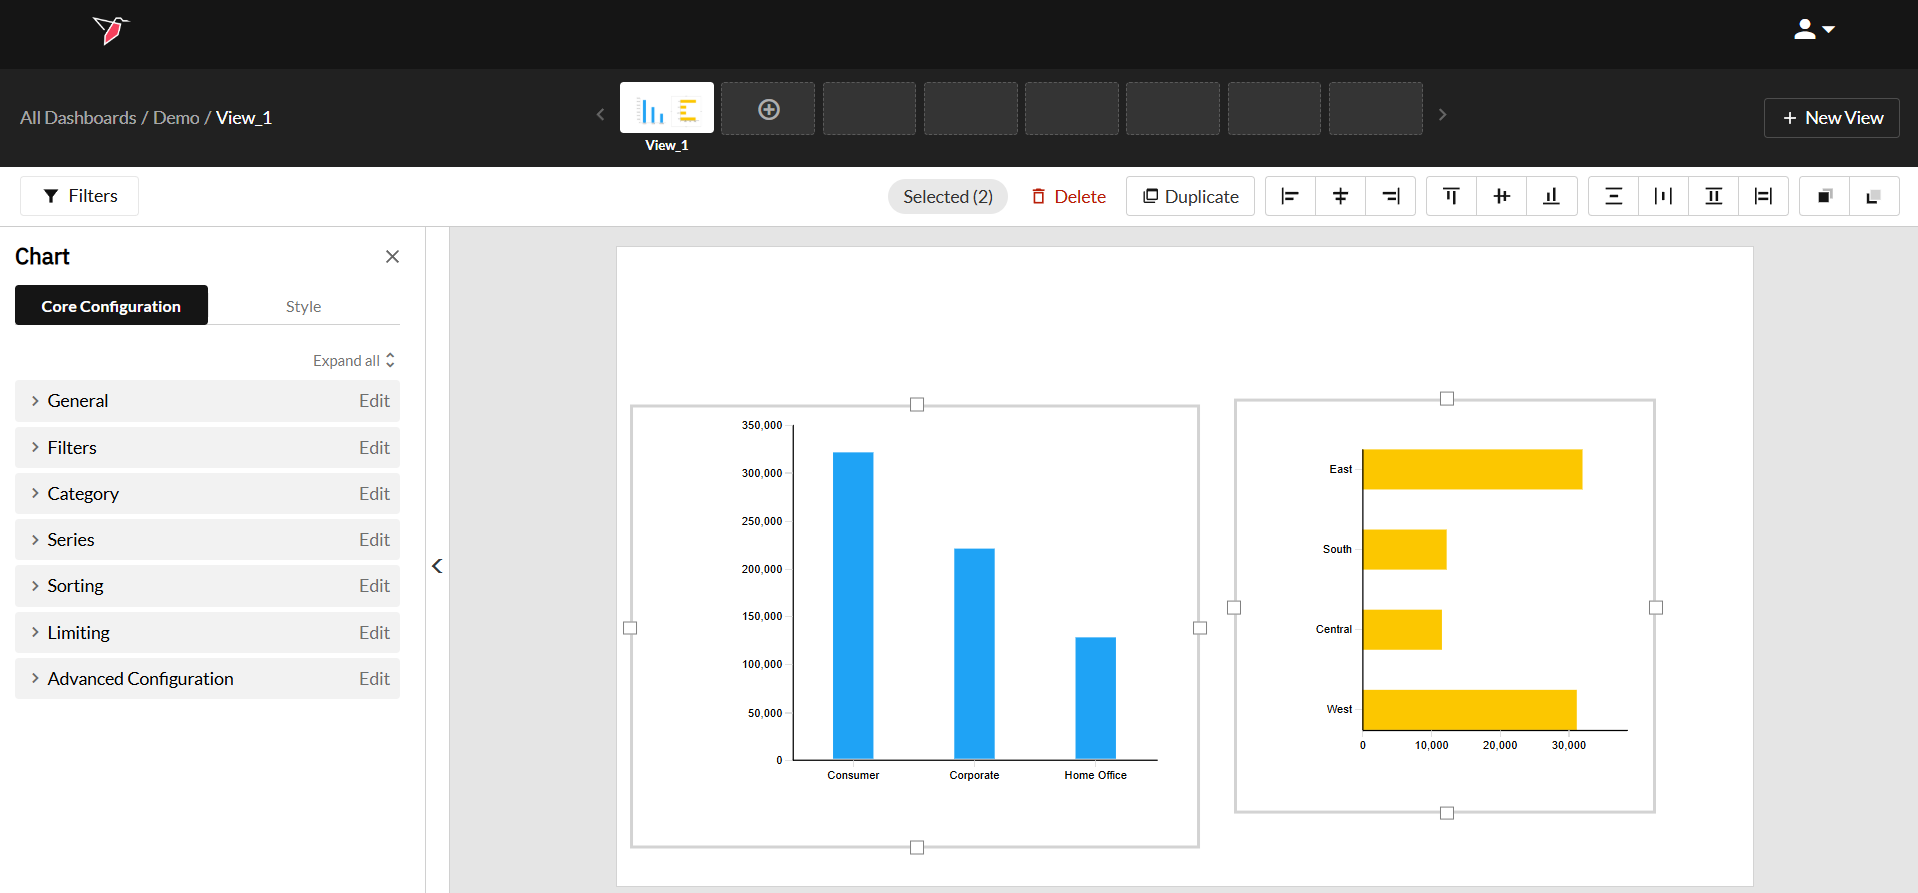
- Selecting multiple objects: You can select multiple objects at the same time to arrange them. Read the Arranging Dashboard Objects section of this article to learn to work with multiple objects at once. There are two ways of selecting multiple objects:
- Using Ctrl / Cmd + Click: Press and hold the Ctrl / Cmd key on your keyboard and click on the objects one by one.
- Using drag-to-select: Click and drag from anywhere on the workspace and make sure the selection area encompasses all the objects you want to select.
- Selecting multiple objects: You can select multiple objects at the same time to arrange them. Read the Arranging Dashboard Objects section of this article to learn to work with multiple objects at once. There are two ways of selecting multiple objects:
Creating Replicas of Objects
Say for instance you created a chart on the first view of the dashboard you’re working on and you would like to create a replica of that chart with the same look and feel on a different view. Once you’ve created a dashboard object on Redbird, you can easily create a replica of that object with just a few clicks without having to configure it all over again. There are two ways of creating replicas of dashboard objects within Redbird:
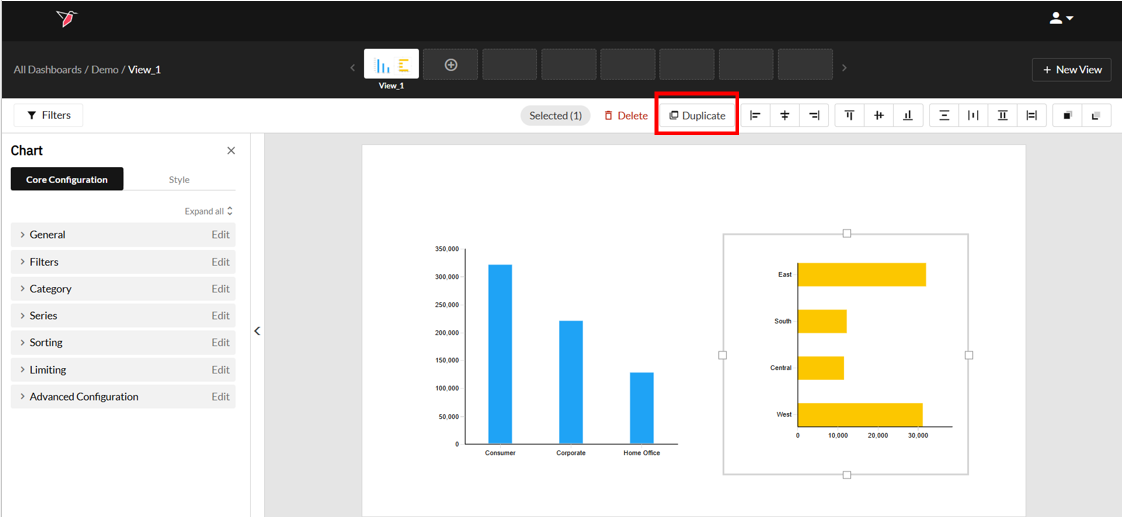
- Create a replica of an object on the same view: Select the object and click Duplicate
- Create a replica using the Actions Panel: You can use the Actions Panel to create a replica of objects on different views of the same or different dashboards within Redbird. Do the following steps to create a replica:
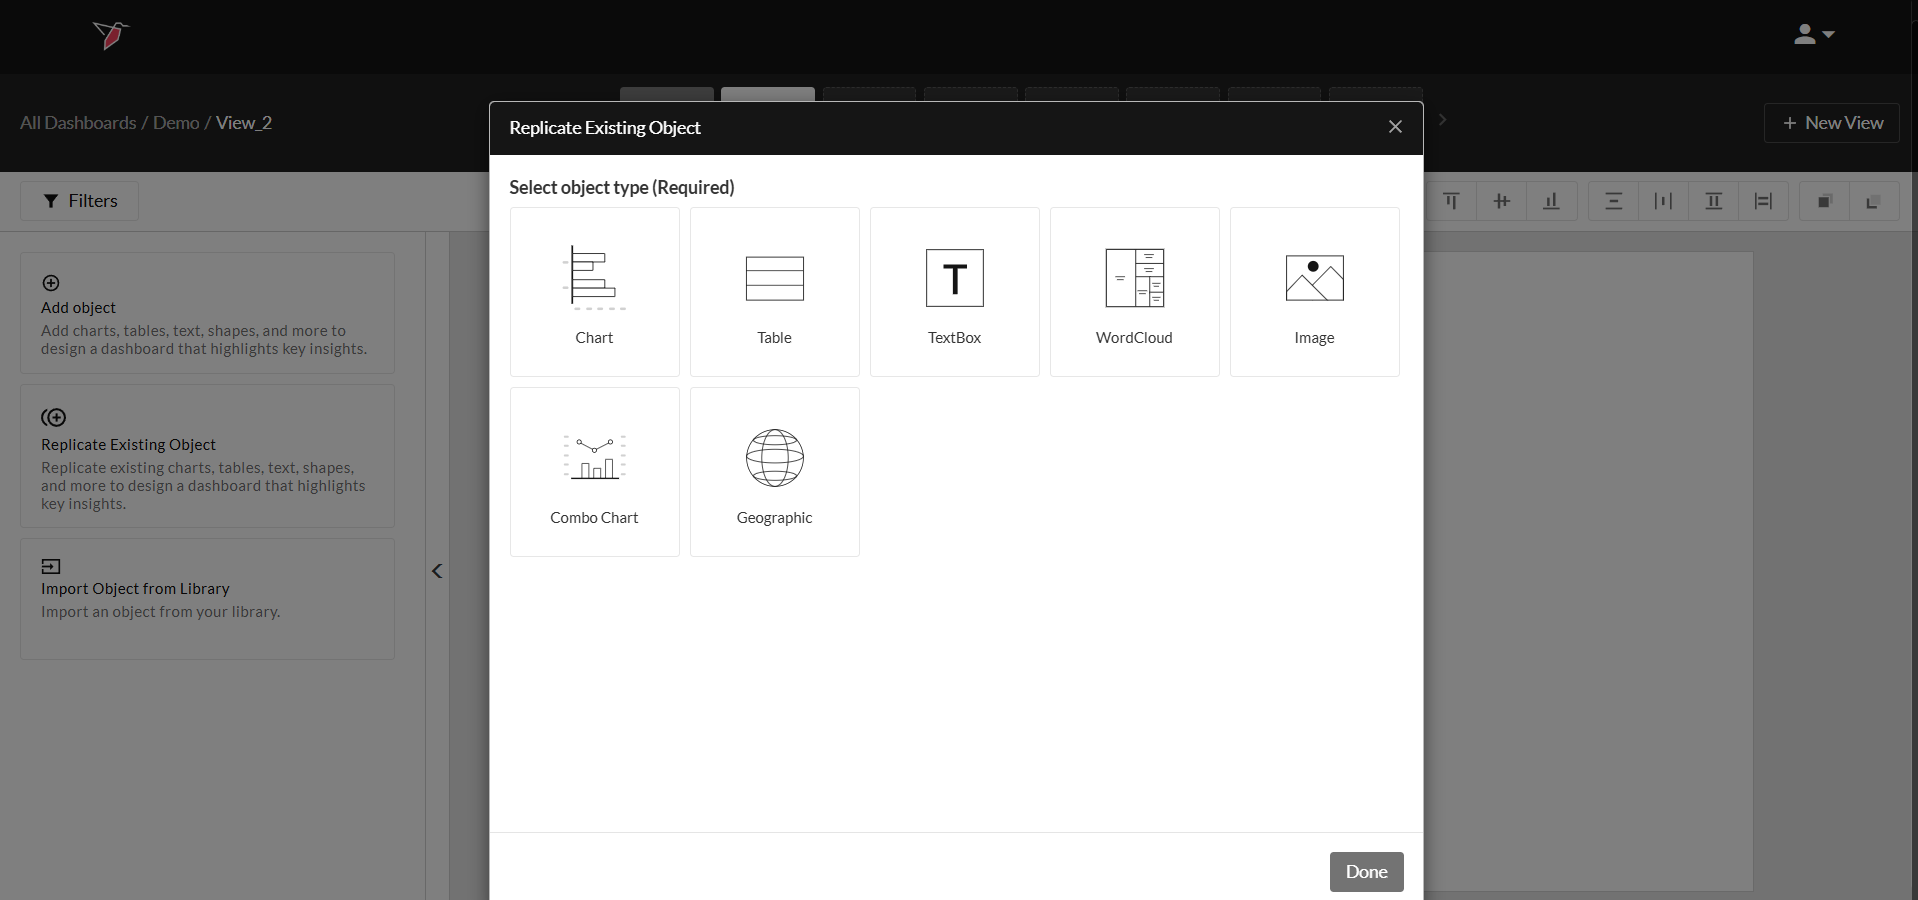
- Click Replicate Existing Object from the Actions Panel.
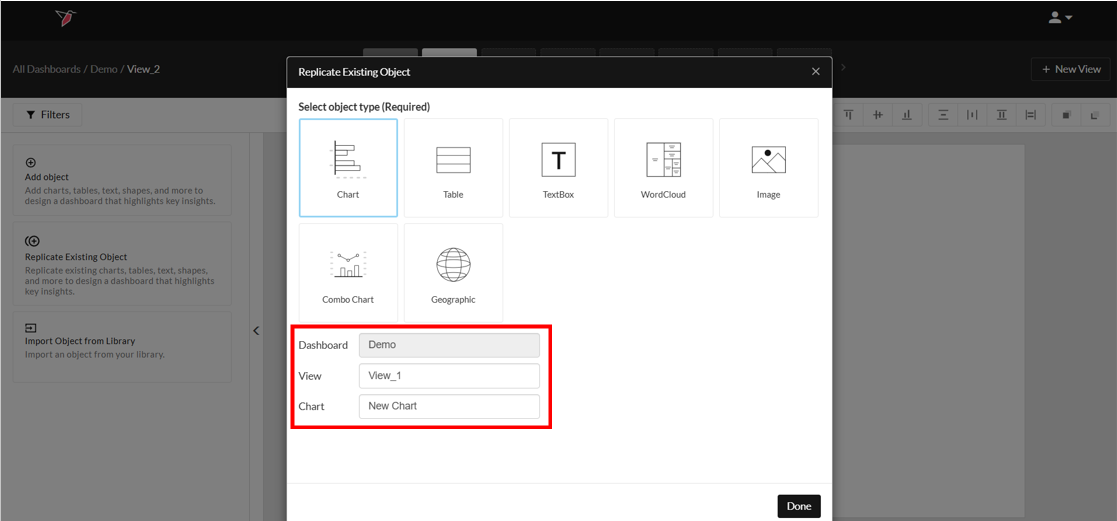
- Click on the type of object you want to copy from a different location.
- Select the View and Object that you want to replicate from an existing view and click Done.
Arranging Dashboard Objects
Redbird is equipped with features like layering and alignment that make this process very easy while allowing you to make your dashboards look exactly the way you want.
Layering
When you add dashboard objects on Redbird, they can overlap. Change the way objects overlap by using the layering functionality. Complete the following steps to change the stacking order of objects:
- Select an object by clicking on it or select multiple objects by pressing and holding the Ctrl / Cmd keys on your keyboard and clicking on the objects.
- Next, select from the options in the top right layer the objects. You can either bring them forward or send them backward.
Alignment
You can align multiple objects on the workspace to obtain a clean, professional look on your dashboard. To do this:
- Select an object by clicking on it, or select multiple objects by pressing and holding the Ctrl / Cmd keys on your keyboard and clicking on the objects.
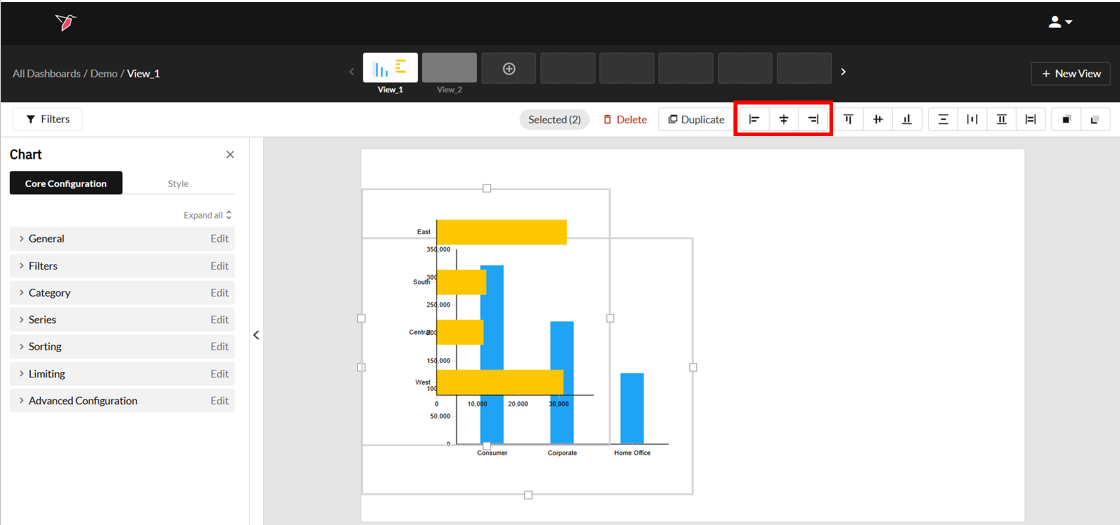
- Next, select from the options in the top right to arrange the objects.
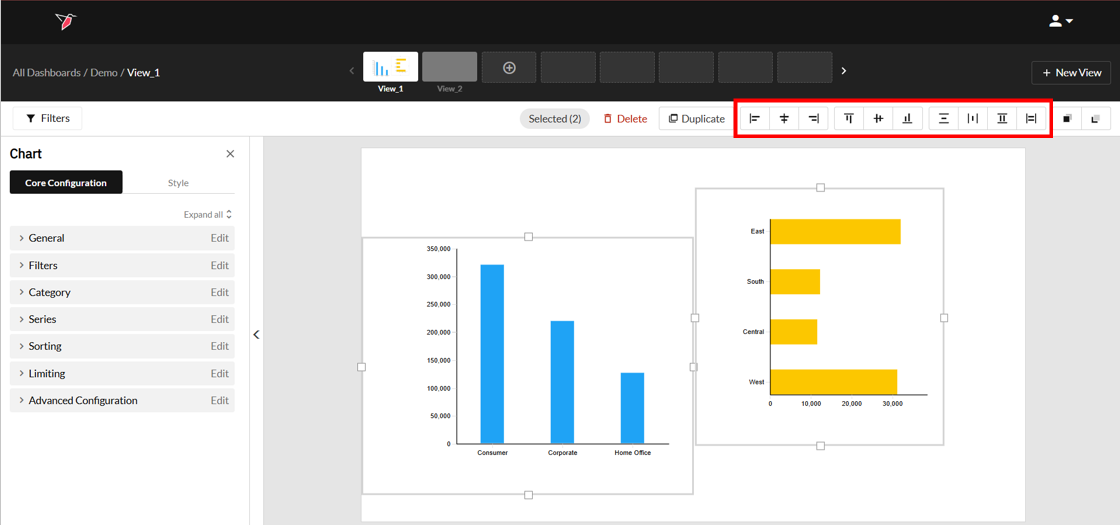
- Each button has a different purpose, which is outlined below:
- Select from the options below to align objects to the left, in the middle or to the right.
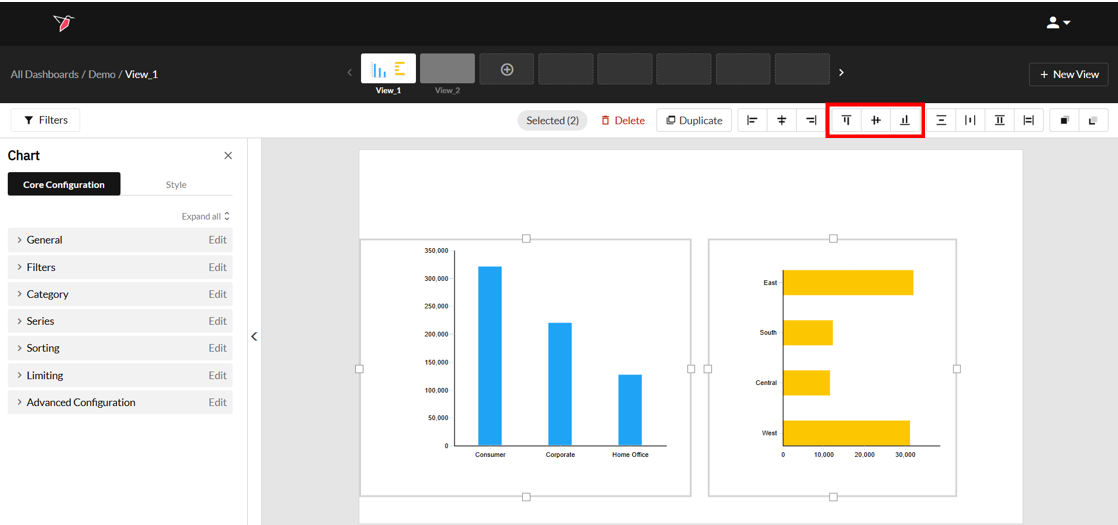
- Select from the options below to align the objects at the top, in the center or at the bottom.
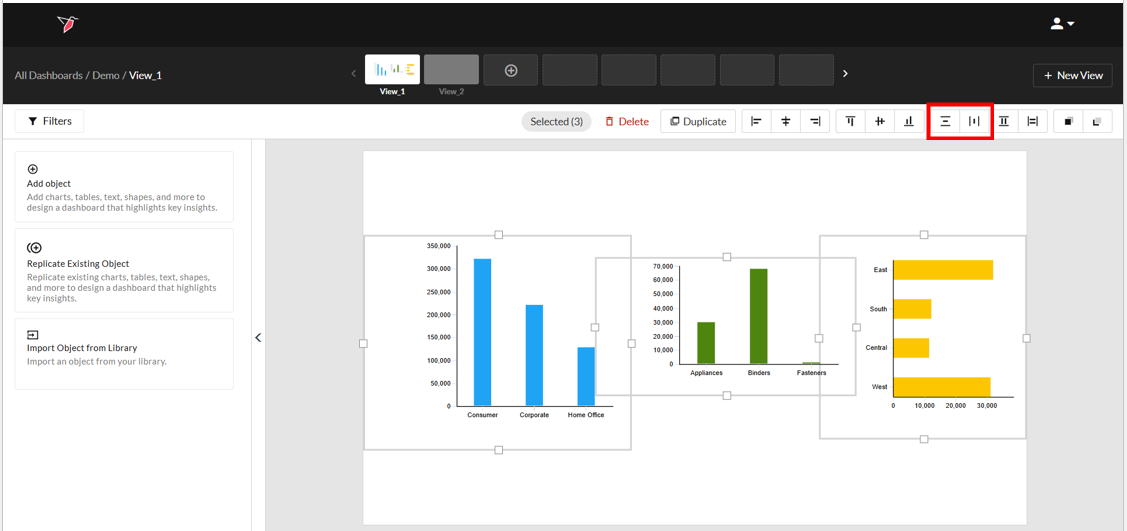
- Select from the options below to make sure the objects are spaced equally in the vertical or horizontal directions respectively.
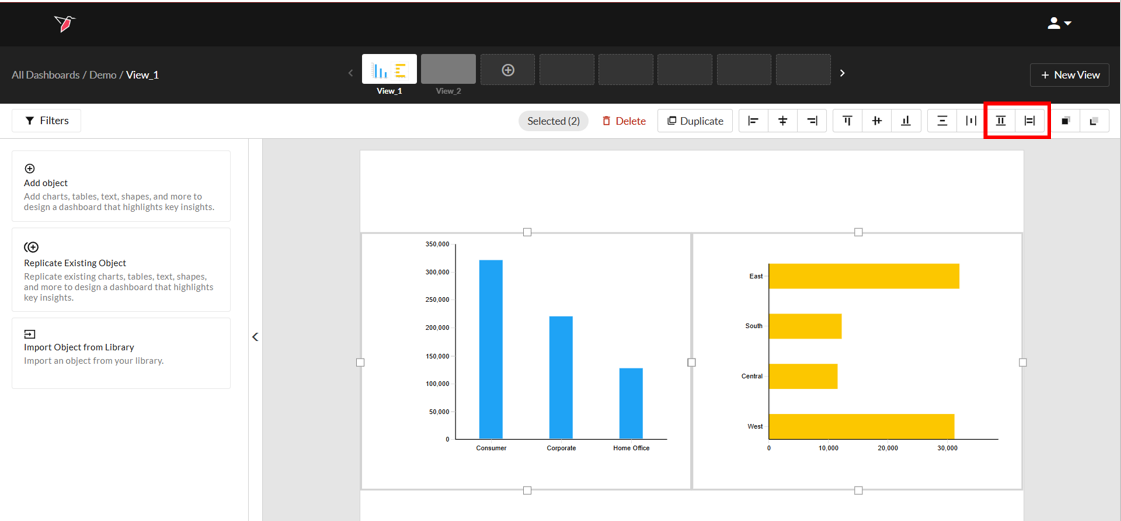
- Select from the options below to match the height and width of the objects.
- Select from the options below to align objects to the left, in the middle or to the right.
Switching Datasets on Objects
Dashboard objects (e.g. charts, tables, dynamic text, etc.), are generally associated with a dataset to produce the desired visualizations and calculated values. Consider the following situations:
- You created a table to show the sales by region, but you used the wrong dataset.
- You created a table to show the sales by region using last month’s data, but the latest month’s data is in a different dataset.
- You created a chart in a different dashboard, but you want to reuse the same chart on the dashboard and data you are currently working with.
In all of the above scenarios, you can reuse dashboard objects by associating them with a different dataset.
To switch the dataset on a dashboard object, do the following:
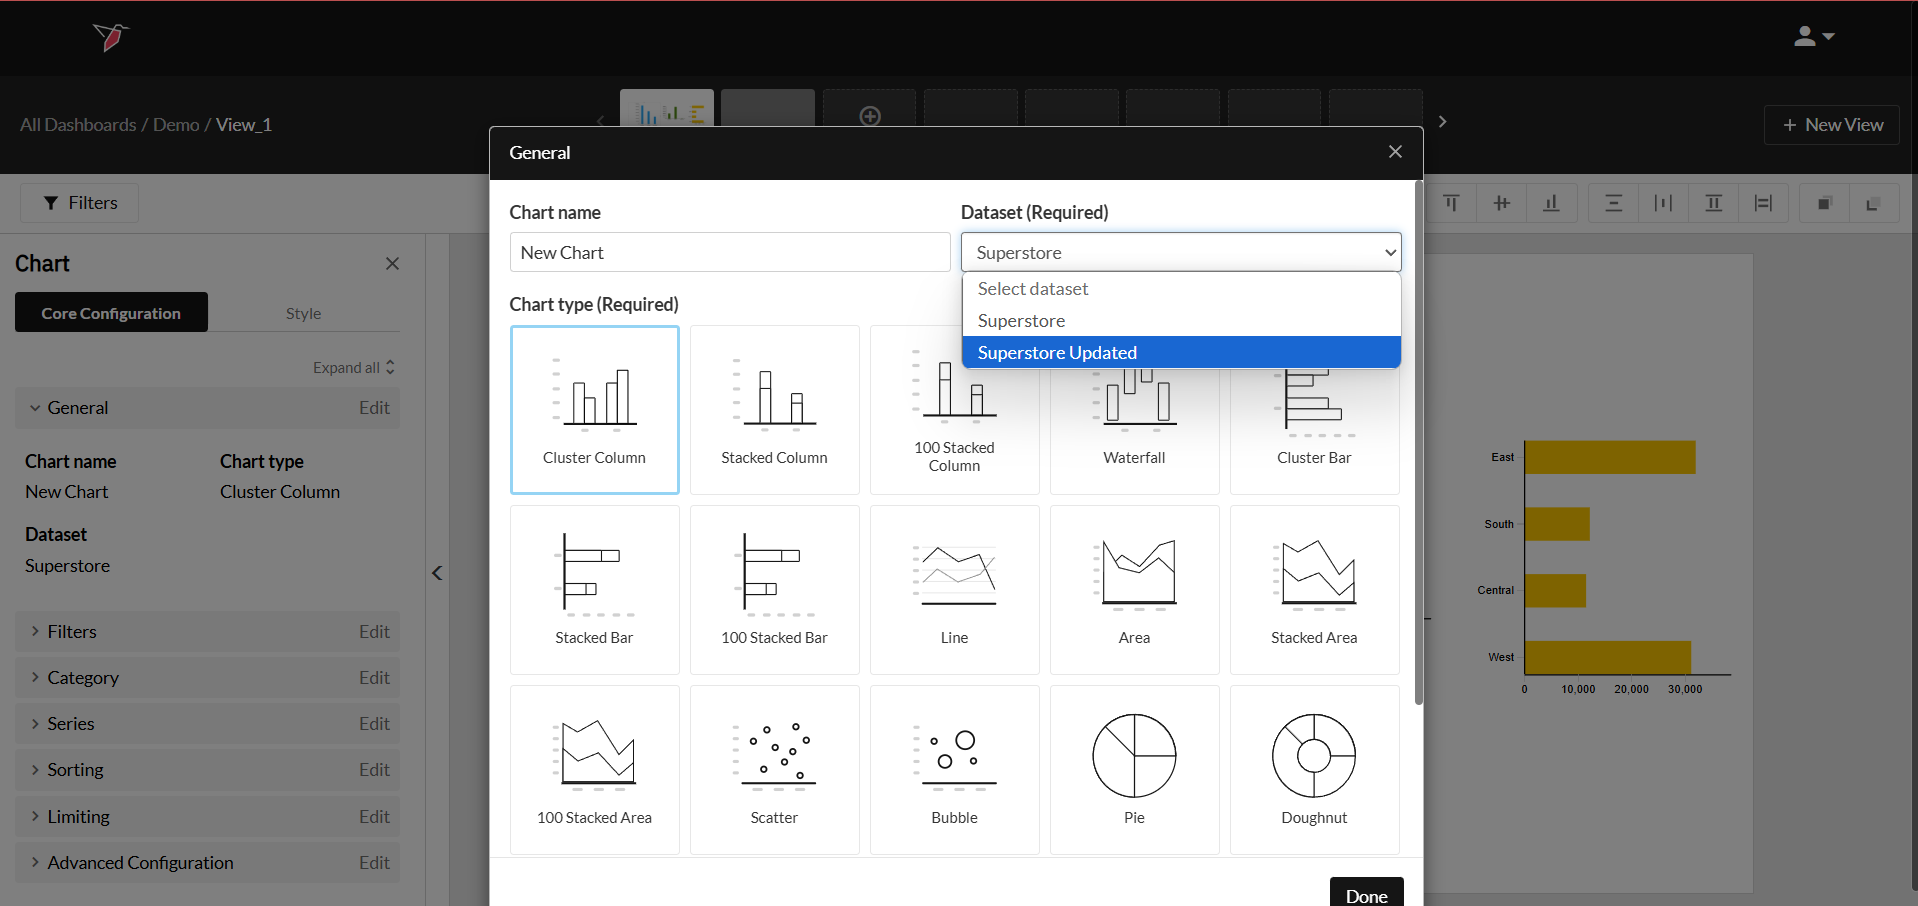
- Click on the object you want to switch the dataset for, and navigate to the General menu on the Actions Panel.
- Select Edit and choose the desired dataset from the drop down. When you click Done you will be taken to the dataset mapping wizard.
Note: if you do not see the dataset, double check that it is connected to the dashboard node on the canvas.
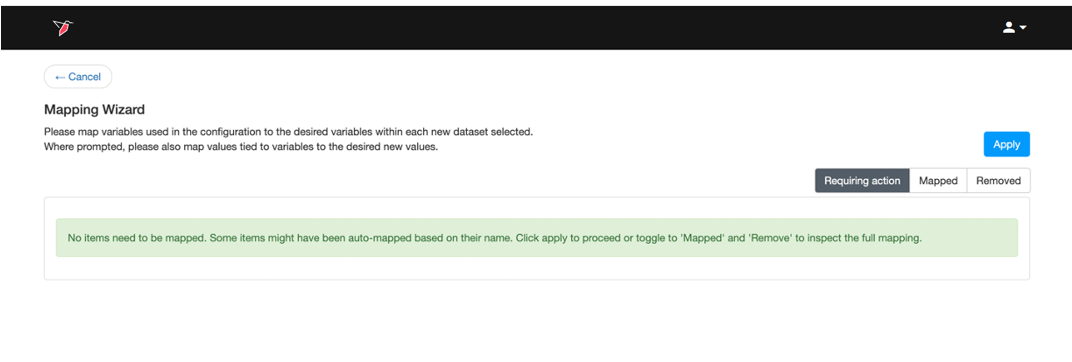
- The wizard will try to map all the columns used in the dashboard object to the new dataset. If Redbird was able to successfully auto-map everything, you will see the following:
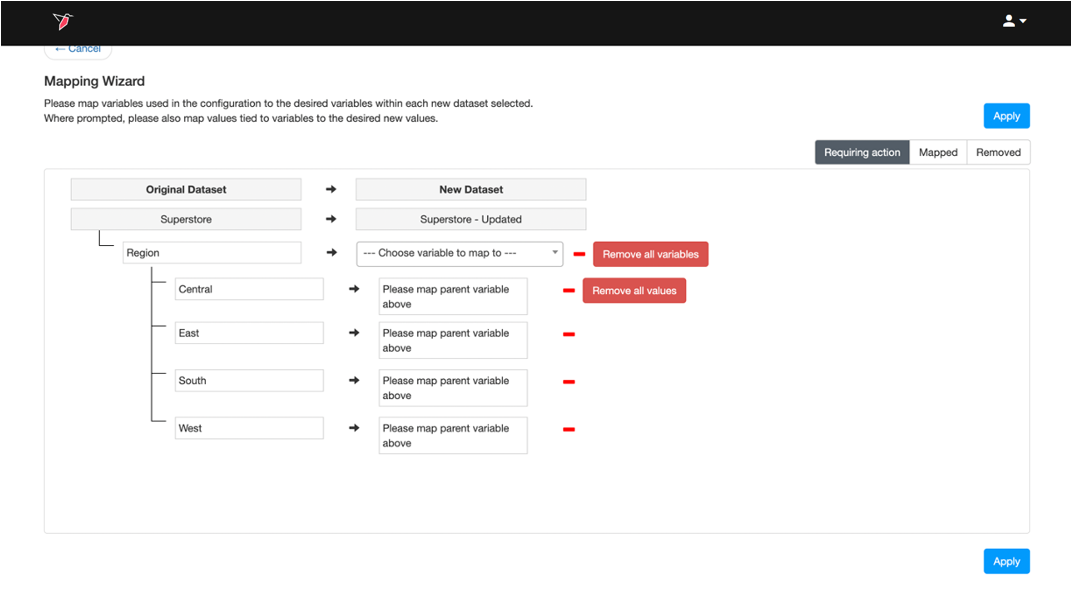
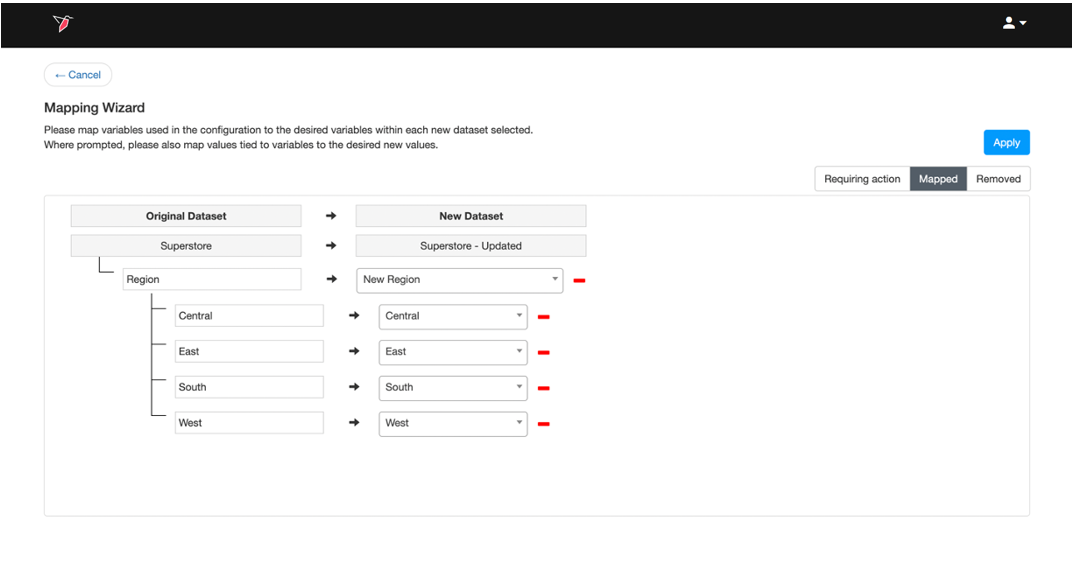
- The mapping wizard will ask you for inputs in the Requiring Action tab if there are any columns or values that need mapping. From here you can do the following:
- Map the columns and the values (shown as a sub-level) from the original dataset to the new dataset. Any variables and values that were mapped will move to the Mapped tab in the upper-right corner of the wizard.
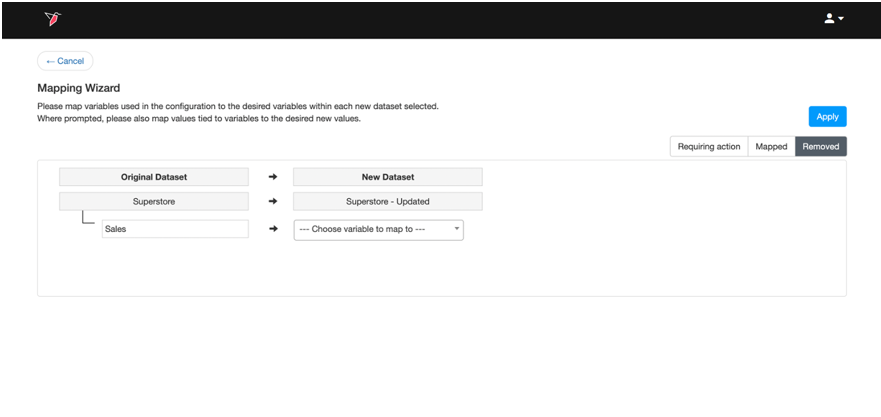
- Remove the column (variable) or value mappings one by one by clicking the red delete sign on the right-hand side of the mappings. Note that removing mappings may cause some operations to break. You will have to edit the operation to fix it in this case. Any variables and values that were removed will move to the Removed tab in the upper-right corner of the wizard.
- To bulk remove mappings use the Remove all variables and Remove all values buttons. Any variables and values that were removed will move to the Removed tab in the upper-right corner of the wizard.
Important:Mappings have to be one-to-one. This means that multiple items (variables or values) from the original dataset cannot be mapped to one item in the new dataset and vice versa.
- This step is optional. To edit any mappings that were previously made, click Mapped on the upper-right corner of the wizard. This will show you a list of items that were previously mapped, which you can change.
- This step is optional. If you want to edit the mappings for items that were removed, click Removed on the upper-right corner of the wizard.
- Once you are done with the column mappings, click Apply in the upper-right corner. The object will be refreshed with the new data.
Filtering Data
Once a dashboard has been set up with objects containing filters, you can easily update the objects to see different cuts of data. By clicking Filters in the top left, you can see all of the consolidated visible filters from the dashboard objects on both the view and dashboard levels. The consolidation will take place if the same option is selected on all objects.
Information:You can further consolidate filters across the dashboard from different datasets upon publishing the dashboard, see our guide on Publishing Dashboards for more information.
To apply filters, do the following:
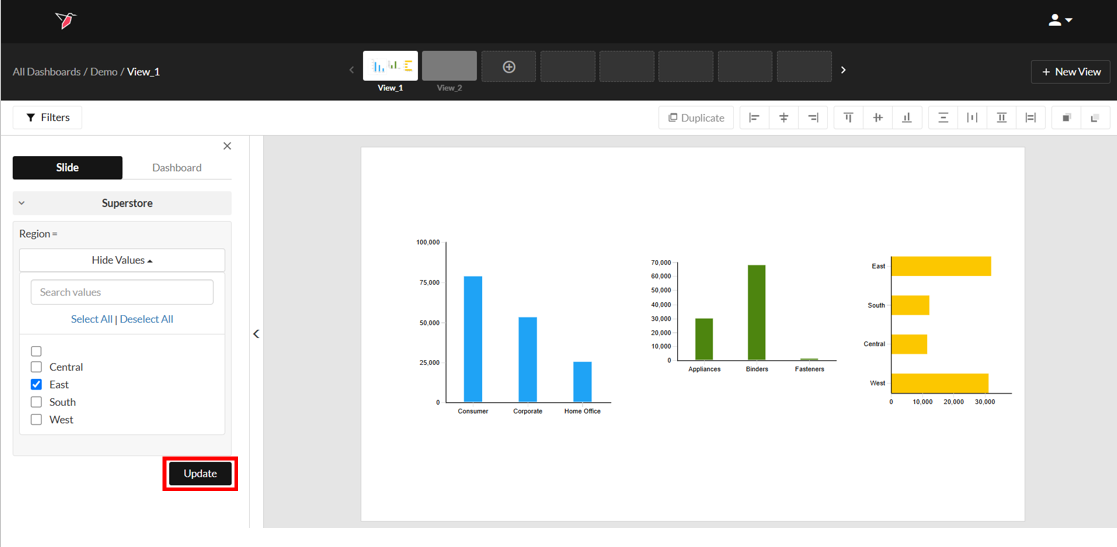
- Click Filters on the Actions Panel.
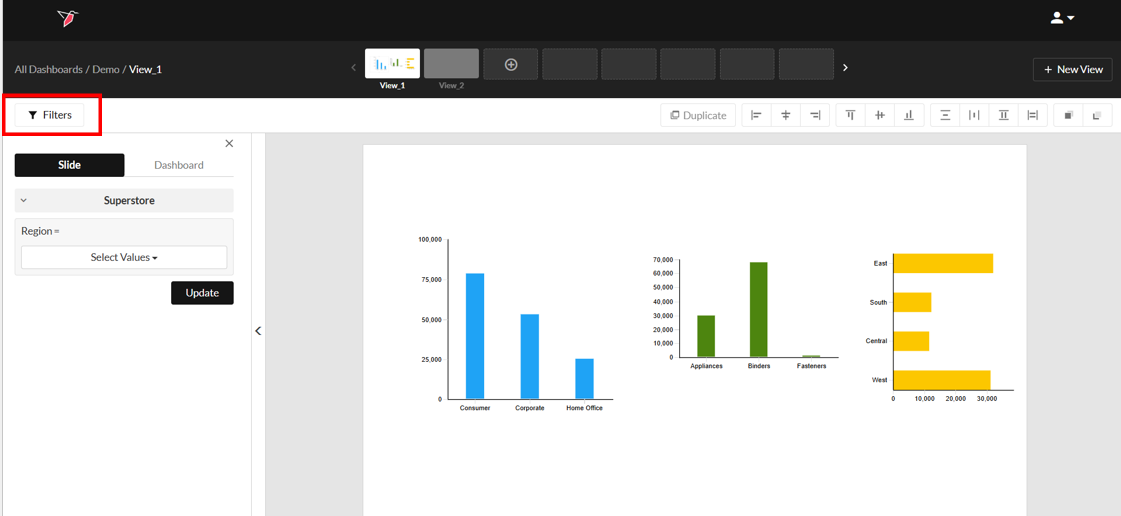
- Click View to update the filters on all the objects on the current view, or click Dashboard to update the filters on all the objects in the entire dashboard.
- Update the desired filters and click Update to apply the change.