Cluster Operation
Background
The Cluster operation lets you cluster your data into different groups using unsupervised learning. This operation is useful in scenarios where you don’t already know how you want to group your data and want Redbird to automatically uncover groups for you. Redbird allows you to cluster data based on the values of multiple columns in your dataset (Numerical Clustering) or based on topics detected within a single text column (Topic Clustering).
How It Works
To demonstrate how the Cluster operation works and the value it can provide, we are going to walk through an example using data from a fictitious superstore that sells a variety of products.
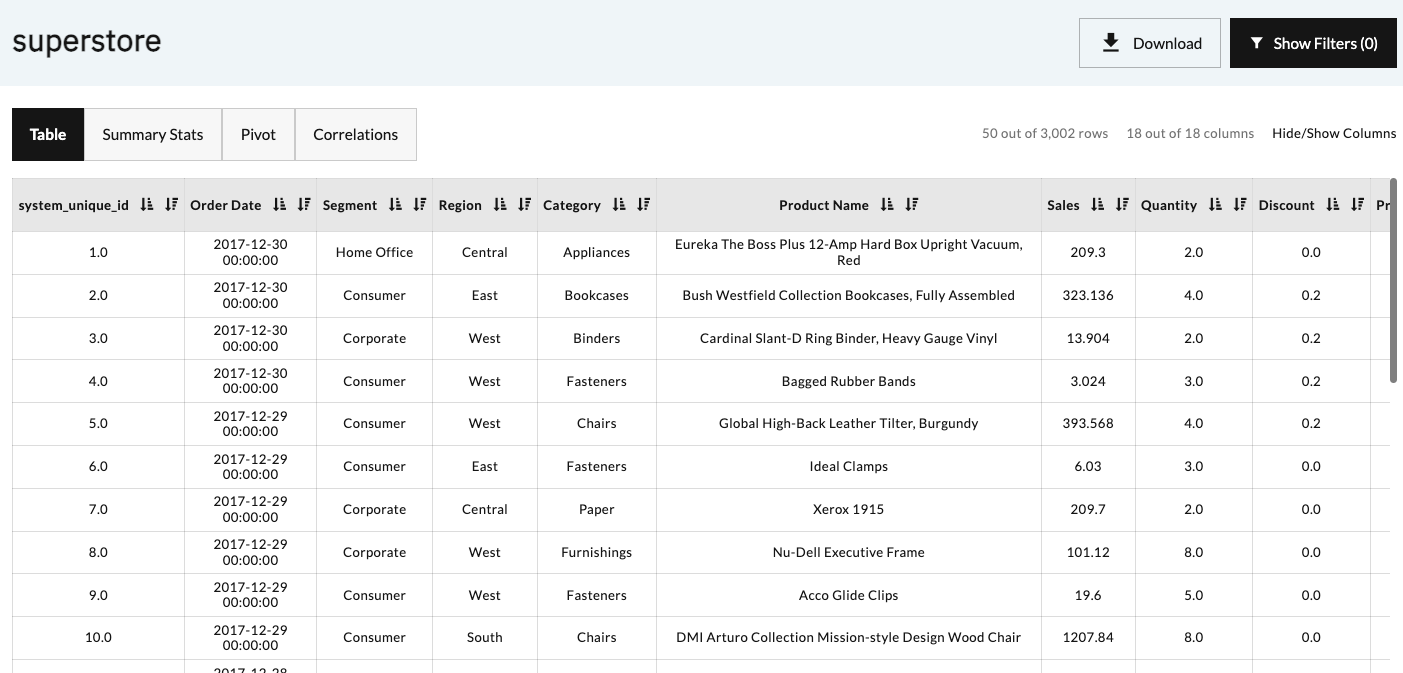
The data below is a list of products and was uploaded into the Redbird Platform. This dataset contains eighteen columns including information about each item, its taxonomy, sales data, date, and profitability. We can cluster them into groups based on the below information.
Numerical Clustering
In this example, we are interested in understanding how our different products can be grouped to better understand the typical collections products available for sale. To complete our analysis, we will use the Cluster operation’s Numerical Clustering algorithm. Numerical Clustering within the Cluster operation is configured by choosing the columns you would like to base the clustering on and choosing the number of clusters you would like to see.
Clustering Algorithmic Details
From there, you can choose one of five algorithms, each with their own pros and cons:
- K-Means: This is a fast, greedy algorithm that forms randomly distributed centroids, then iteratively updating the centroid position by taking the average of the datapoints in each cluster. This process is repeated until the centroids no longer move. While quick, this algorithm tends to perform best on uniform, space-separated points and will typically not behave well if the data contains non-uniform natural splits like spirals or concentric circles.
- DBScan: A longer running algorithm, but is able to distinguish clusters of arbitrary shape by using point density, rather than point distance as its primary kernel function. This algorithm is also able to identify outliers in the dataset, which are denoted with a negative cluster value to show that they do not belong to any cluster.
- OPTICS: Like DBScan, this algorithm uses point density as its primary metric, but instead of relying purely on density, OPTICS orders points based on their "reachability". This is useful for data that has varying levels of point density with many outliers.
- Spectral Clustering: Attempts to identify similar patterns in the data by constructing a similarity matrix for all points, then performing dimensional reduction to reduce the complexity of the space. Finally the K-Means algorithm is run on the reduced dataset. This is a long-running algorithm but is particularly useful for data that has complicated relationships in a few columns of data.
- Agglomerative Clustering: This algorithm uniquely uses a bottom-up clustering approach, where each initial data point is its own cluster, and clusters are iteratively merged until a single cluster remains, forming a hierarchal tree. While this algorithm is particularly computationally intensive as it requires computing distances between all points of possible pairs, it is particularly useful for its resistance to contamination by outlier points.
The clustering operation generates three outputs: the clustering results dataset, with the cluster designations appended to the original dataset, the Clustering macro output page, and the cluster descriptions dataset.
The screenshot below provides an example output from our General Clustering summary status page after it has run.
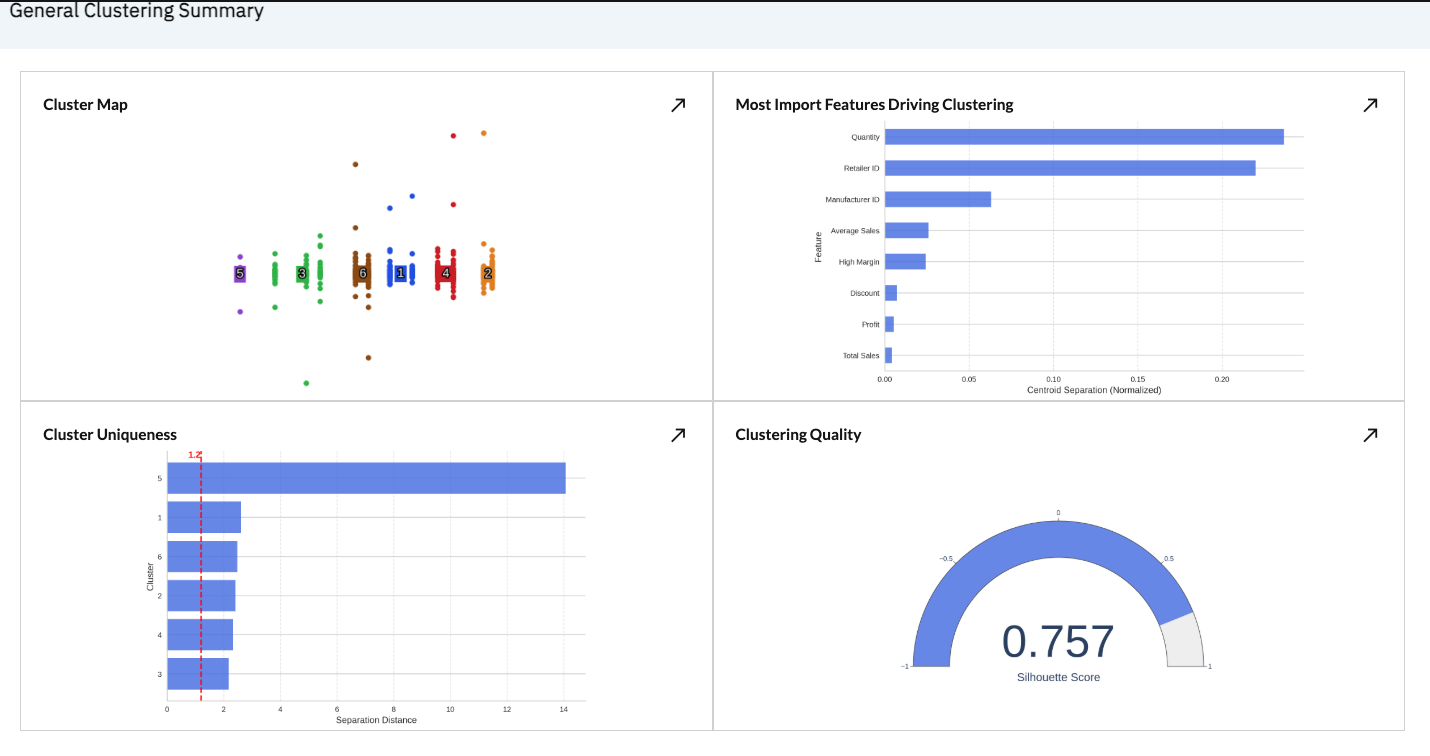
We can see a number of scatter plot showing our clustered data points at the top, as well as a number of supplementary cluster performance details, including:
- Features driving clustering: Which clustering inputs are most impactful, creating the most cluster uniqueness
- Cluster Uniqueness: How far apart each cluster is from its neighboring clusters, relative to its cluster size. Larger numbers are more isolated clusters and smaller numbers are less isolated.
- Clustering quality: The silhouette score of the clusters, where -1 is completely overlapping, and 1 is completely non-overlapping clusters based on their size and components.
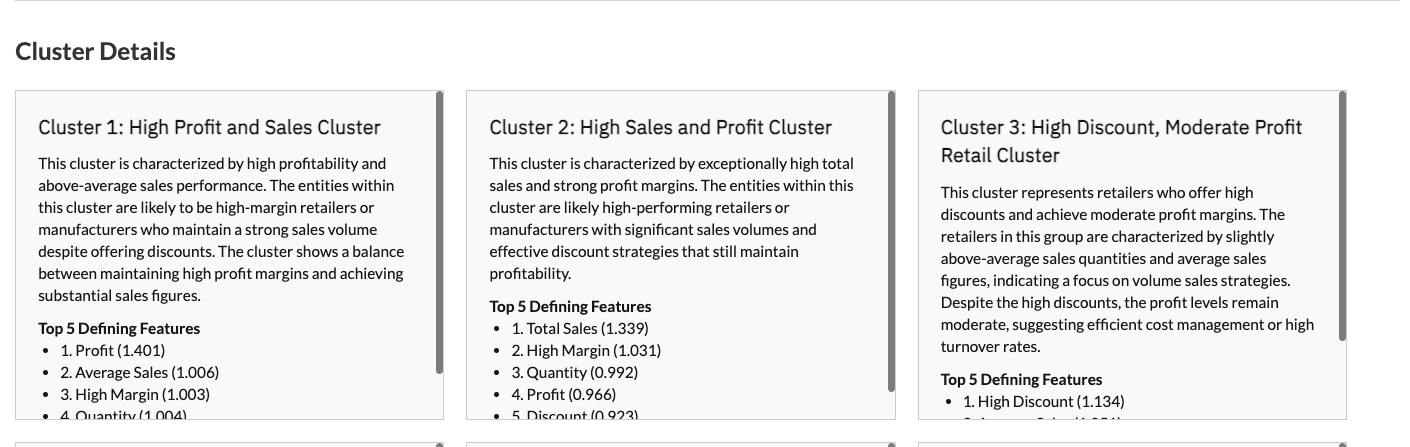
We also provide AI-generated clustering summaries and titles for easy digestion and for populating downstream resources like dashboards and summary tables.
Finally, the Clustering Summary dataset provides a cluster-by-cluster readout of the average values of each feature for each cluster, along with the summaries and titles for future use downstream.
Topic Clustering
In another scenario, we may be interested in understanding the topic clusters that exist within our Product Name column that lists a long-form text description of each product sold. To accomplish this, we will use the Cluster operation’s Topic Clustering algorithm. Topic Clustering within the Cluster operation is configured by choosing the text column you would like to base the clustering on and selecting the number of topic clusters you would like to see.
The screenshot below provides an example output from our Topic Clustering operation after it has run.
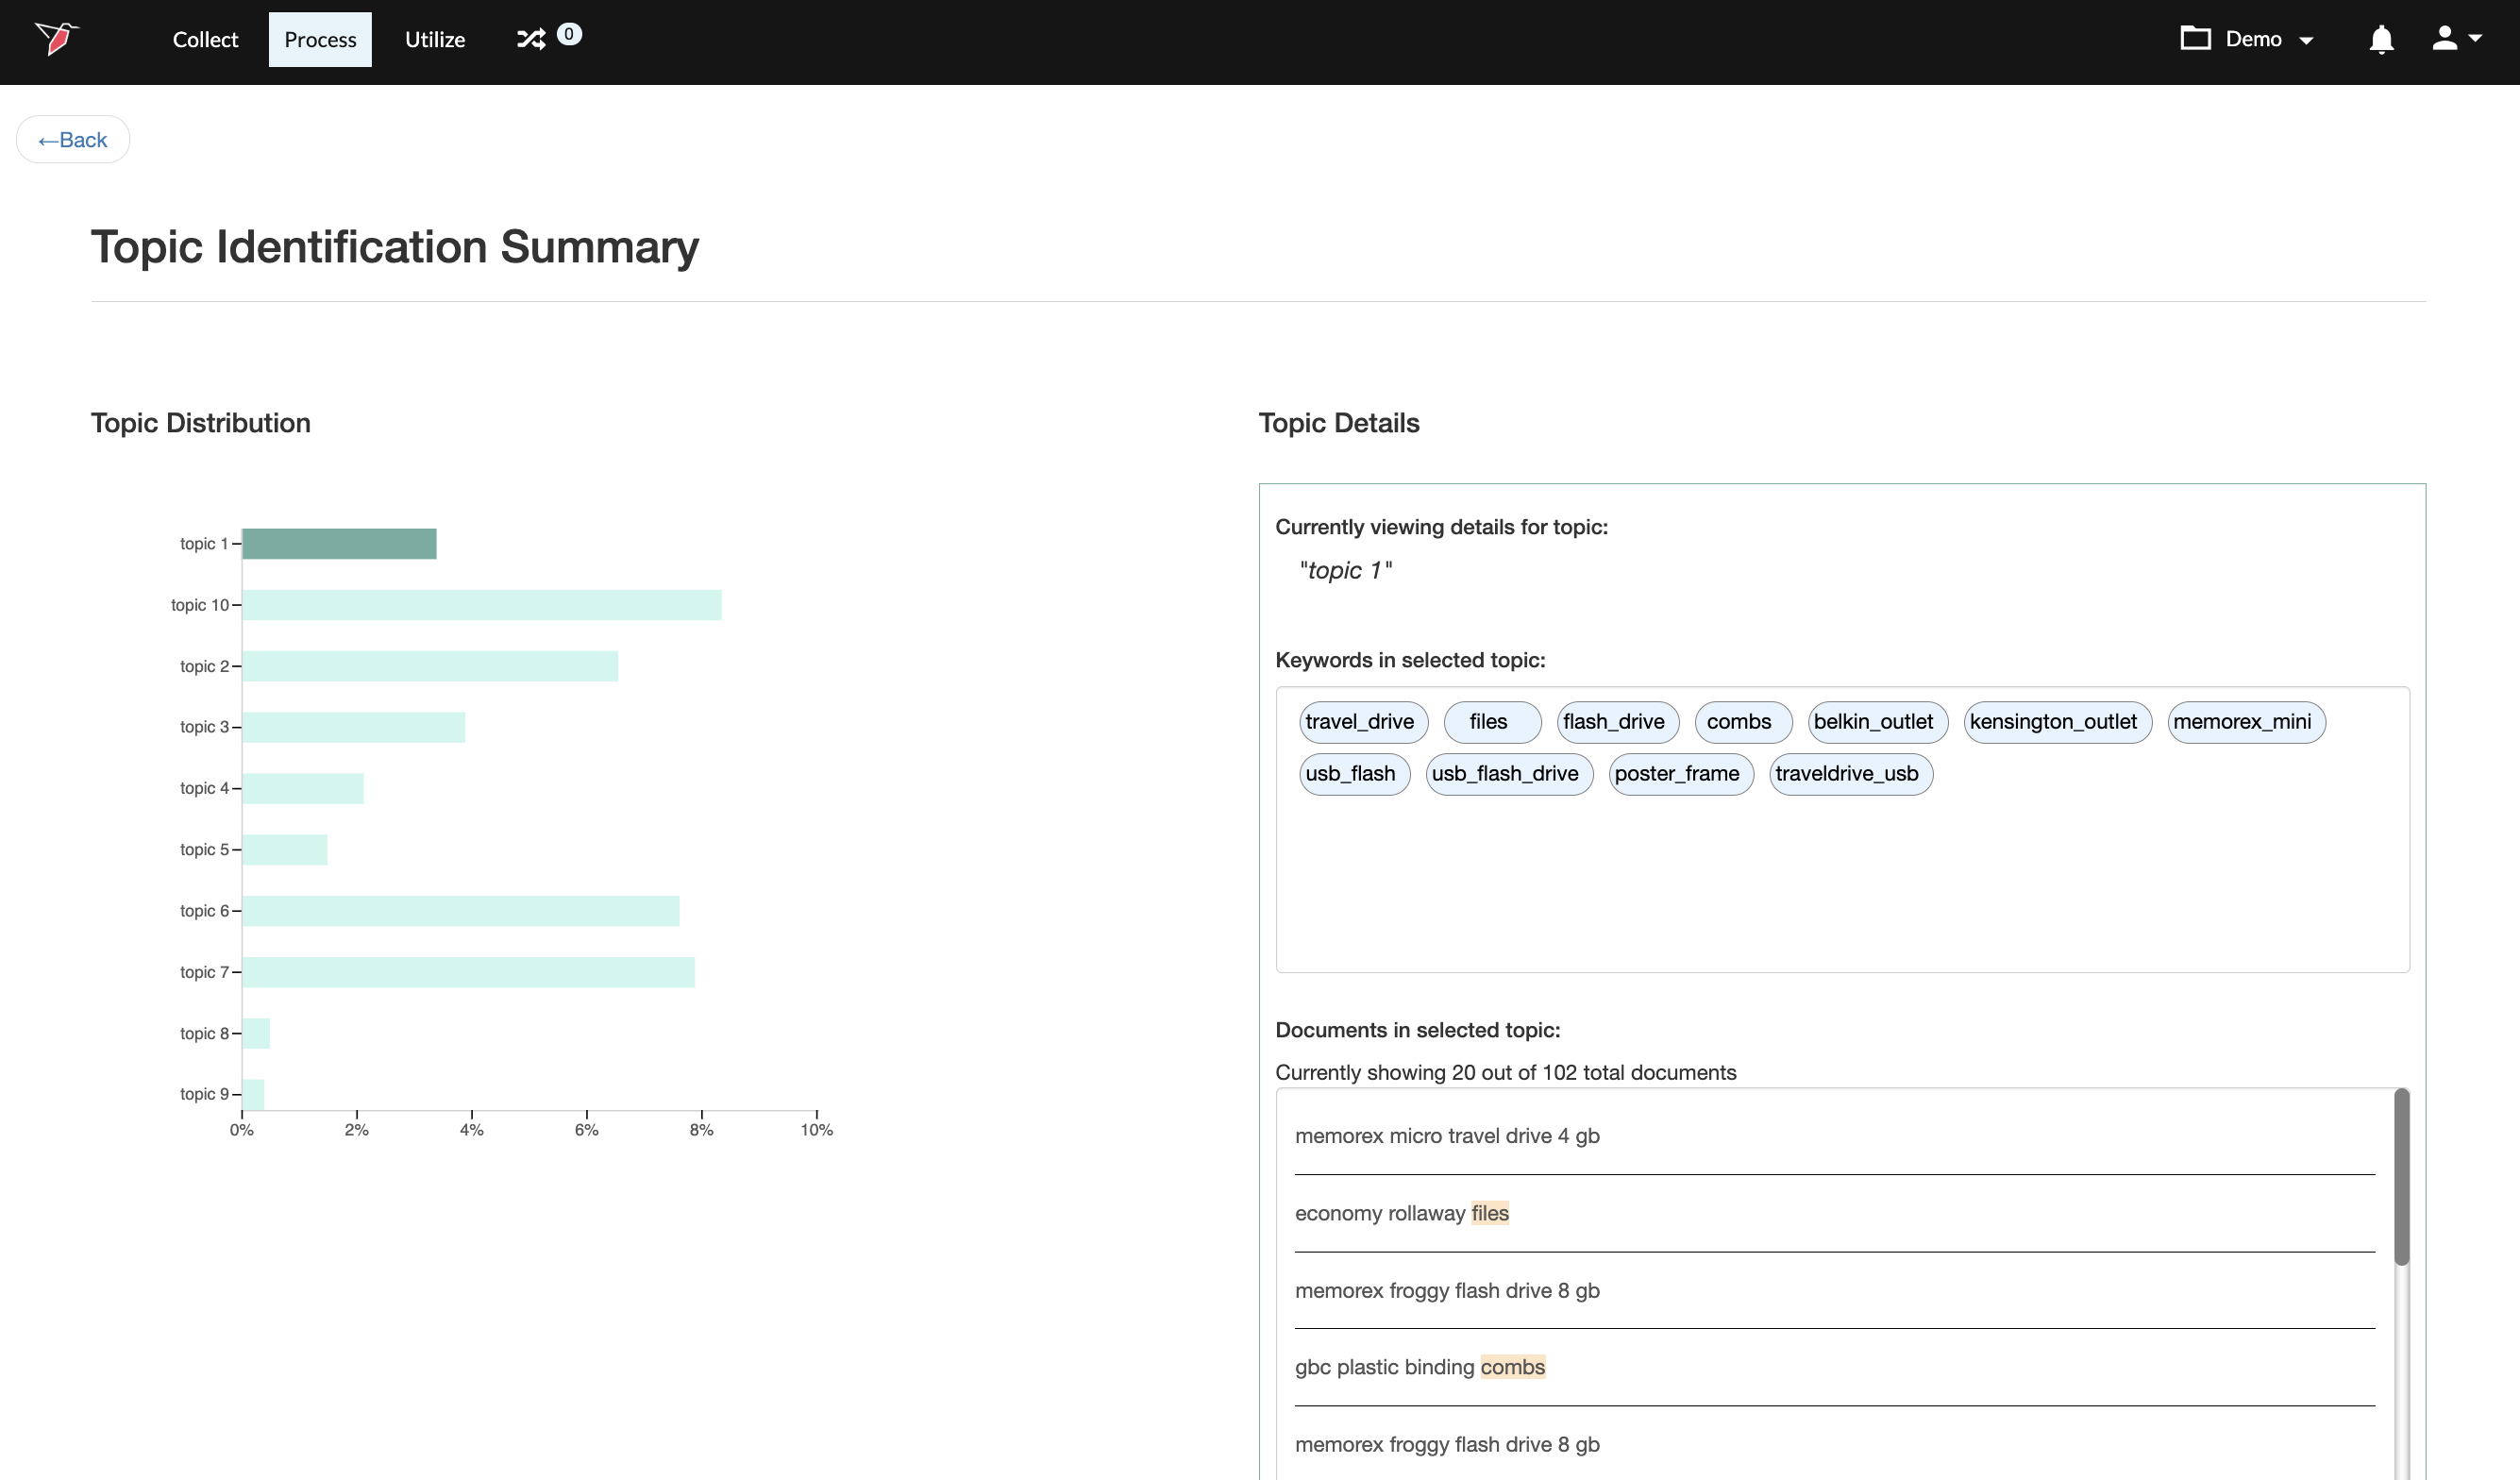
In the output summary we can see a bar chart summarizing the topics identified and their frequency on the left panel. When we select any of the identified topics (by clicking on an individual bar data point), we can also see more details for that topic on the right panel. These details include the most frequently used keywords within the cluster as well as a sampling of the records in our dataset that were tagged as matching this topic.
Configuration
To add and configure the Cluster Operation, please follow the below steps
- Add a Macro from the workflow builder menu in the Process section, if one is not already created, and attach a dataset. Then, click the node, and click "Edit" to edit the macro.
- Select the Cluster operation in the right panel by utilizing the search bar or by browsing the list of categories. To add the Cluster operation to the macro builder, click on the name of the operation. This will add the operation to the Macro Builder canvas on the left panel.
- Click Edit within the Cluster operation in the Macro Builder panel
- Configure the Operation:
Numerical Clustering
To configure the Numerical Clustering operation, we are going to use the example from the “How it Works” section.
As a first step, select the Numerical Clustering tab at the top of the configuration screen.
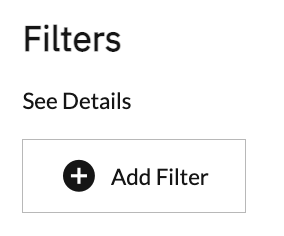
Next, if you would like to pre-filter the data before running your clustering, add any desired filters in the Filters section of the configuration screen.
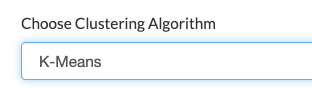
Select your algorithm by choosing one of the five configurable algorithms in the dropdown menu:
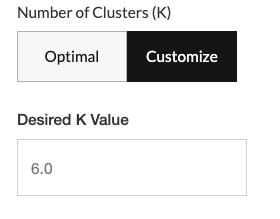
Set your desired number of clusters by first choosing either ‘Optimal’ (Redbird will automatically determine the optimal number) or ‘Customize’ (user will define the number). If you choose Customize, you will be asked to enter your desired number of clusters (for most algorithms) or the EPS value (for the DBScan algorithm). The EPS value is the maximum allowable distance from the point to the center of the cluster that any point is allowed to be while still being made part of the cluster.
Tip:On your first clustering run, start by choosing Optimal to see what the ideal number of clusters is based on Redbird's automated evaluation. Once you know the optimal level, you can then go back and customize the number of clusters up or down from this starting point.
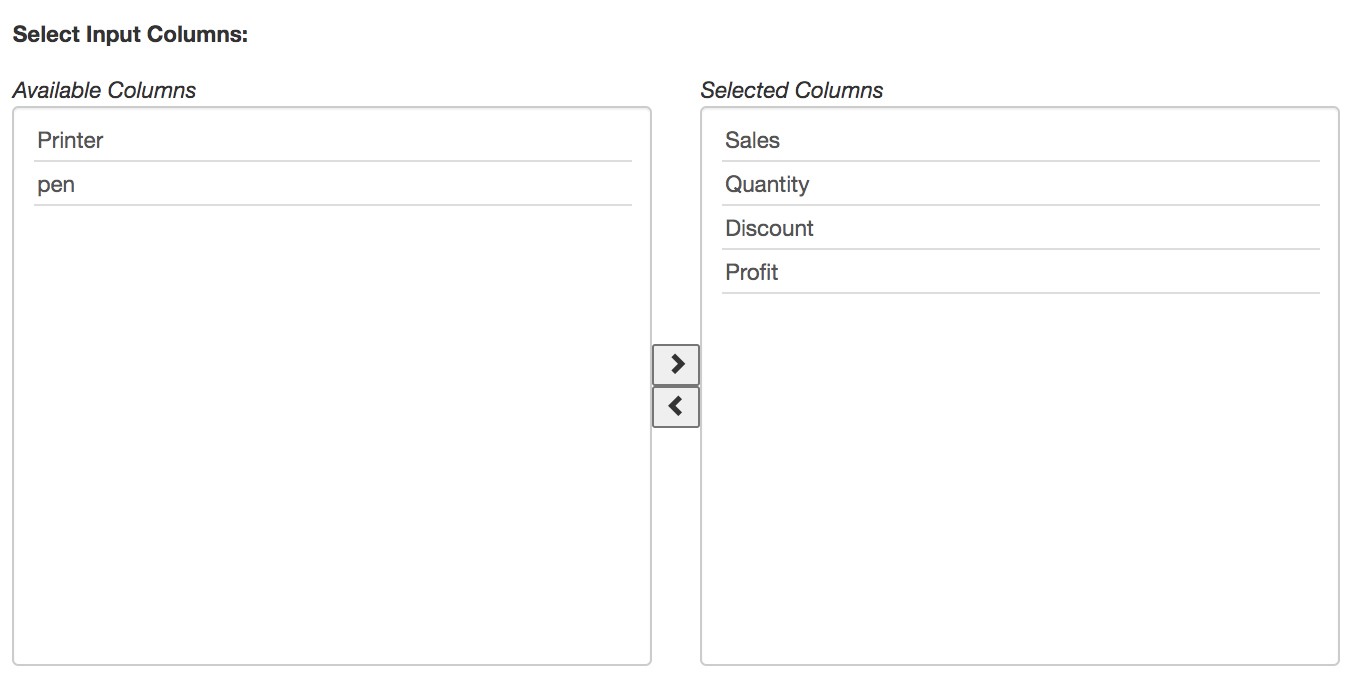
Next, select the columns within your dataset that you would like to base your clustering on. For Numerical Clustering, only Number or Binary columns will be available for selection. To add columns, highlight them in the Available Columns selector on the left and move them to the Selected Columns bucket on the right by clicking on the button.
Once your configuration is complete, click on the Complete Configuration button at the top right of the view.
Topic Clustering
Step 1 - Edit Configuration
To configure the Topic Clustering operation, we are going to use the example from the “How it Works” section.
As a first step, select the Topic Clustering tab at the top of the configuration screen.
Next, if you would like to pre-filter the data before running your clustering, add any desired filters in the Filters section of the configuration screen.
Next, provide the configuration details for your Topic Clustering:
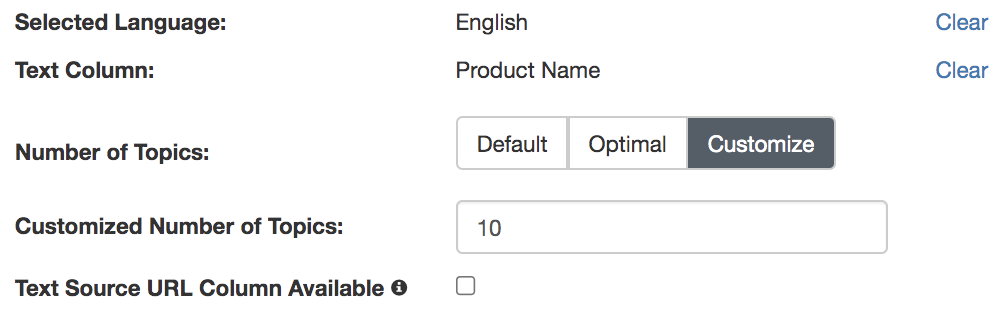
- Selected language: The language of the text in your Text Column
- Text Column: The column containing the text documents you would like to run the topic clustering on.
- Number of Topics: How many topics to identify, Options are Default (8 topics), Optimal (automatically determined by Redbird), and Customize (user-defined number of topics)
- Text Source URL Column Available: If you have a URL column that points to native representations of the text documents (e.g. link to post on social media site or reviews site), check the box next to Text Source URL Column Available and select the column from the dropdown that appears next
Once you have finished with your configuration details, click the Continue button at the top right of the configuration view to move to the next step.
Step 2 - Customize Topics
Within this step, you will have the option to customize the initial topics that were identified in the clustering analysis. Customization can involve:
- Adding Topics
- Removing Topics
- Renaming Topics
- Editing Topic Keywords
Adding Topics
To add a new topic to the initial topics identified, click the (+ Add a topic) button at the top left of the topics area. This will append a topic with no keywords to the end of the list of topics. Keywords can be added to the blank topic to define it.
Removing Topics
To remove a topic, just click on the (X) icon at the top right of the topic block you wish to remove.
Important:Once you have removed a topic, all keywords contained within the topic block will be deleted. If you wish to save the keywords within a given topic block before deleting, you can move the keywords to the Available Keywords block at the top of the configuration view first. For details on how to move keywords please see the Editing Topic Keywords section below.
Renaming Topics
After the initial clustering algorithm has run, your topics will have generic, numbered names (e.g. topic 2). To edit the name of a topic, simply click into the name field at the top of the topic block, make your edits, then click out of the name field.
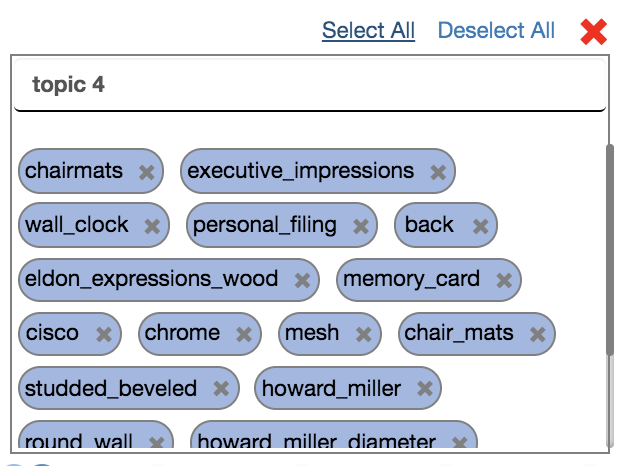
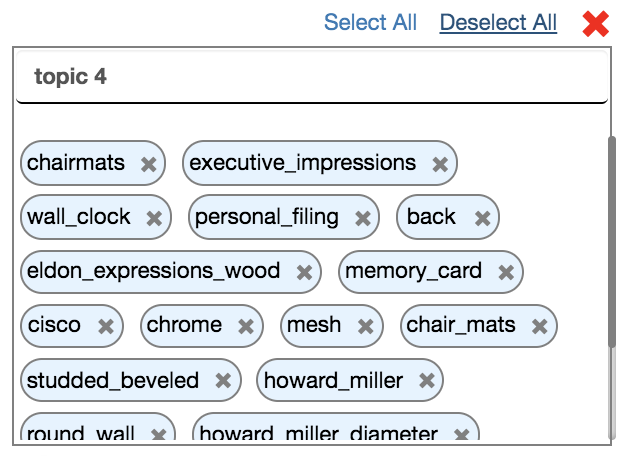
Before / After Edit
Editing Topic Keywords
Topic keywords can be created, deleted, or moved between topic blocks within the configuration view. The ability to edit topic keywords allows you to modify the initial machine-generated topic definitions to match your desired specifications.
As a first step for editing existing topic keywords, you will need to select the keywords you would like to edit.
-
Selecting / Deselecting Keywords
- Option 1 - Select / Deselect Individually: Click on the oval keyword pills individually to select keywords (anywhere other than the ‘X’ icon - clicking it will delete the keyword). You can select keywords from multiple topic blocks at once by simply clicking them in succession. Clicking a selected keyword again will deselect it.\
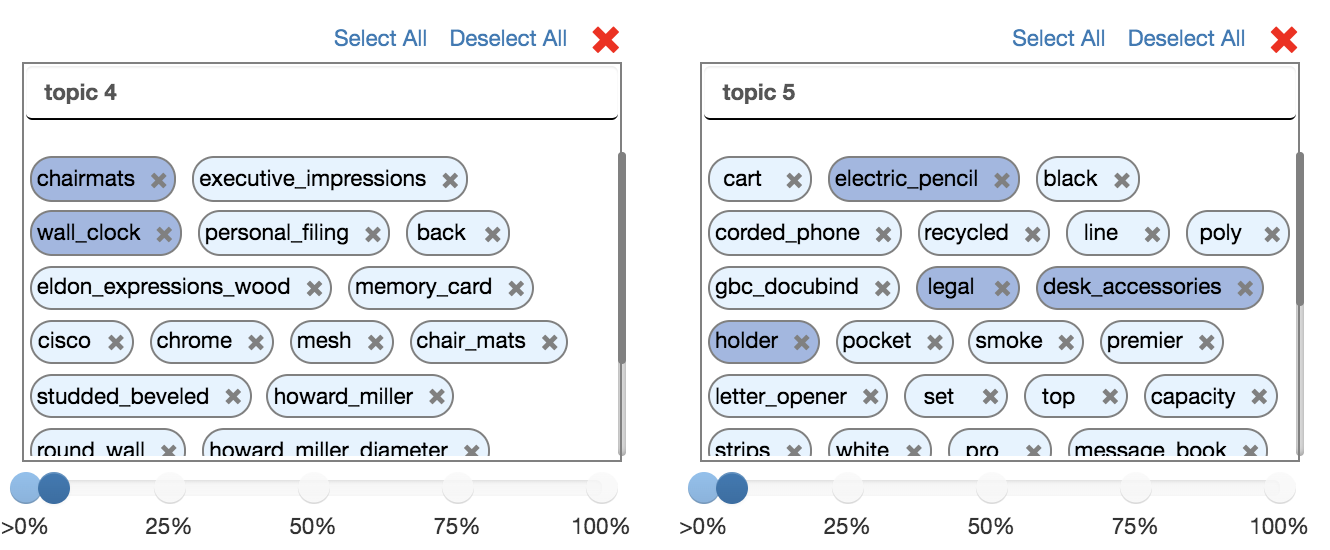 \
\ - Option 2 - Select / Deselect in Bulk: Click on the ‘Select All’ or ‘Deselect All’ links at the top right of each topic block to select / deselect all the keywords in that block.\
- Option 1 - Select / Deselect Individually: Click on the oval keyword pills individually to select keywords (anywhere other than the ‘X’ icon - clicking it will delete the keyword). You can select keywords from multiple topic blocks at once by simply clicking them in succession. Clicking a selected keyword again will deselect it.\
-
Taking Actions on Selected Keywords
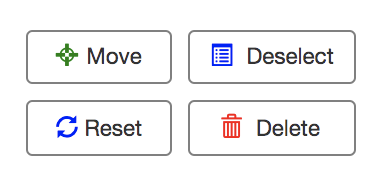
- Once you have selected your desired keywords, you are ready to take action on them. At the top right of the configuration view, you can see four buttons that enable keyword actions.\
 \
\
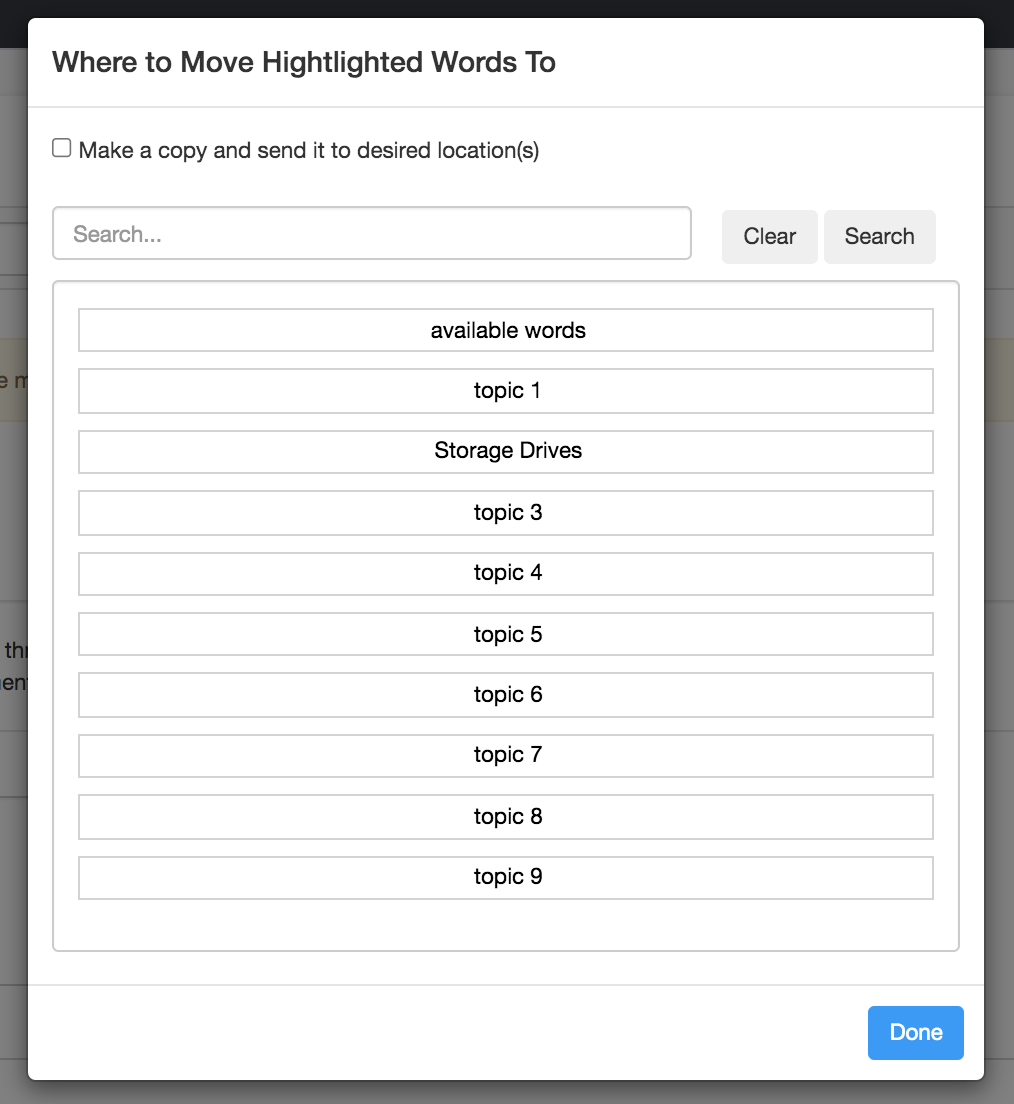
- Move: Move the selected keywords to a target ‘Topic’ or the ‘Available Keywords’ bucket at the top of the view (choose Available Keywords if you want to keep keywords available to add back to topics later). Clicking the (Move) button will launch a modal where you can select the destination for your selected keywords.\
 \
\ - Deselect: Deselect the currently highlighted keywords.
- Reset: Undo all manual changes and revert back to the initial topic clusters generated automatically by Redbird.
- Delete: Delete all selected keywords.
- Move: Move the selected keywords to a target ‘Topic’ or the ‘Available Keywords’ bucket at the top of the view (choose Available Keywords if you want to keep keywords available to add back to topics later). Clicking the (Move) button will launch a modal where you can select the destination for your selected keywords.\
- Once you have selected your desired keywords, you are ready to take action on them. At the top right of the configuration view, you can see four buttons that enable keyword actions.\
-
Adding keywords
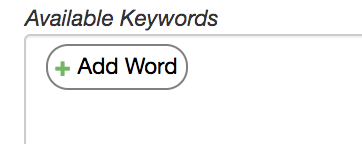
- If you want to add a specific keyword to a topic that was not automatically identified as a primary keyword for any of the topics, you can do so by clicking the ‘Add Word’ button within the ‘Available Keywords’ block at the top of the configuration view.\
 \
\
- If you want to add a specific keyword to a topic that was not automatically identified as a primary keyword for any of the topics, you can do so by clicking the ‘Add Word’ button within the ‘Available Keywords’ block at the top of the configuration view.\
-
Once a new keyword has been added to Available Keywords, it can then be moved to the topic block of your choosing per the instructions outlined in the ‘Taking Actions on Selected Keywords’ section of this article.
-
Changing the Number of Topic Clusters
- You can adjust the number of topic clusters and re-run your clustering through the ‘# of Topic Clusters’ setting area\
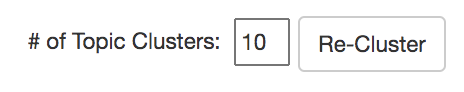 \
\ - Just enter the number of clusters you want and click ‘Re-Cluster’ to rerun the clustering algorithm. Please note that clicking ‘Re-Cluster’ will clear out any manual edits you may have made to the topic clusters.
- If you want to re-cluster but let Redbird determine the optimal number of clusters, just check the ‘Automatically find the optimal # of clusters’ checkbox, then click the ‘Re-Cluster’ button.\
 \
\
- You can adjust the number of topic clusters and re-run your clustering through the ‘# of Topic Clusters’ setting area\
-
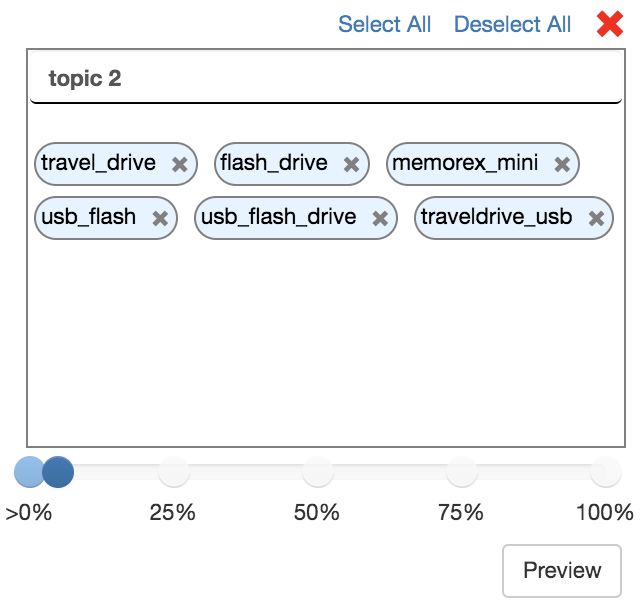
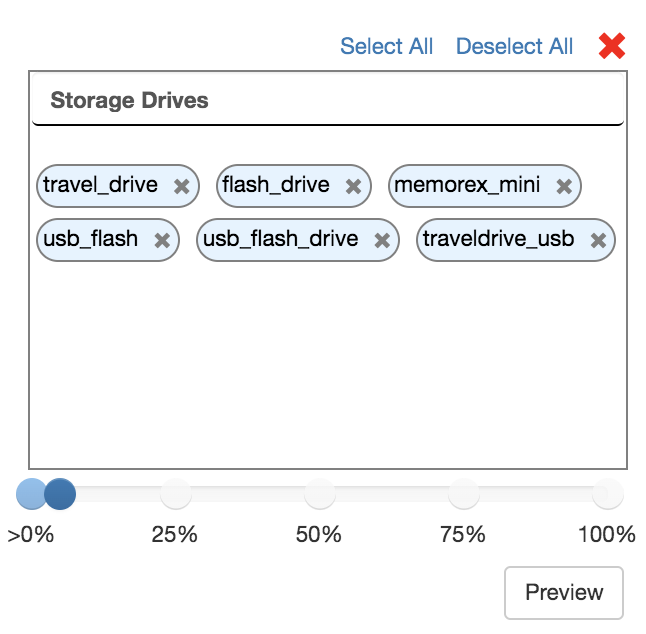
Previewing Topic Matches and Adjusting the Match Threshold
- For any topic cluster, you can preview the documents in your dataset that match the topic by clicking the ‘Preview’ button at the bottom right of a topic block. This will launch a modal that shows matching documents.\
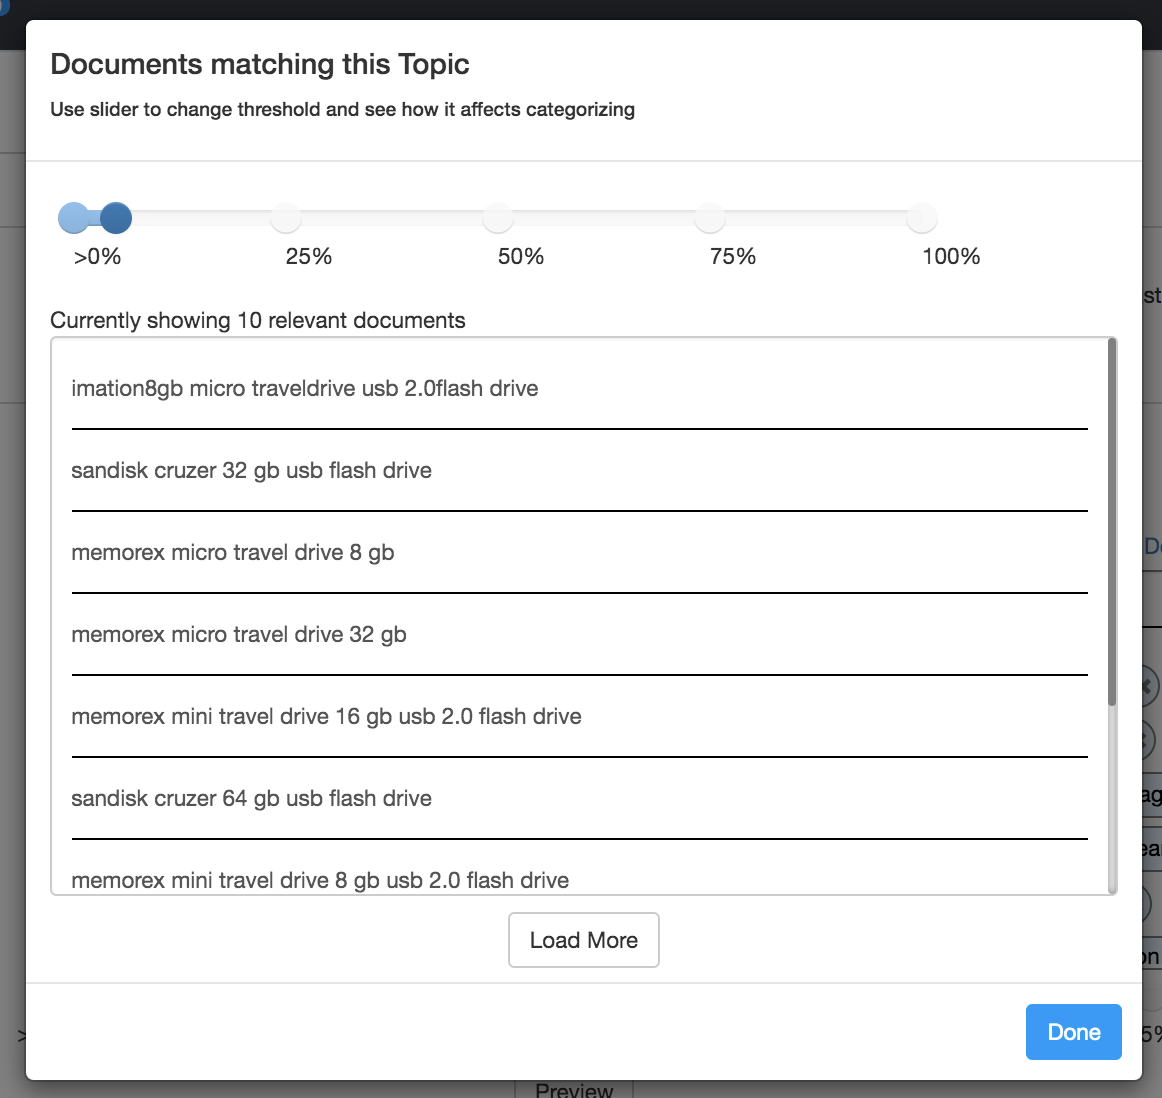 \
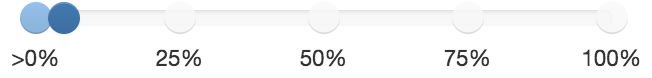
\ - Matching documents are determined by looking at the percentage of topic keywords that were found in a given document and comparing that percentage to a ‘pass’ threshold set in the configuration. If the % of matching keywords is greater than the defined threshold, the document is considered as a match for that topic. By default, the topic threshold is set to 5%. It can be changed to another % by adjusting the slider found at the bottom of each topic block. The match threshold slider is also accessible within the preview modal, as you will often want to see how the matching documents change in response to changing the % threshold. Setting a higher threshold will result in fewer matching documents, and after a certain threshold you may not have any remaining matches at all, so it is important to test your threshold within the preview modal to confirm the results of changing the threshold.\
 \
\
- For any topic cluster, you can preview the documents in your dataset that match the topic by clicking the ‘Preview’ button at the bottom right of a topic block. This will launch a modal that shows matching documents.\
Once you have finished configuring your topic cluster definitions, you can save your work and return to the Macro Builder by clicking ‘Complete Configuration’ at the top right of the configuration view.
Important:If you are running your Topic Clustering operation based on columns that have been altered by previous operations in the Macro, the changes to the values within those altered columns will not be reflected in the configuration. If you need to build your configuration based on the altered data values, you will need to configure your workflow as two separate macros, with the macro containing the Topic Clustering operation attached to the promoted output dataset from the first macro.