Dashboard - Adding WordClouds
Overview
As you’re building a dashboard, you may want to include a WordCloud in your presentation to help visually
summarize the frequency of words within free-form text data. Redbird’s Dashboard Builder allows you to easily
insert stylized WordClouds into your dashboard.
How it Works
To demonstrate how WordClouds work in Redbird, we are going to walk through an illustrative example using
dummy product data from a fictitious retailer.
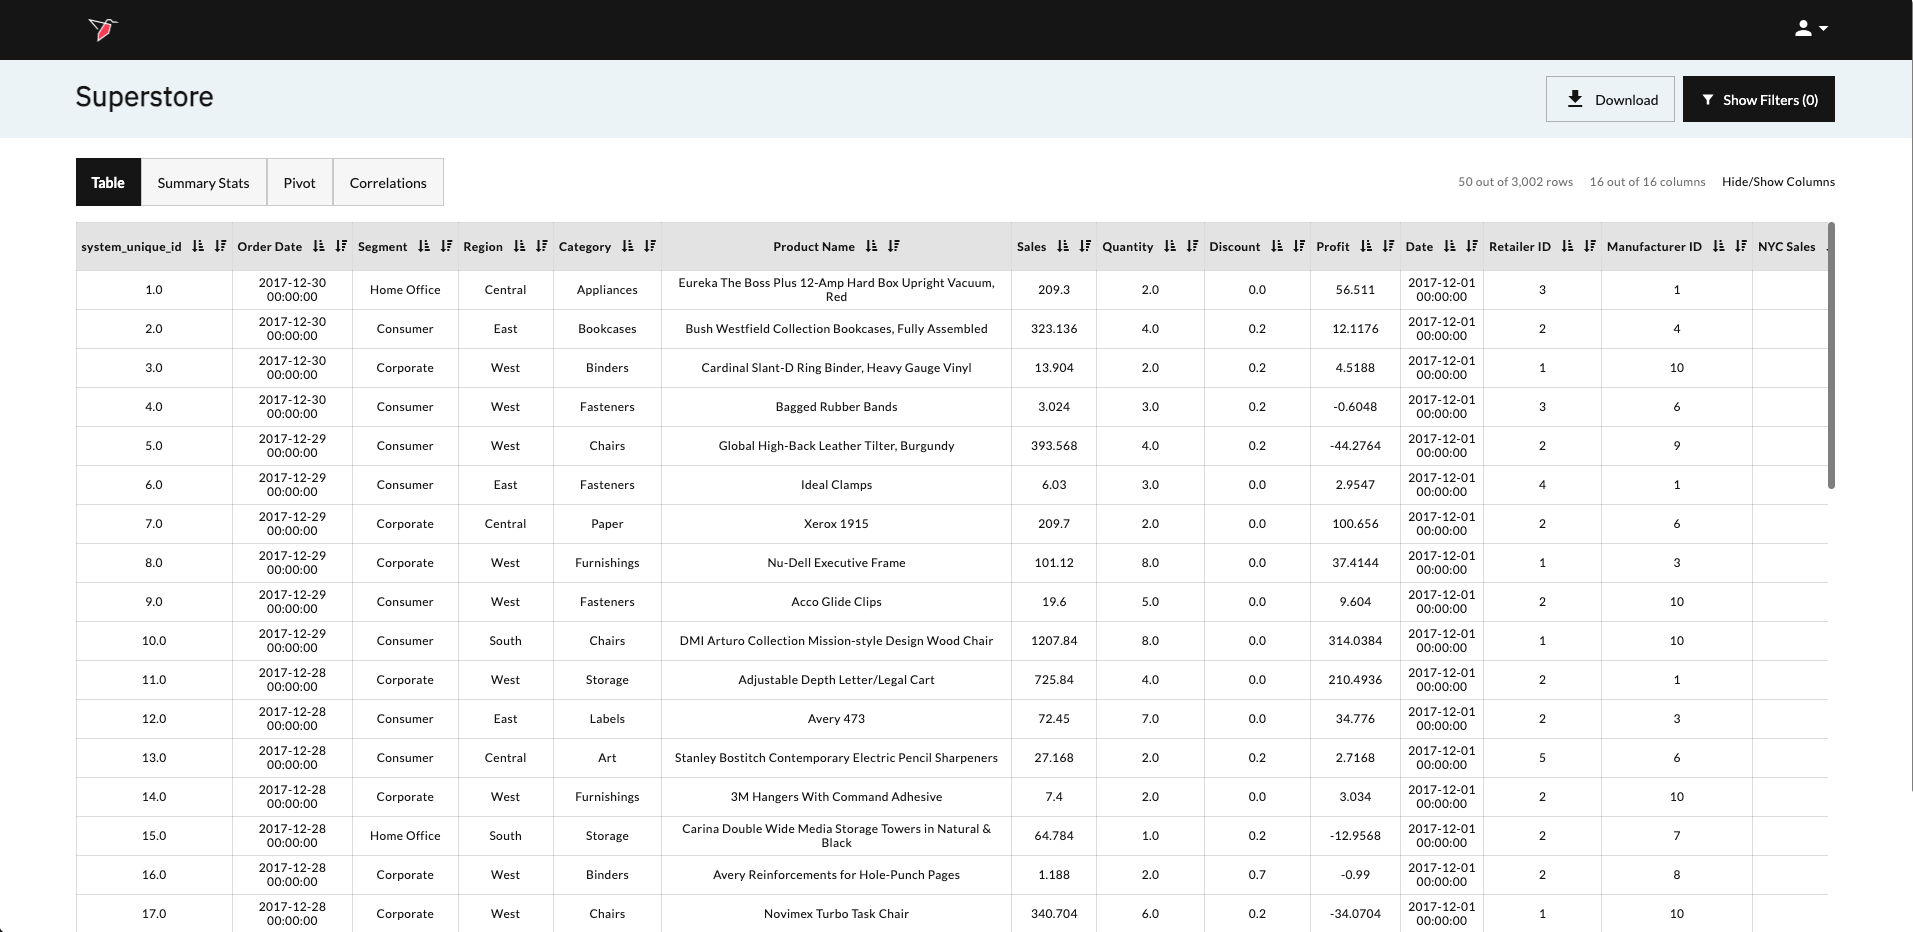
The dataset below was uploaded into the Redbird Platform and includes a free-form text column called Product
Name.
Using the dashboard builder, we will walk through a simple example to add a WordCloud visualization to our
dashboard that summarizes the frequency of words within the Product Name column.
Adding a WordCloud to Your Dashboard
Once you have identified the Dashboard and view you are interested in updating, follow the below steps to add
a WordCloud:
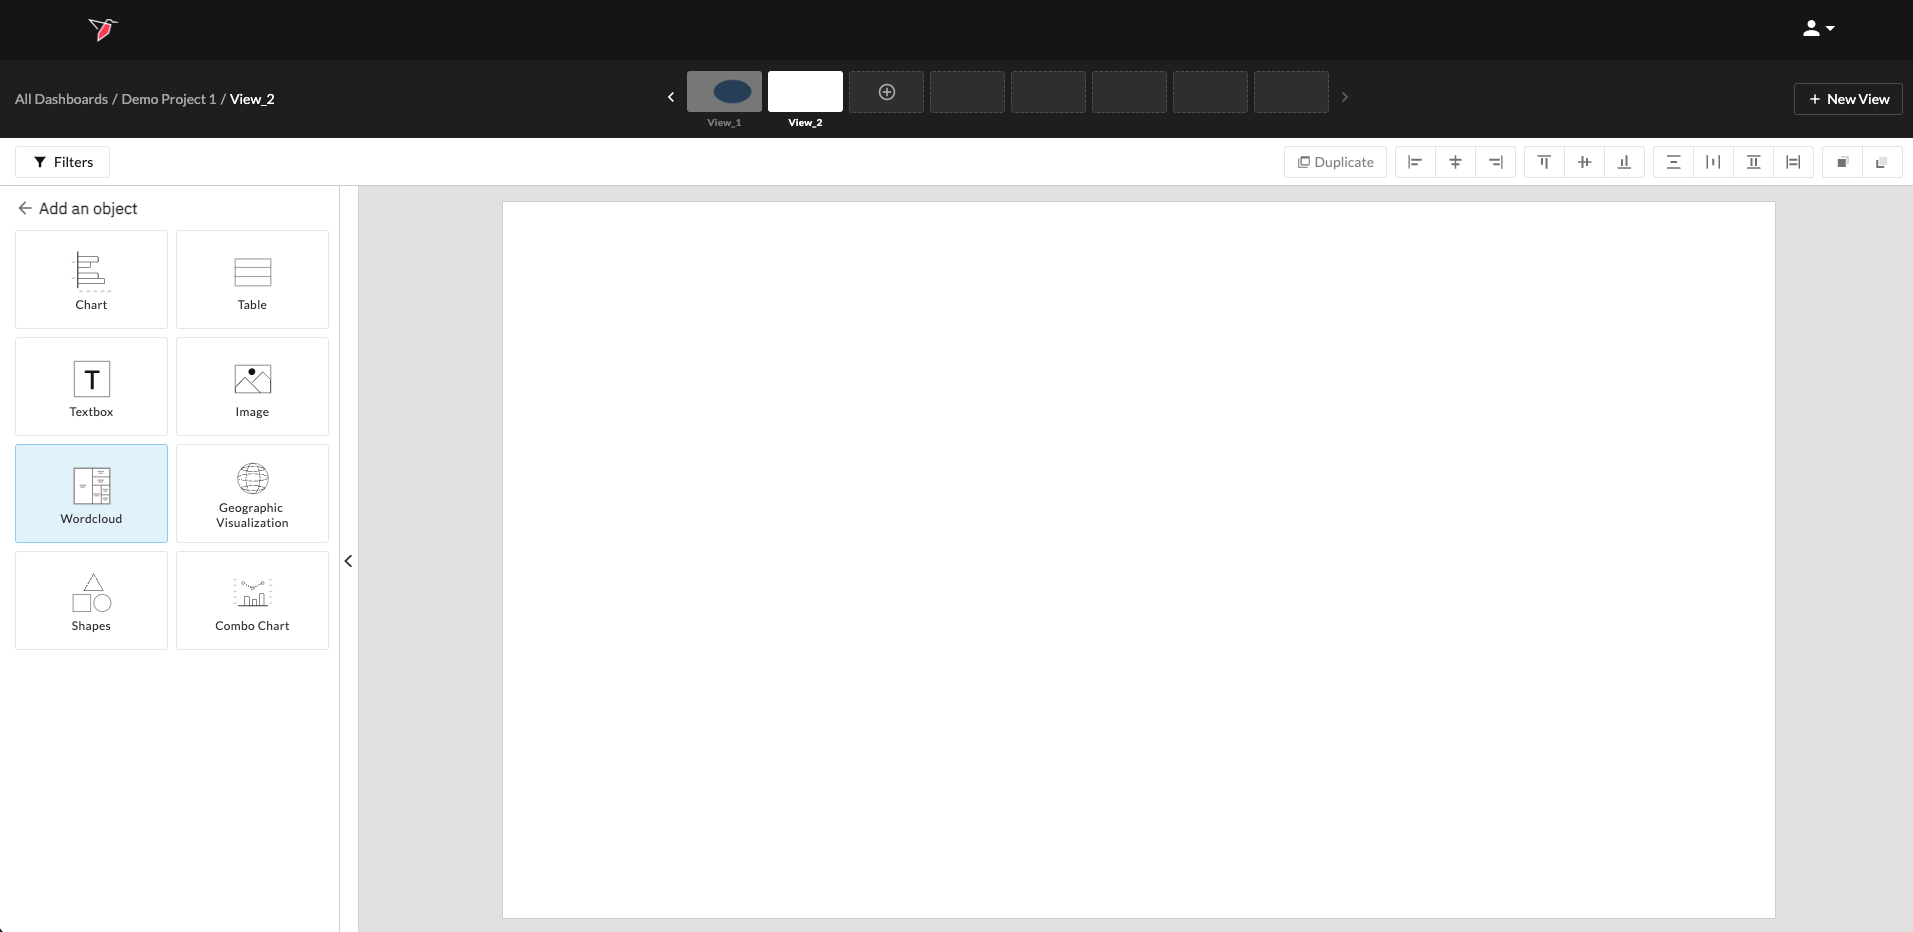
- Click Add Object in the Actions Panel to activate the Object Library.
- Click WordCloud in the Object Library.
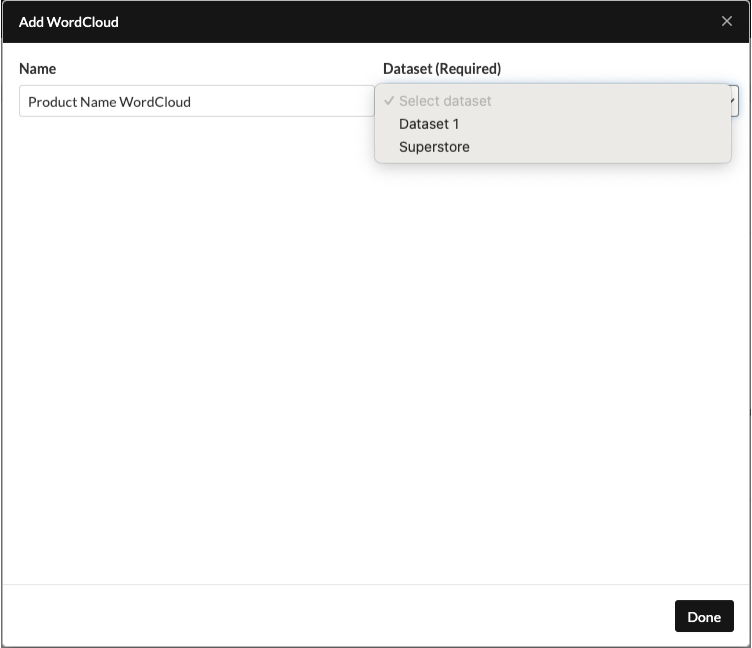
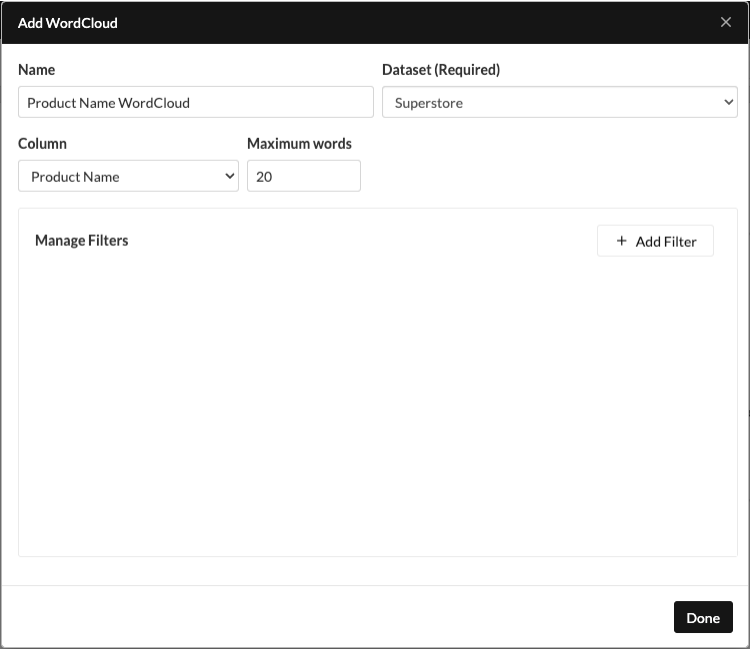
- Name your WordCloud and select the dataset you want to use to generate your WordCloud from within the Dataset dropdown field.
- Configure your WordCloud by selecting the column to use and setting the maximum number of words to display. Optional filters can be added using the Add Filter button. When you’re done, click Done to generate the WordCloud.\
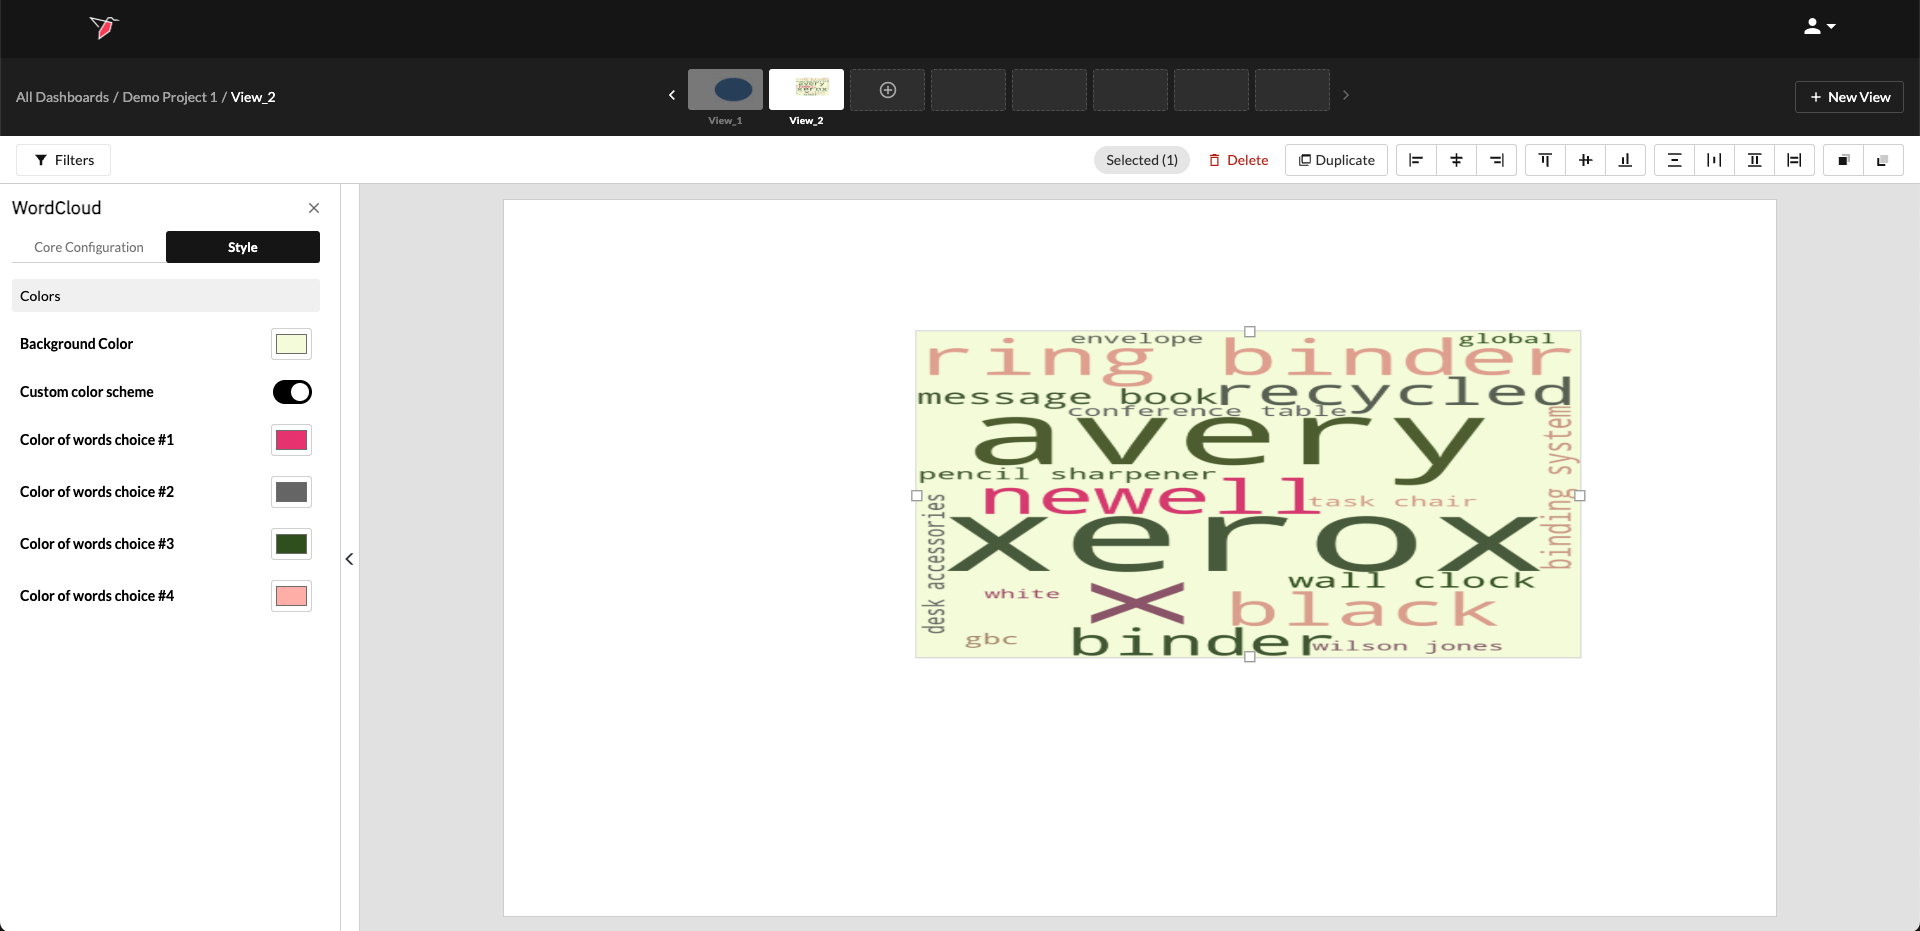
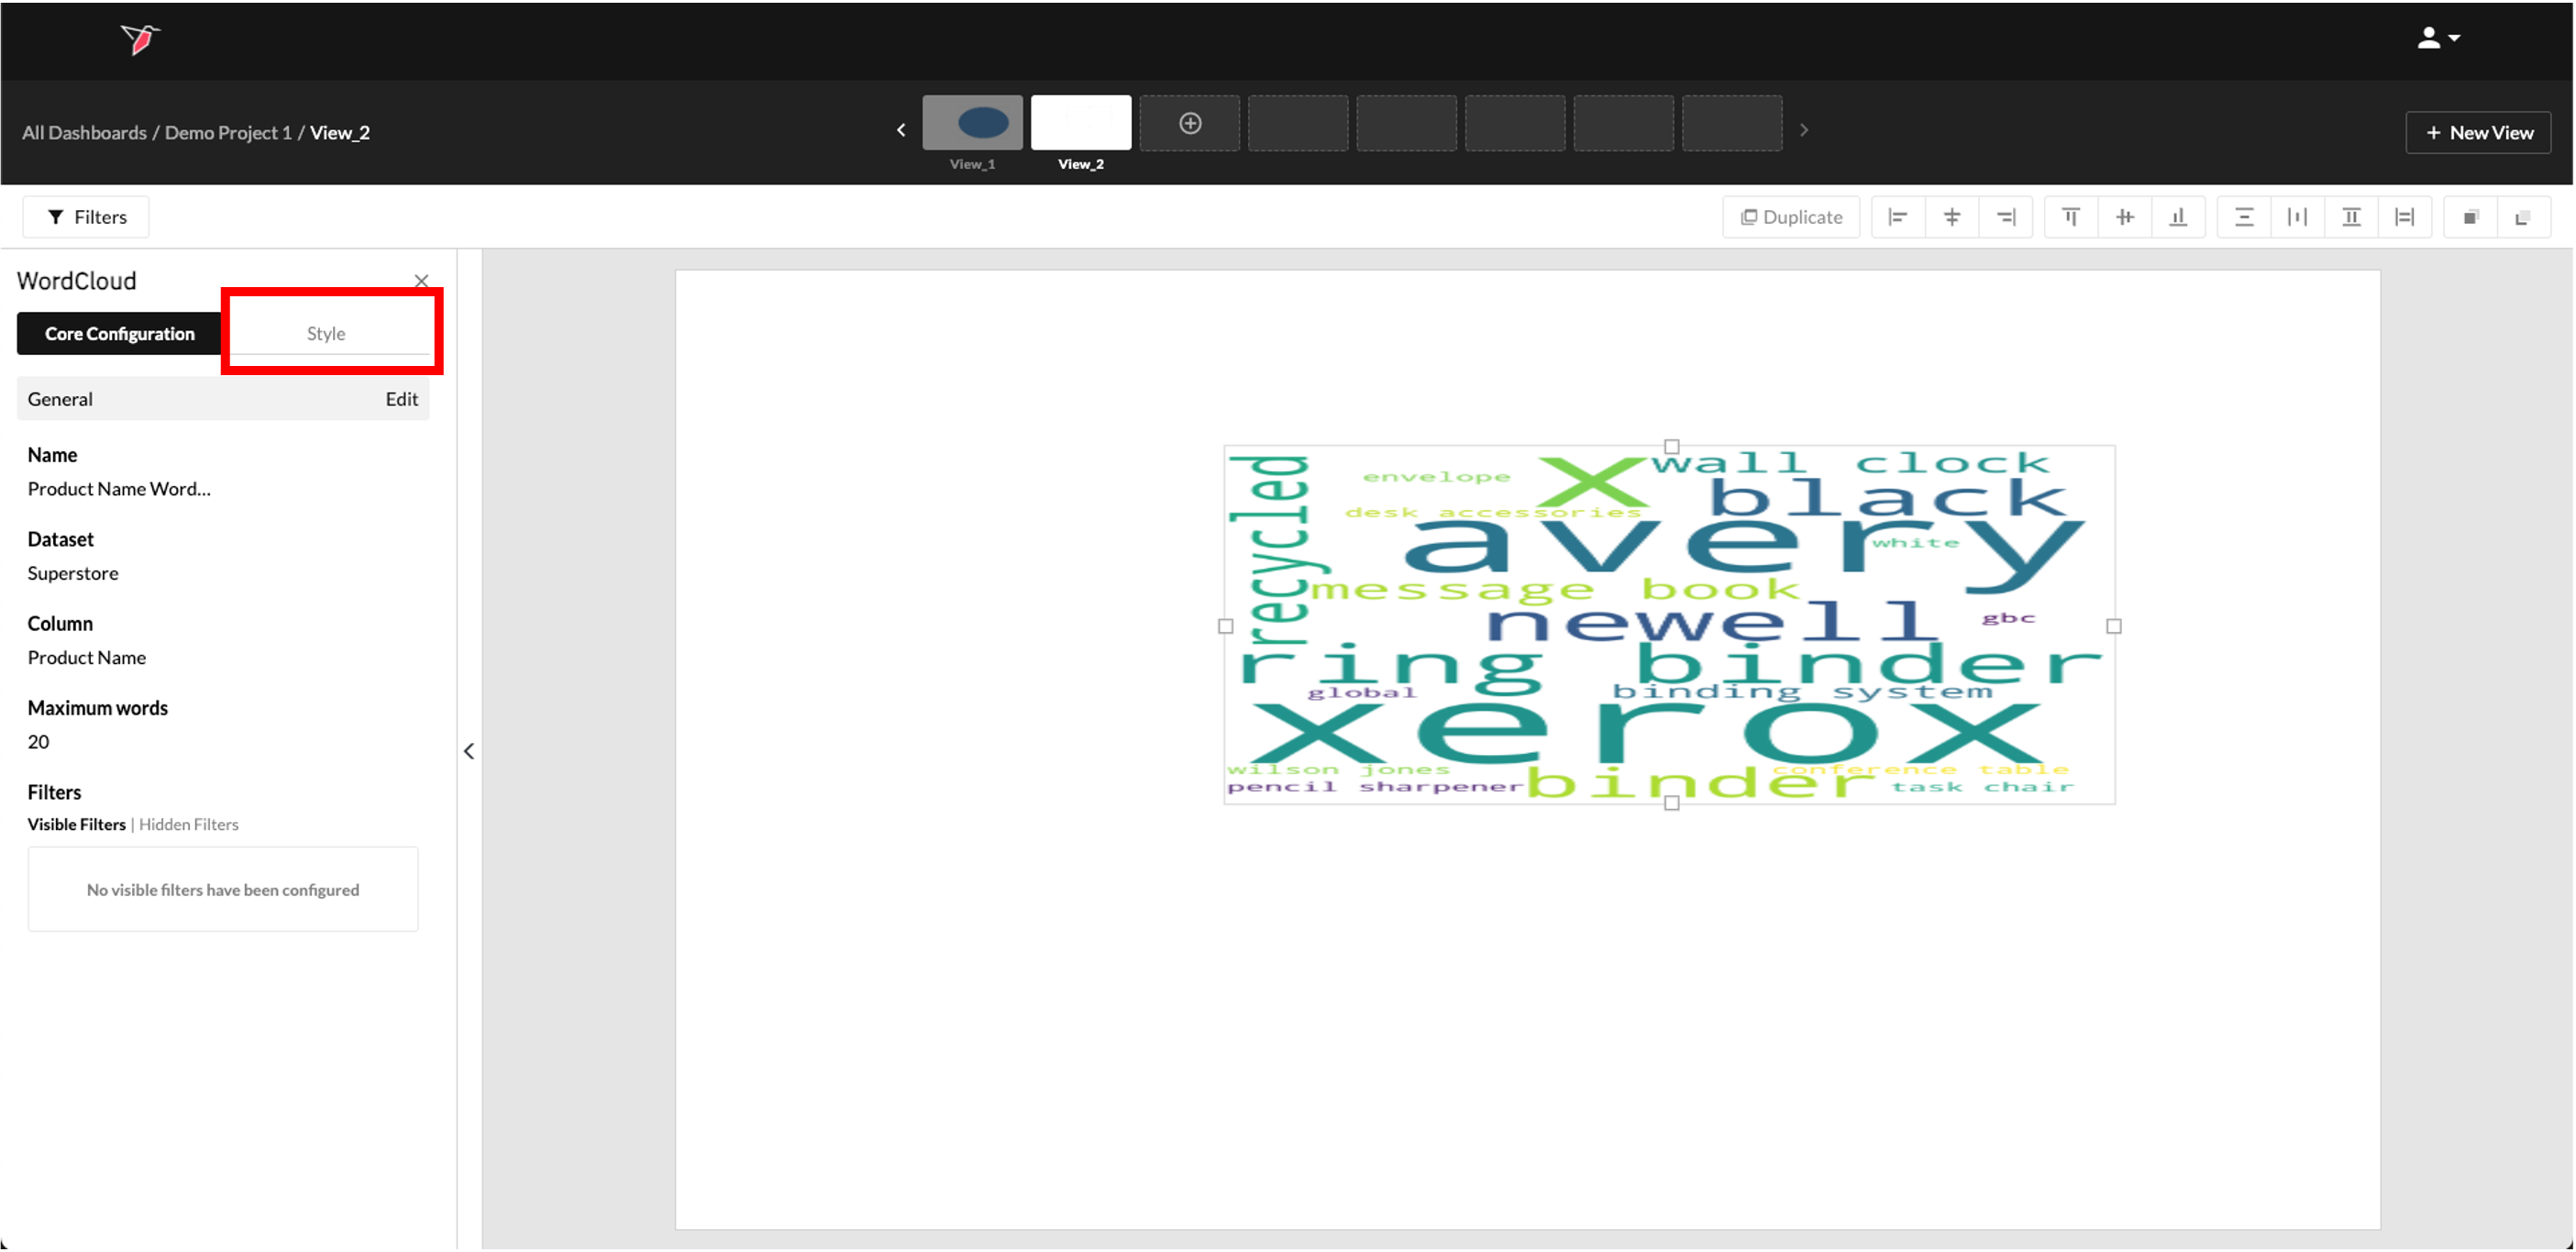
- Your WordCloud is now configured and will render on the page. To configure the Style of the WordCloud, first toggle to the Style section of the Actions panel.
- To customize the appearance, click the Background Color square to change the background. You can also enable Custom Color Scheme to select up to four colors for the words.