Dashboard - Geographic Visualization Chart
Background
You can visualize location-based data on a map using Redbird's Geographic Visualization (GeoViz) Chart.
There are two output map types to choose from:
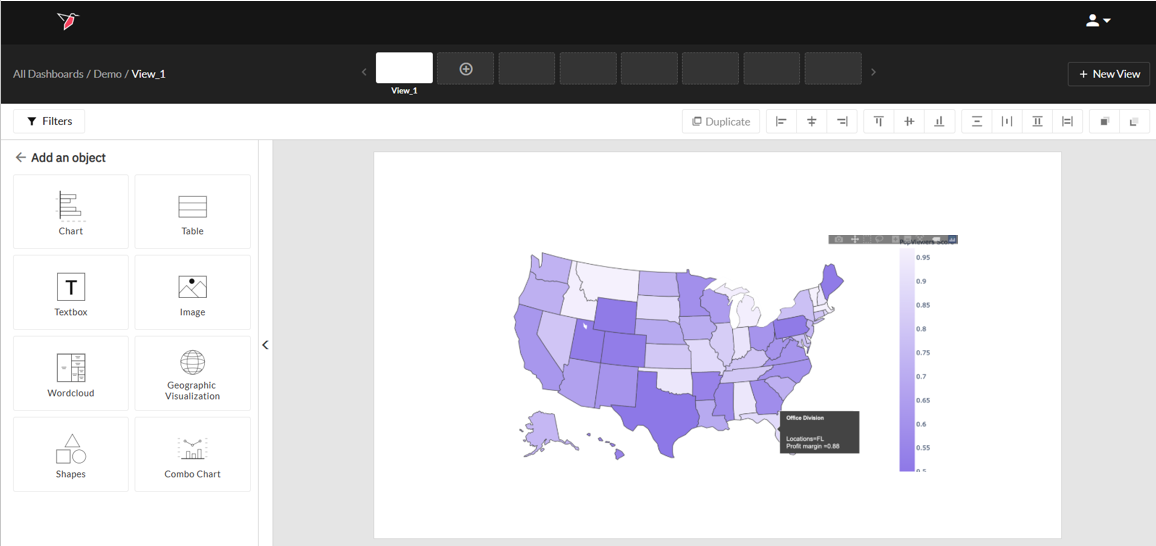
- Choropleth: A map that uses differences in coloring of predefined geographic areas to indicate the values of a property or quantity in those areas.
Example Choropleth output:\
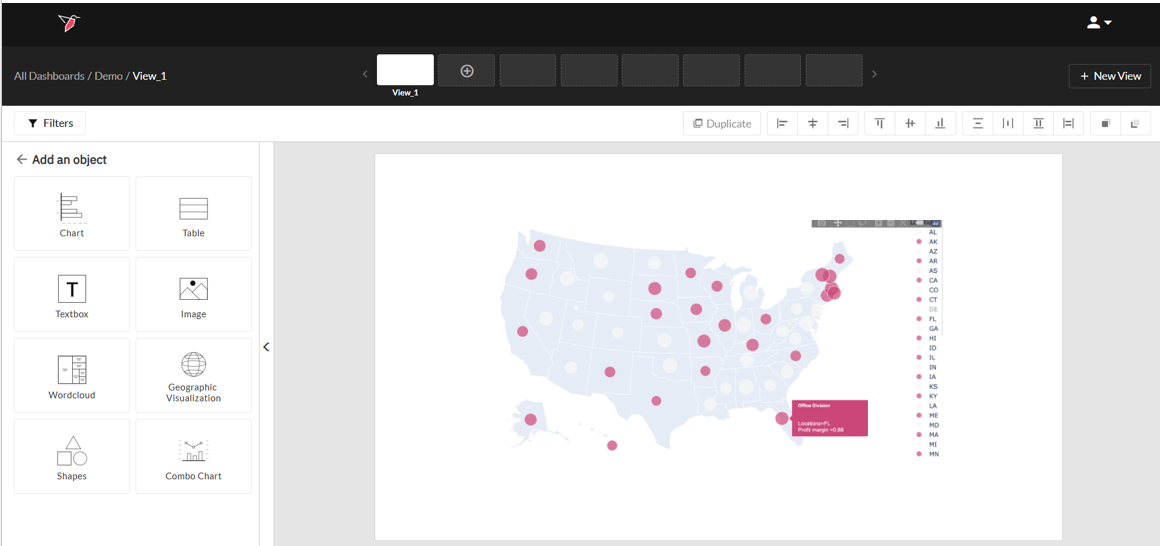
- Point map: A map that plots geographic data to visualize the location of data on a map
Example Point Map output:\
Requirements
The data you wish to visualize needs to be in number format.
You can visualize your data at different levels of geographic granularity including:
- Country/Region e.g. US
- State/Province (with an abbreviated version of state e.g. NY)
- County
- City
- ZIP/Postcode
The dataset needs to include the level of granularity you need to visualize, and any prior level as well e.g. to show the data at the county level, you will need a column to identify the county for each row of data, but also one that identifies State/Province.
Note:A "Country" column (with the two-letter country code assigned to each row in that column) is only required if you are looking to chart data for any country other than the US.
Configuring the Geographic Visualization Chart
Once your dataset is connected to the dashboard node, double click the view where you want to create a GeoViz chart. See our guides for generating datasets and building dashboards, if required. Then follow these steps:
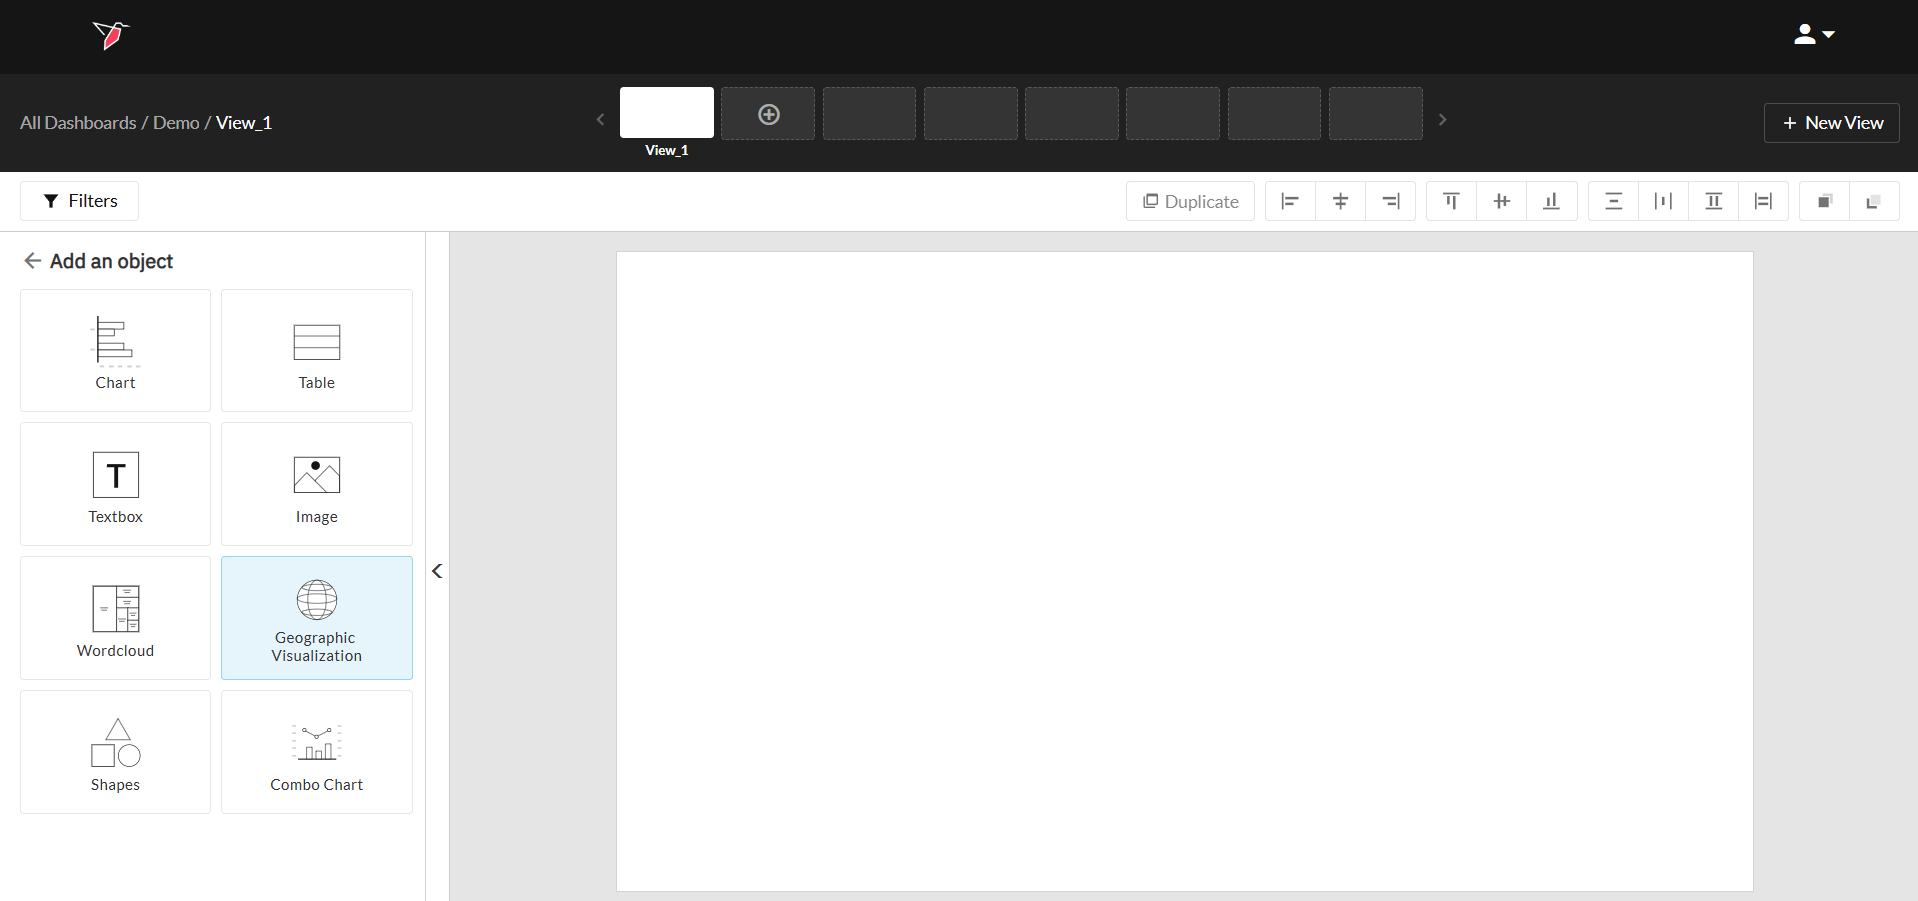
- Click on Add object then Geographic Visualization
- Select your dataset from the drop down and map granularity. Based on the selected granularity, you'll be prompted to select the columns in your data that correspond to it.
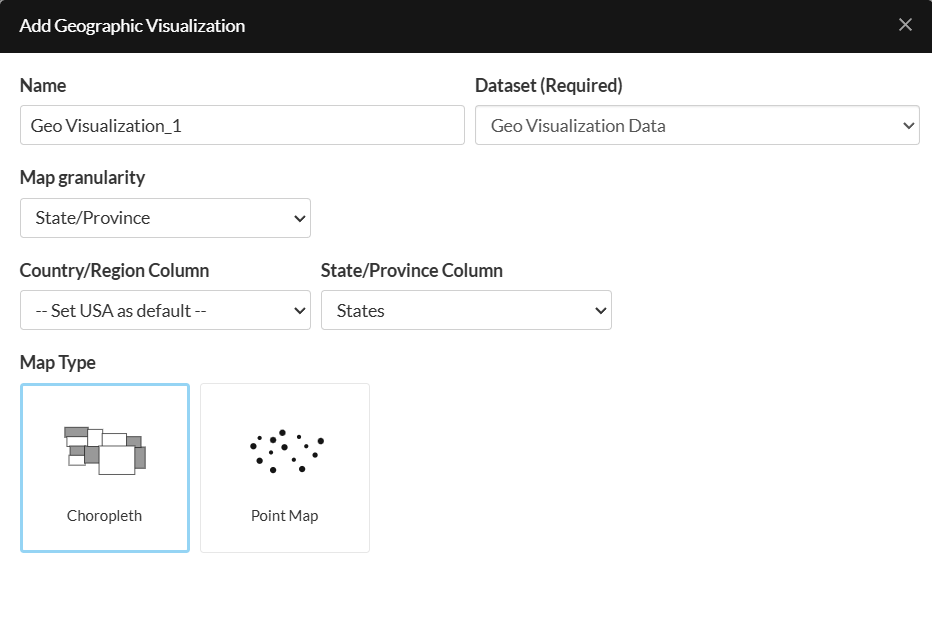
Required fields are yellow when you add an object to the canvas to alert users that it needs to be configured for the object to render.
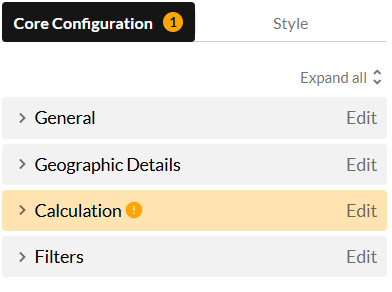
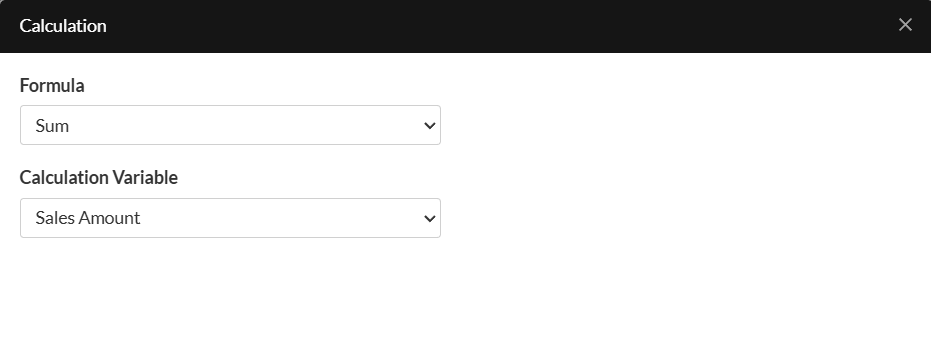
- Click Edit next to the Calculation dropdown to configure the formula that Redbird should use to render your geographic visulization
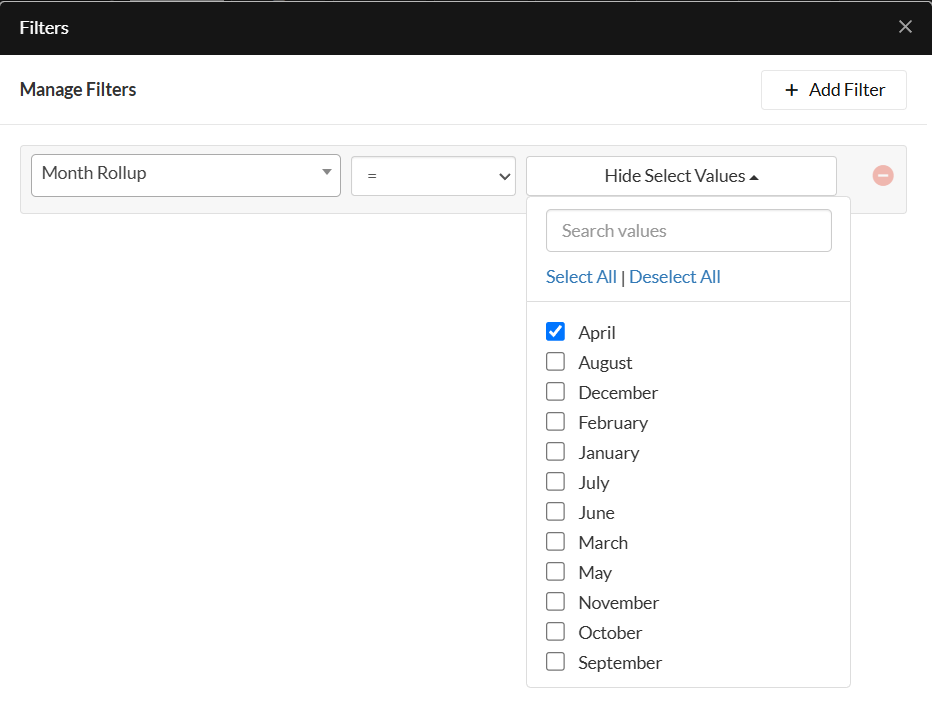
- Add one or more filters if required, by clicking Edit on the Filters dropdown, then selecting the column, operator, and value.
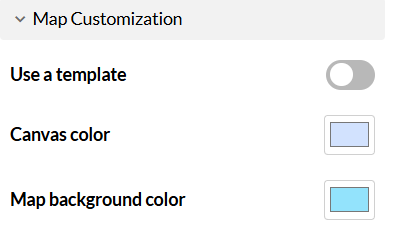
- In the Actions Panel click on Style, to configure a color for the canvas and map background. To use a pre-defined template, leave the Use a Template checkbox selected and choose between Default, Bright Theme, or Dark Theme in the drop-down.
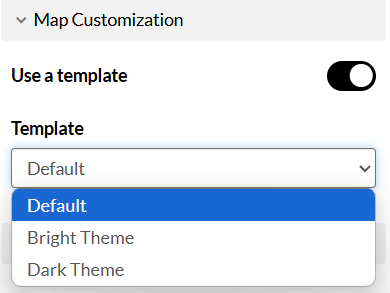
If you want to customize it with your own colors, turn off the toggle, select your canvas color, and map the background color from the color pickers.
- If you would like to include a legend, expand the dropdown next to Legend and turn on the toggle next to Show legend . This will use the default colors of purple and yellow and show the results on a gradient of these two colors (see example output below).
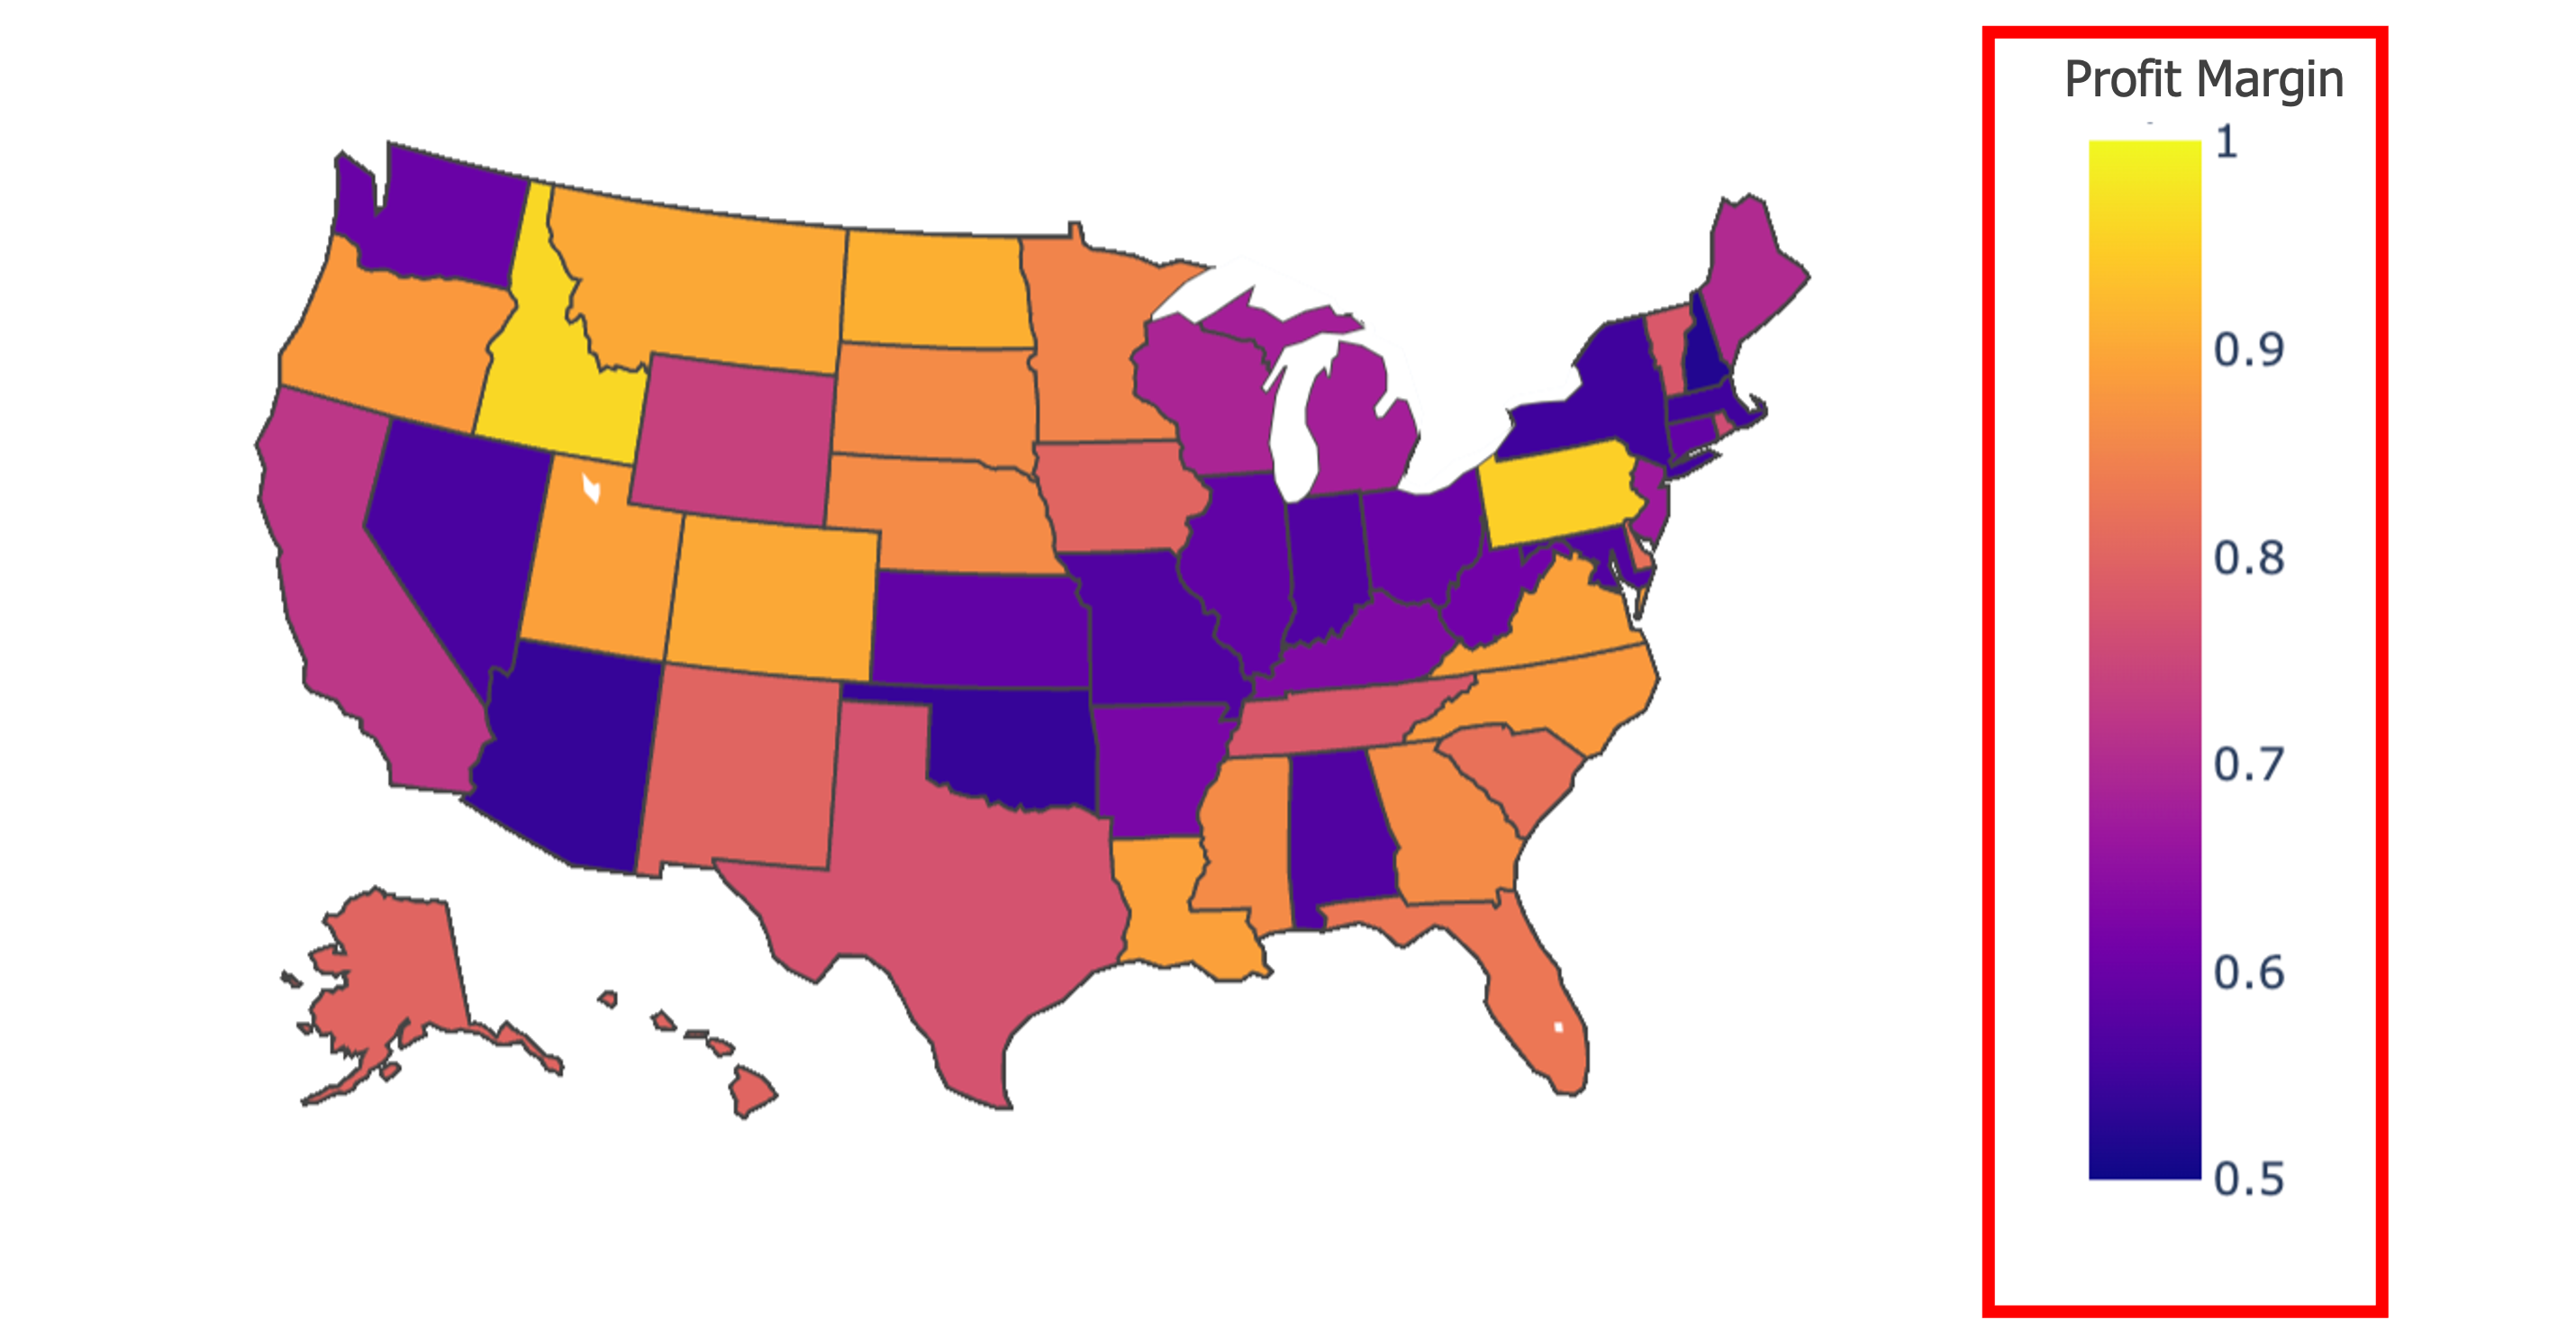
Alternatively, you can customize the color gradient scale by turning on the toggle next to Use custom colors and selecting Highest Value and Lowest value colors from the respective color pickers.