Column Grouping
Background
Often, in a dataset, data pertaining to a variable (such as a particular metric or question in a questionnaire) are split across multiple columns, with each column providing information for one value within the variable. For example, in the case of survey data, you may have the following multiple-choice question:
Which of the following brands are you aware of?
(Please select all that apply)
Brand A
Brand B
Brand C
Brand D
Brand E
The responses to this question (variable) would most likely appear as follows, with each row representing a respondent, and each column representing the respondent’s response to each value for that question in a binary format. In this example, you can see Brand Awareness for each brand in the competitive set, denoted as 1 if the respondent selected that answer and 0 if they didn’t.
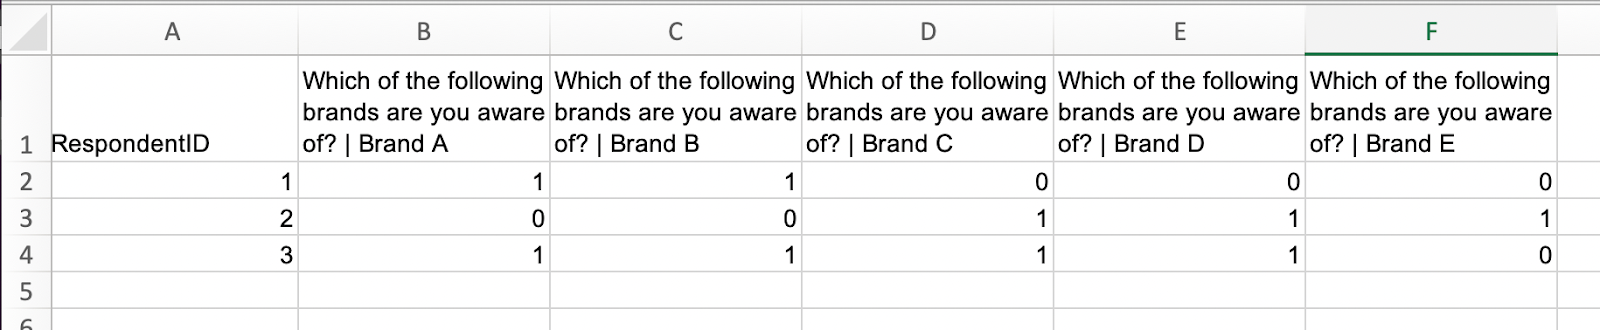
This can make the dataset difficult to work with, especially with certain operations or analysis such as pivot tables, or charts which typically require you to choose one column to analyze or display as a series.
Note:This article primarily talks about binary Column Groups (i.e. grouping together columns that are in a Binary data format), as this is the typical use case. For the specific use case of text Column Groups (e.g when each value in the cell of a column is a unit on a scale rather than 1 or 0) see the 'Using Column Groups for Columns in Text Data format' section at the end of this article.
You should assign the correct data type for each column in your data when generating your dataset. See the Redbird Datasets Guide for more information.
How Column Groups Work
Redbird’s Column Groups function solves this issue. Creating Column Groups allows you to group together multiple columns which all relate to one variable. This new ‘grouped column’ can be used throughout Redbird to analyze or display all the results from one variable in one place. In essence, you are able to interact with this multi-dimensional data just as you would data from a variable that is naturally represented in a single binary column.
Note:The calculation is stored as a virtual column (which points to each relevant column ‘behind the scenes’), so it won’t be displayed when exploring or downloading the data set.
The old columns are still preserved in case you wish to use any of them individually. Using the example above, you may also wish to chart the Awareness of just Brand A in isolation, and so would use the original standard column for that calculation.
Creating Column Groups
Column Groups can be assigned once you have created a dataset. To do this:
- Navigate to the Workflow Canvas that contains your dataset and click on the node to bring up the right-side panel. Click Column Groups.
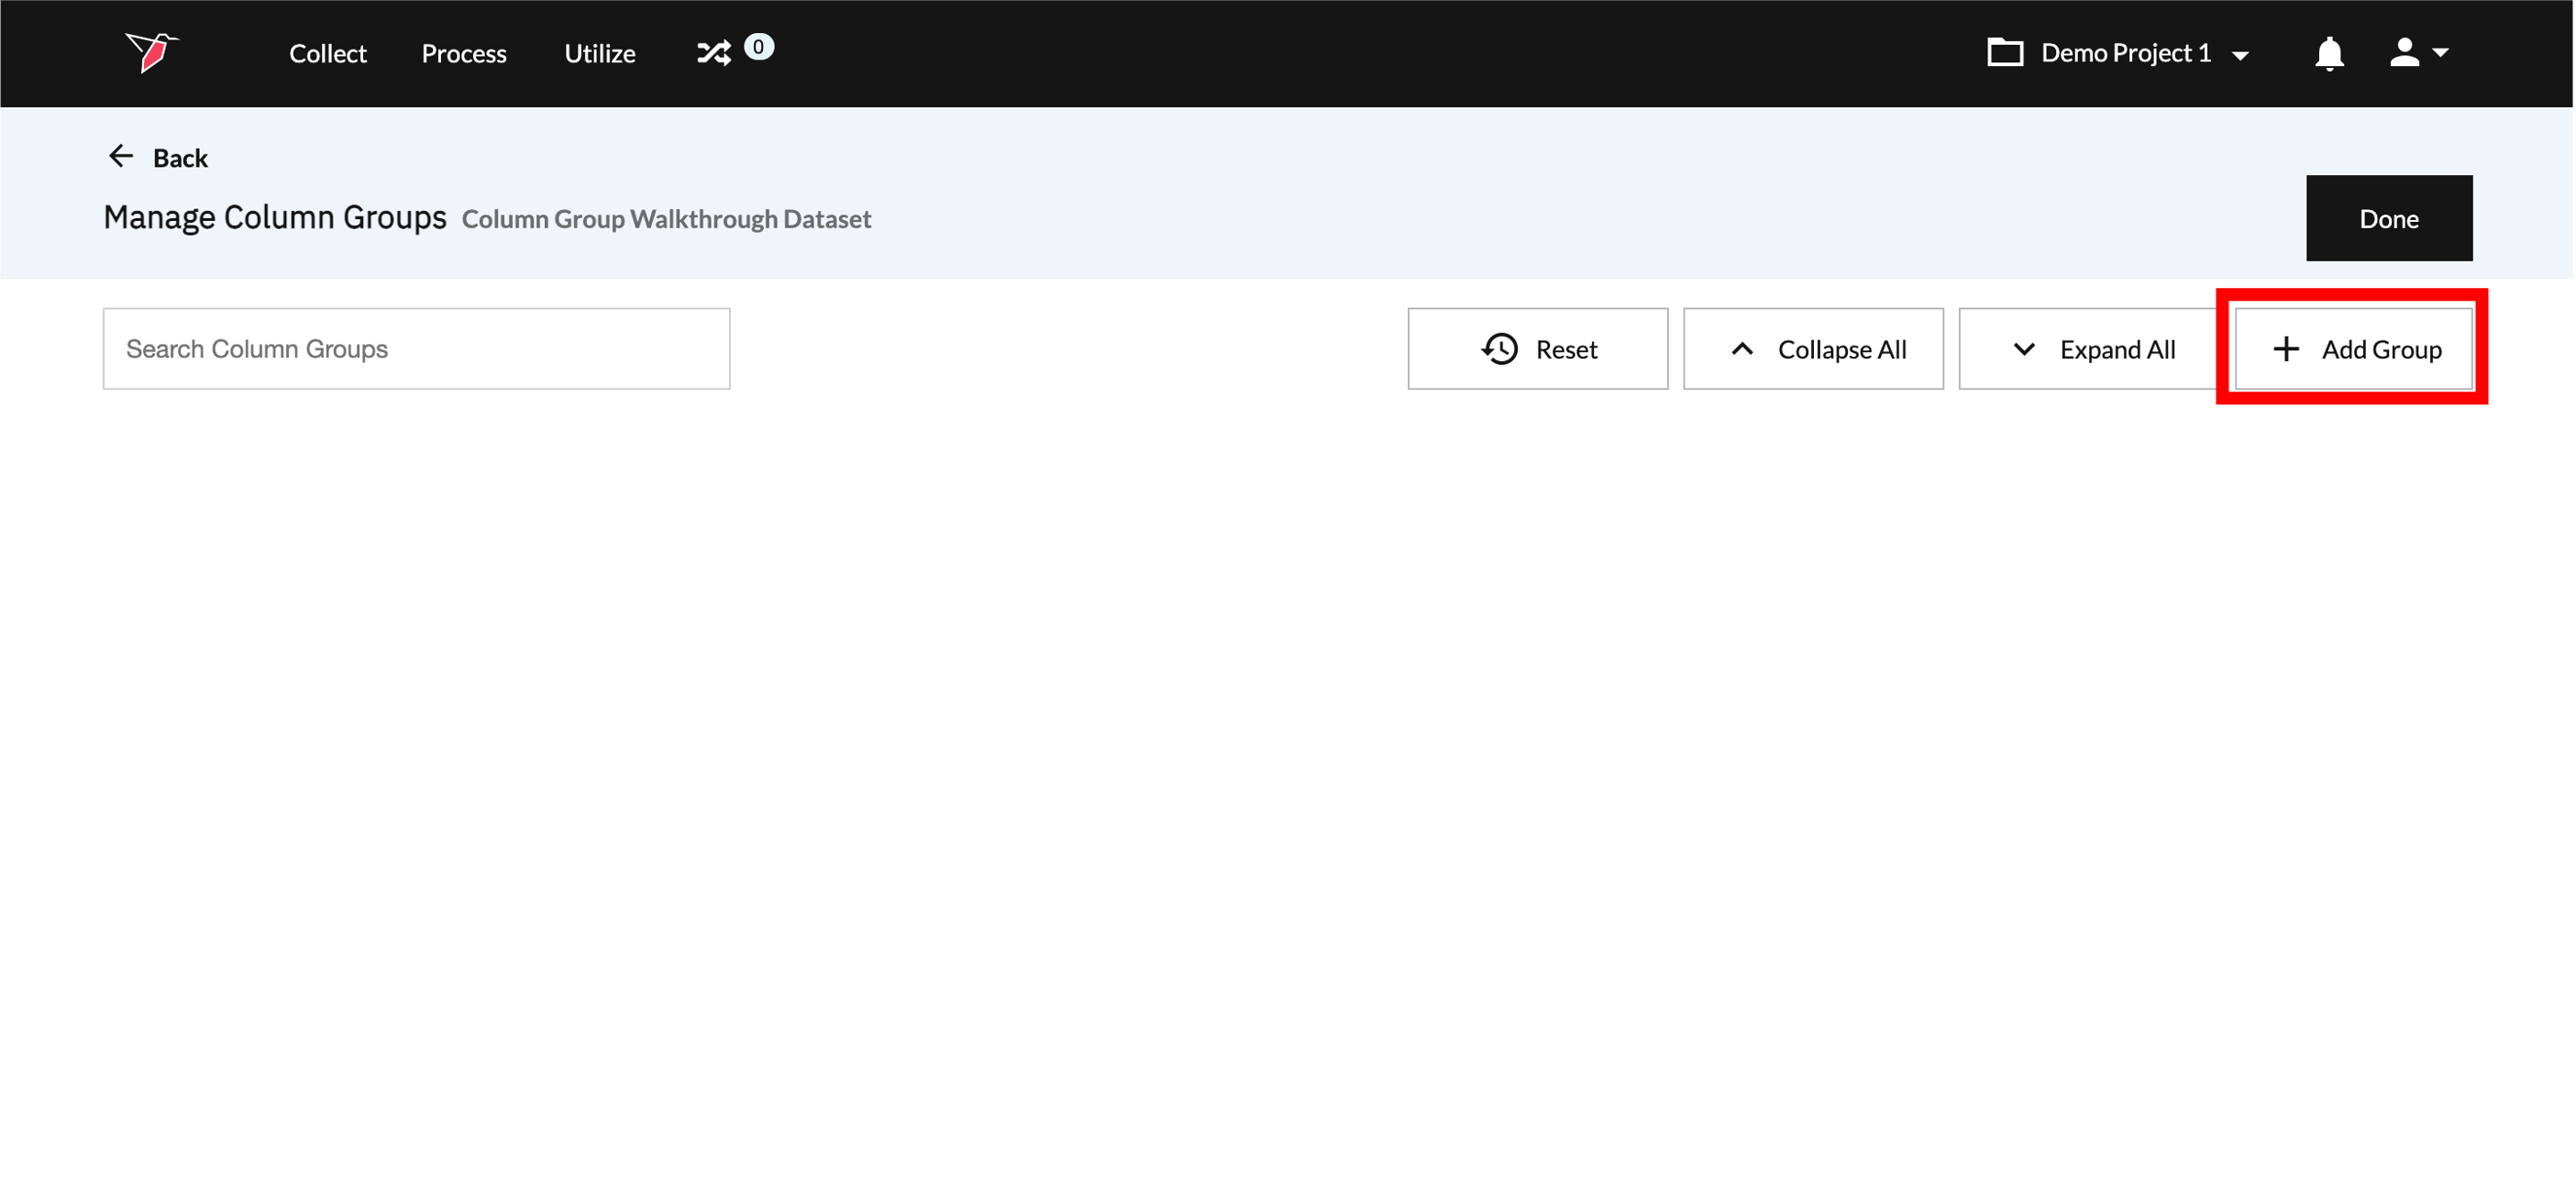
- This takes you to the Manage Column Groups page, where you can configure your Column Groups. Click Add Group
- A new column group will appear, labeled Column Group and a sequential number (e.g. Column Group 1). Click on the pencil icon next to the Column Group label then type in a name for the Column Group.
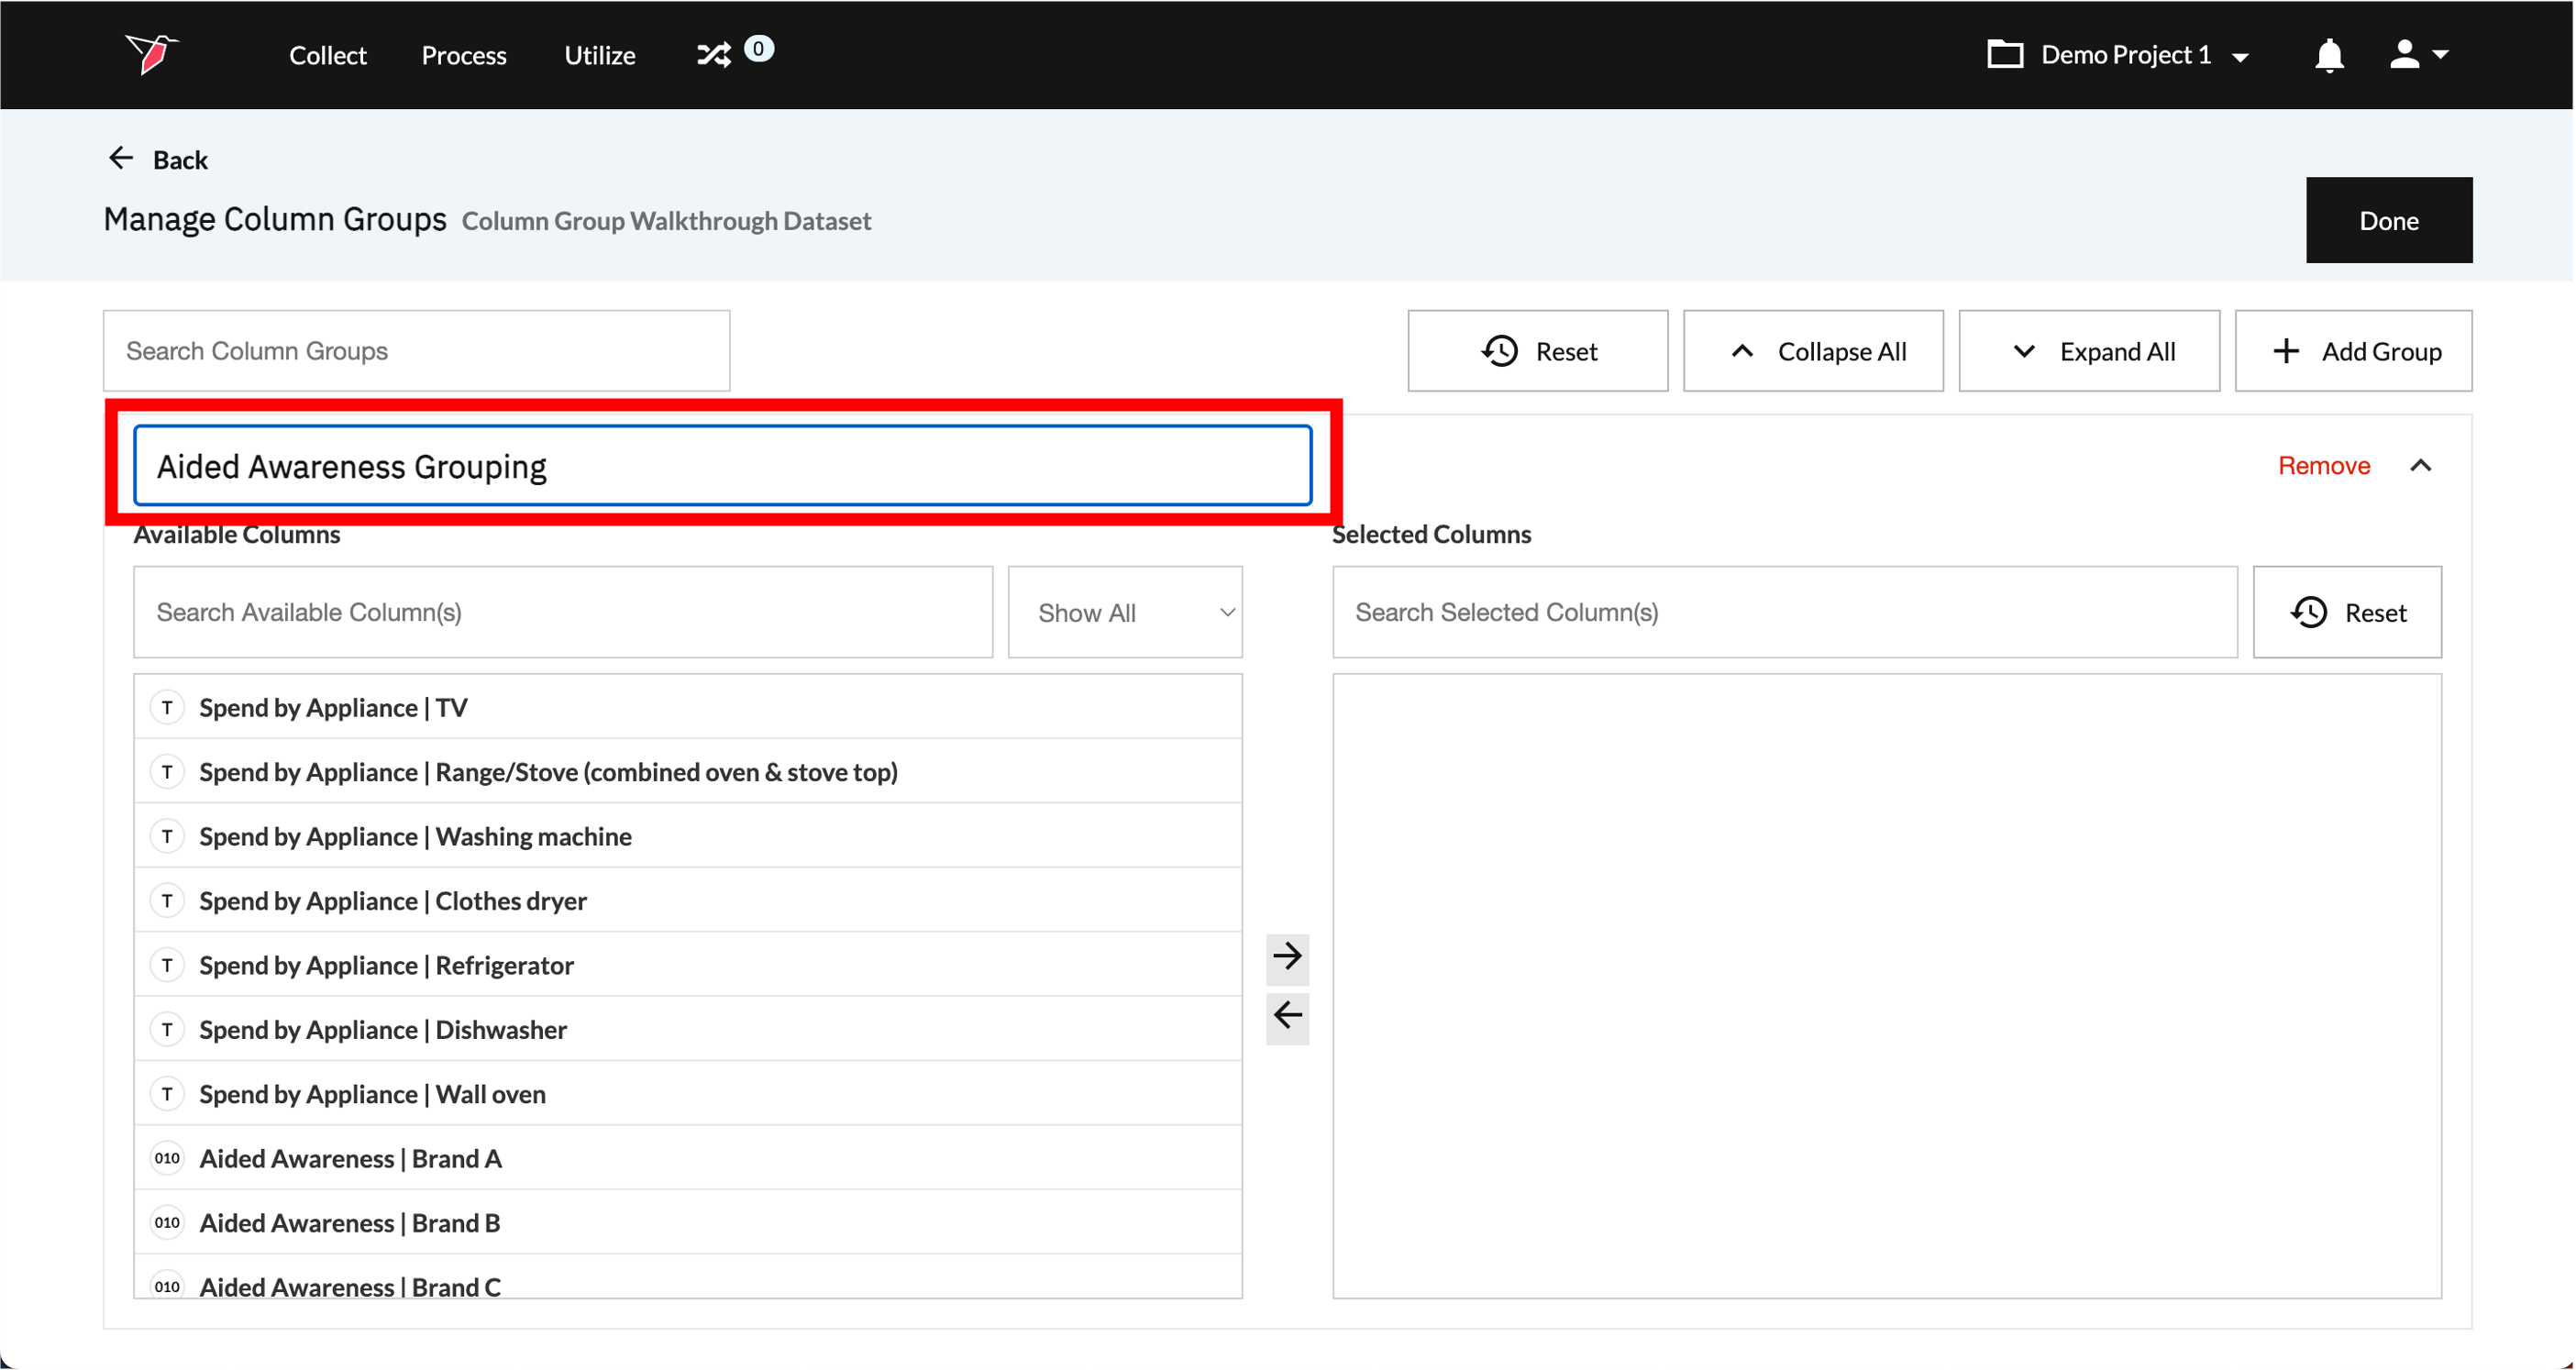
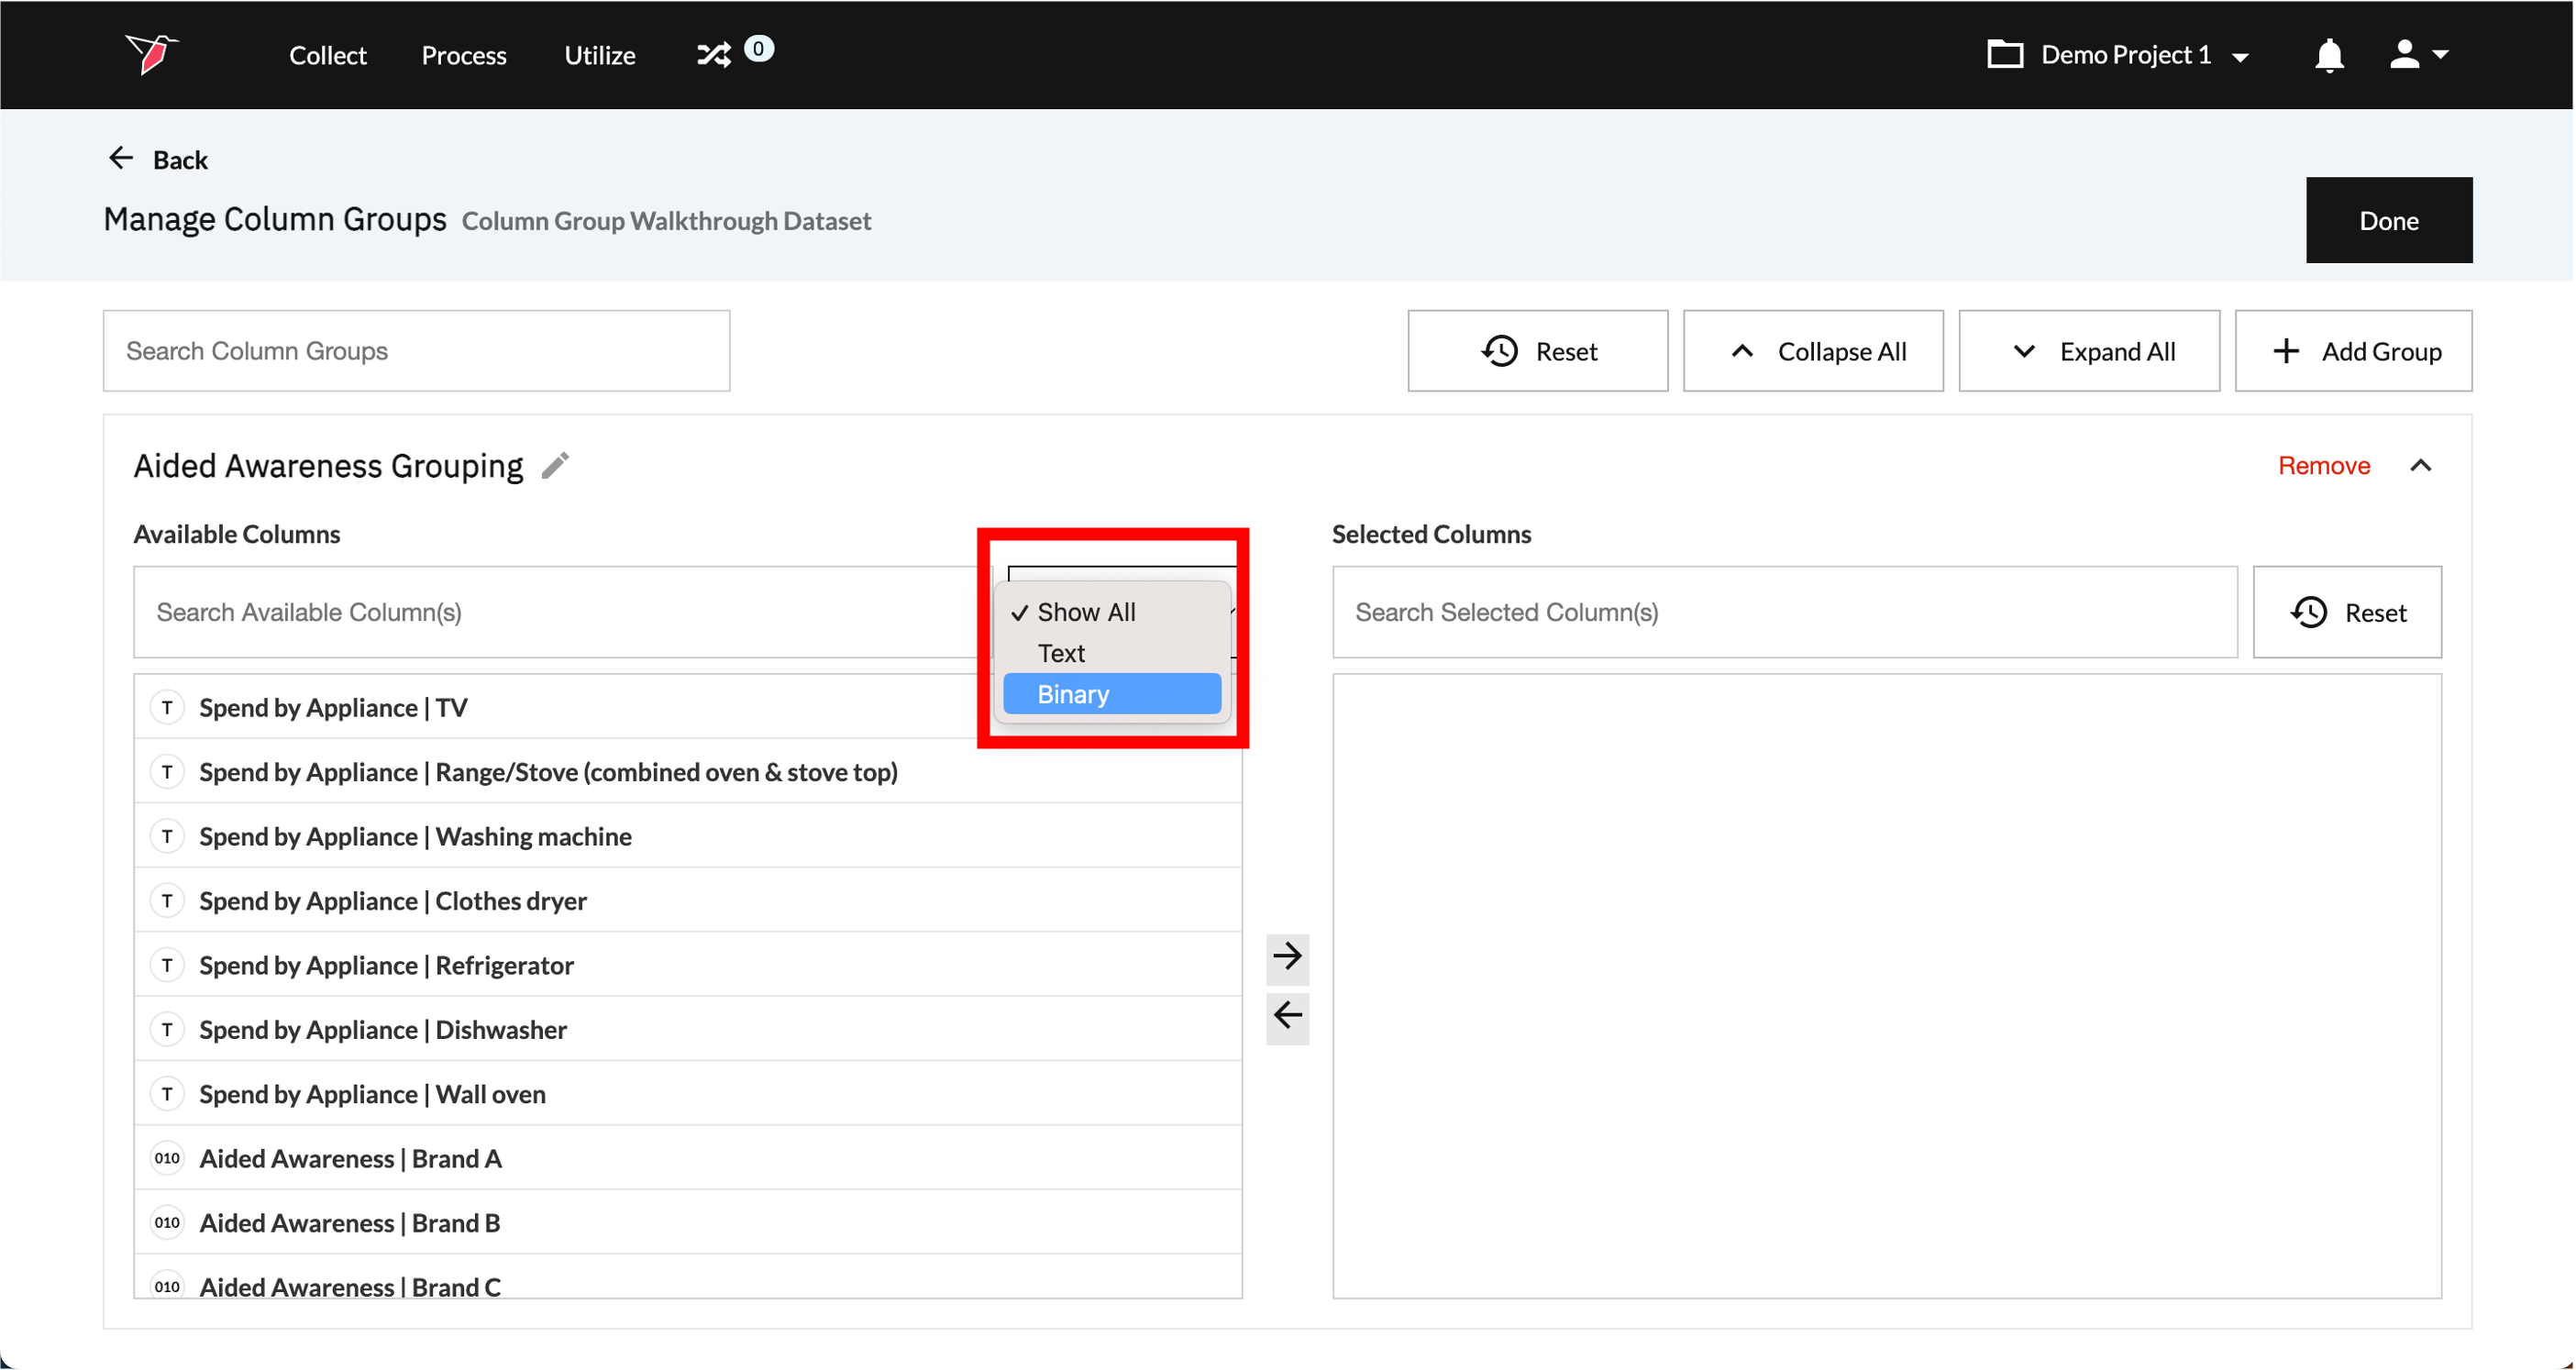
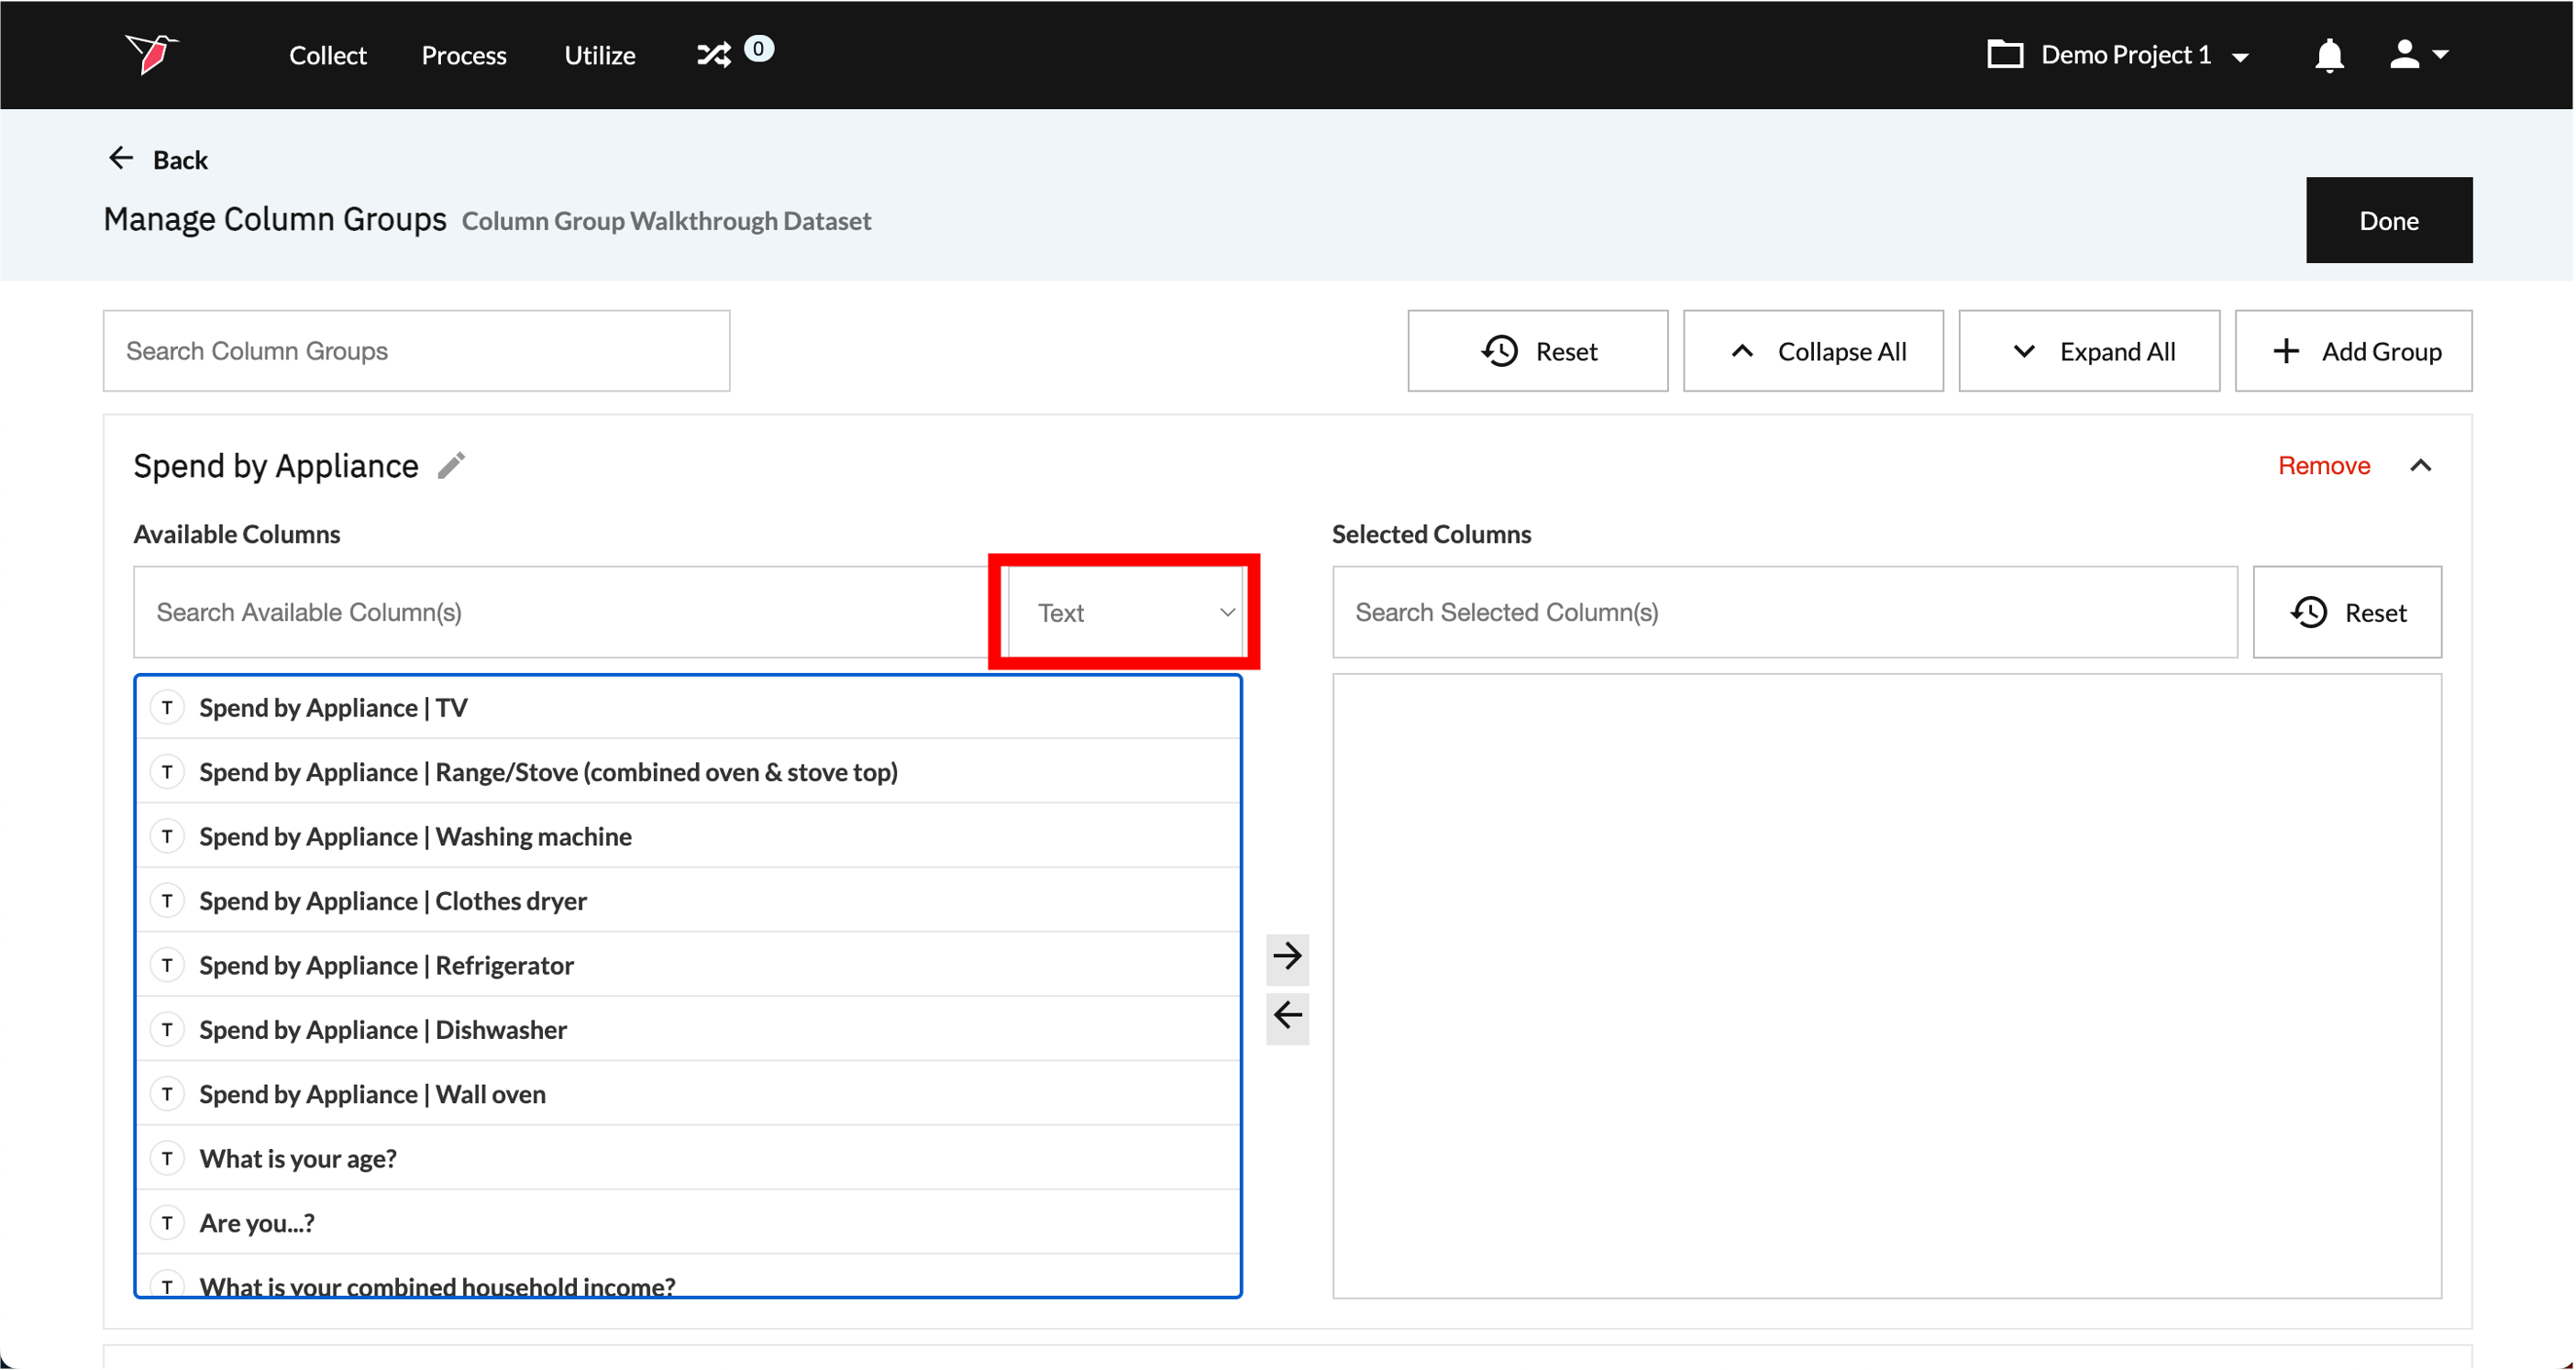
- The Available Columns selection box on left will show all the binary (denoted by the "010" icon) and text (denoted by the "T" icon) format columns in the dataset, regardless if they have been used already for other Column Groups. In this case, as we are looking to group only binary columns, we can filter on these by selecting Binary from the column data type drop-down.
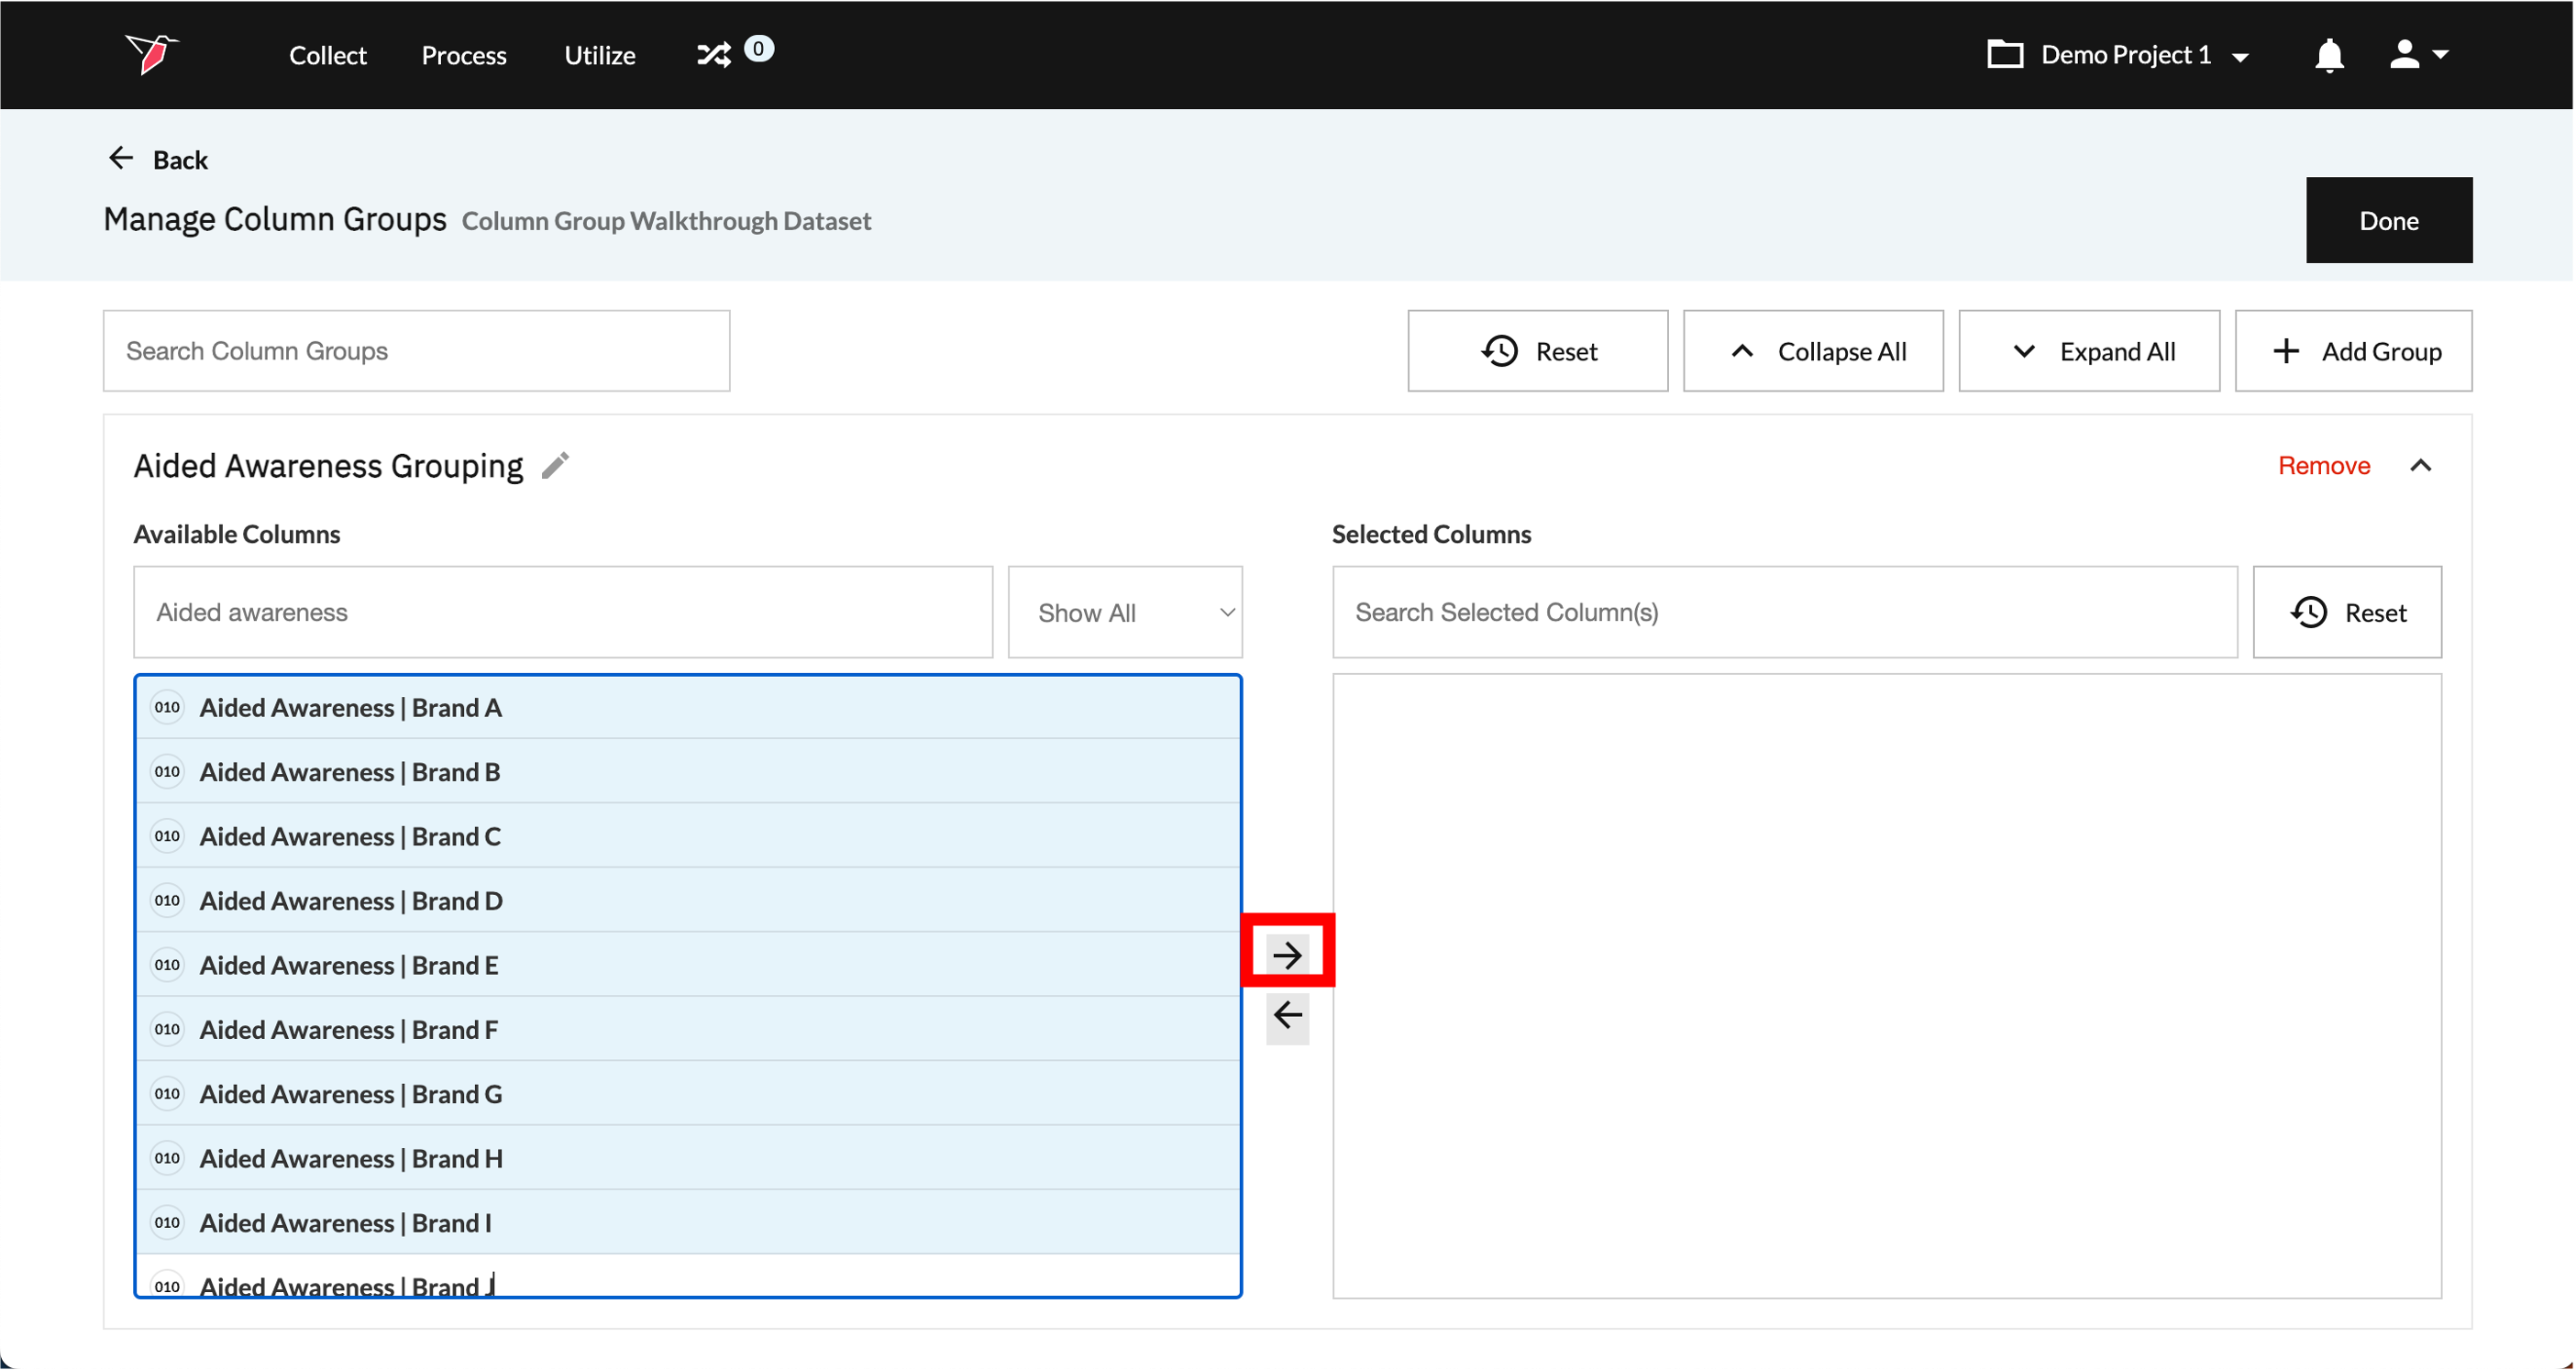
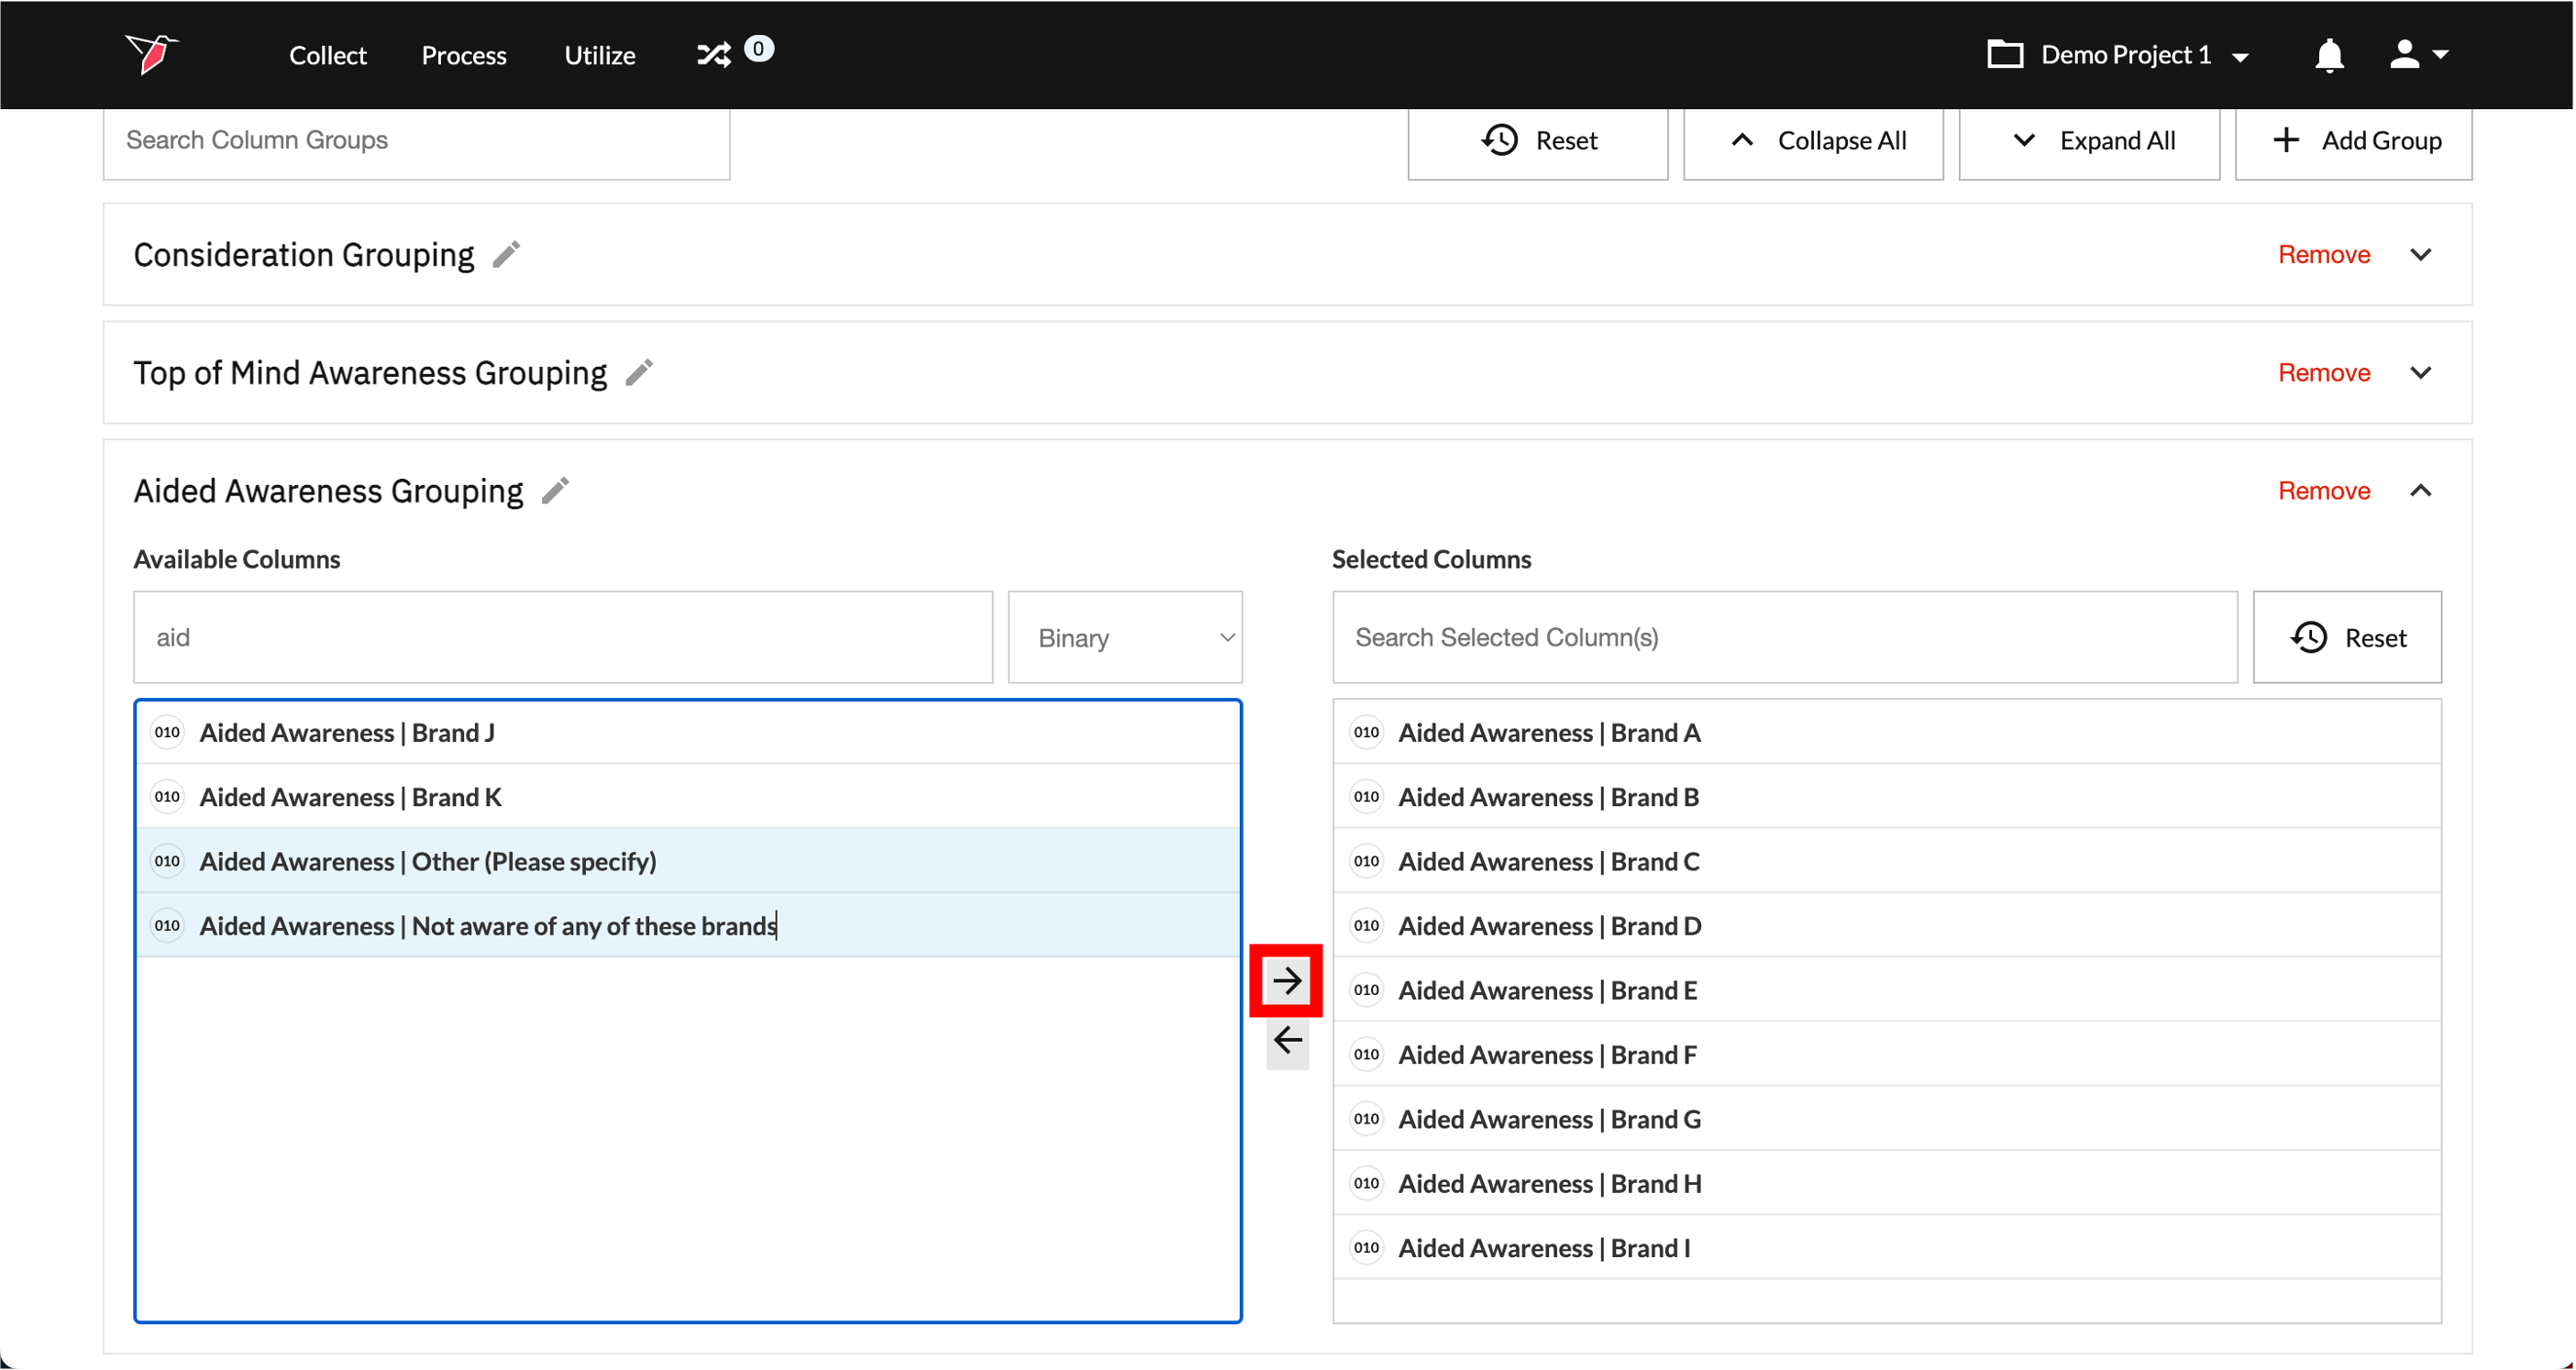
- Select the columns from Available Columns that you wish to group by scrolling or using the search function (if needed, use control/command + A to select all columns at once), then click the right arrow to move them over to Selected Columns. To return any columns, select them in Selected Columns and click the left arrow.
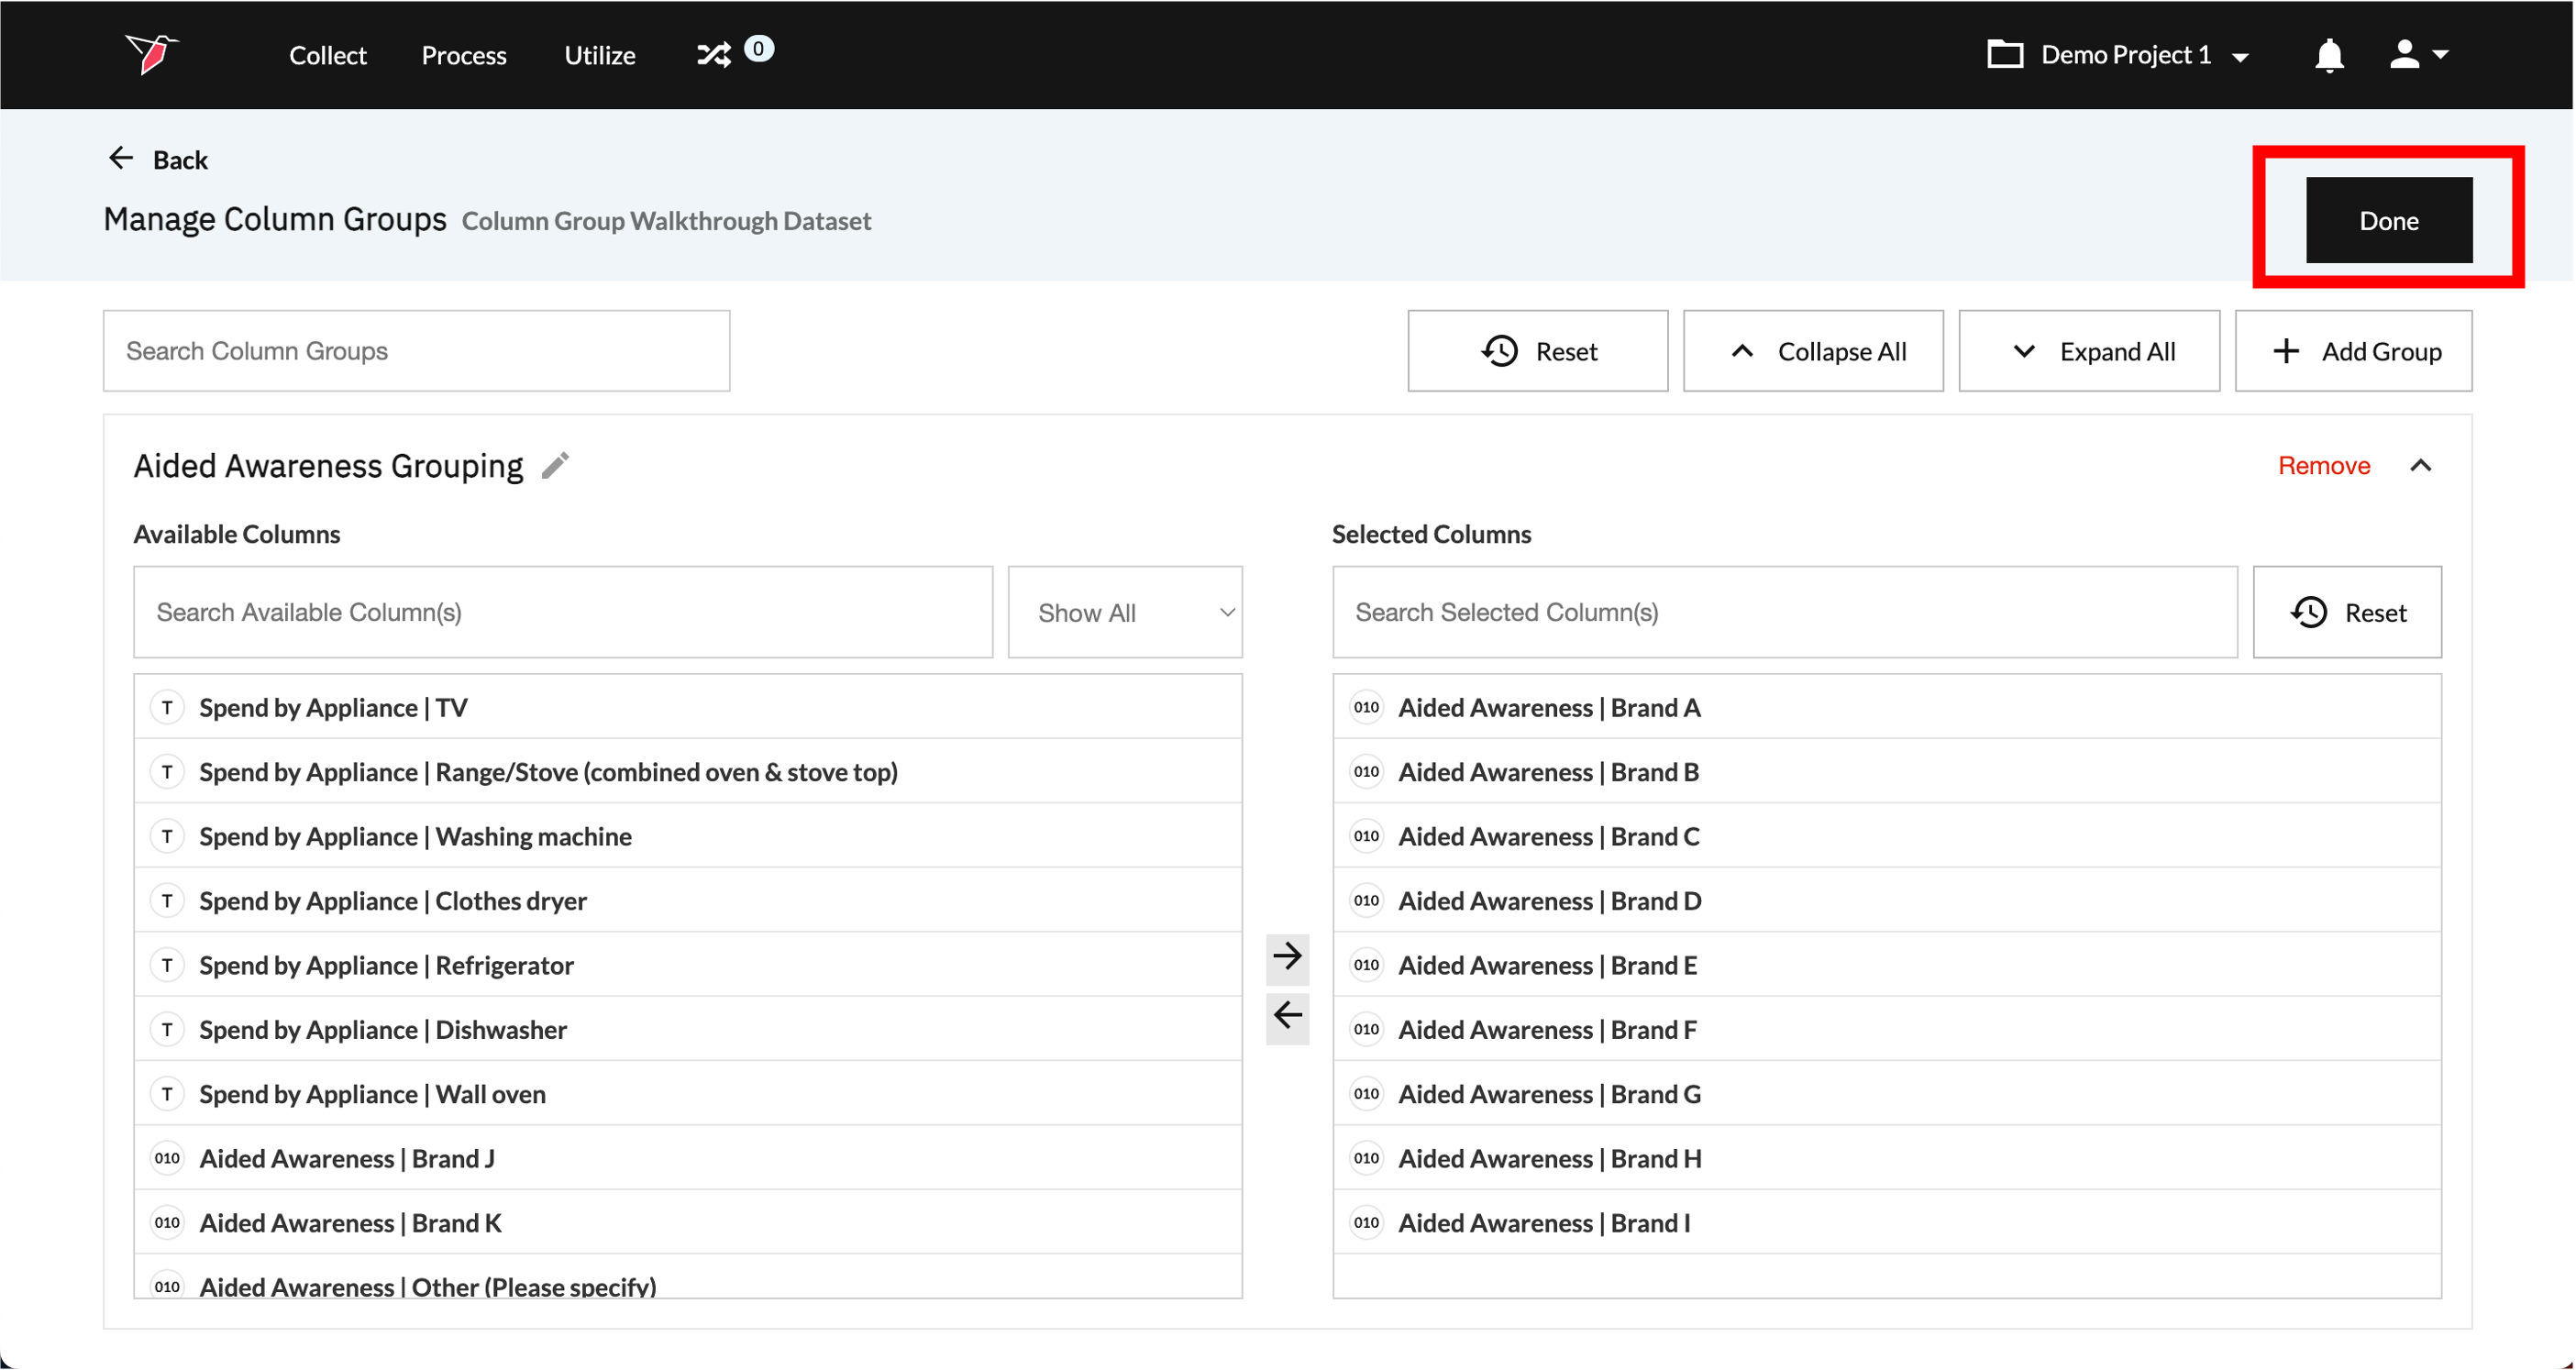
- Your column group has now been created. You can continue to add Column Groups, by following the same process from step 2 onwards. Once you have added all the Column Groups you require, click Done to close the page and return to the Workflow Canvas.
Note:You can group together any combination of Columns into one Column Group (as long as they are all Binary data type), even if they belong to different parent metrics/variables in your dataset.
Reviewing or Editing Column Groups
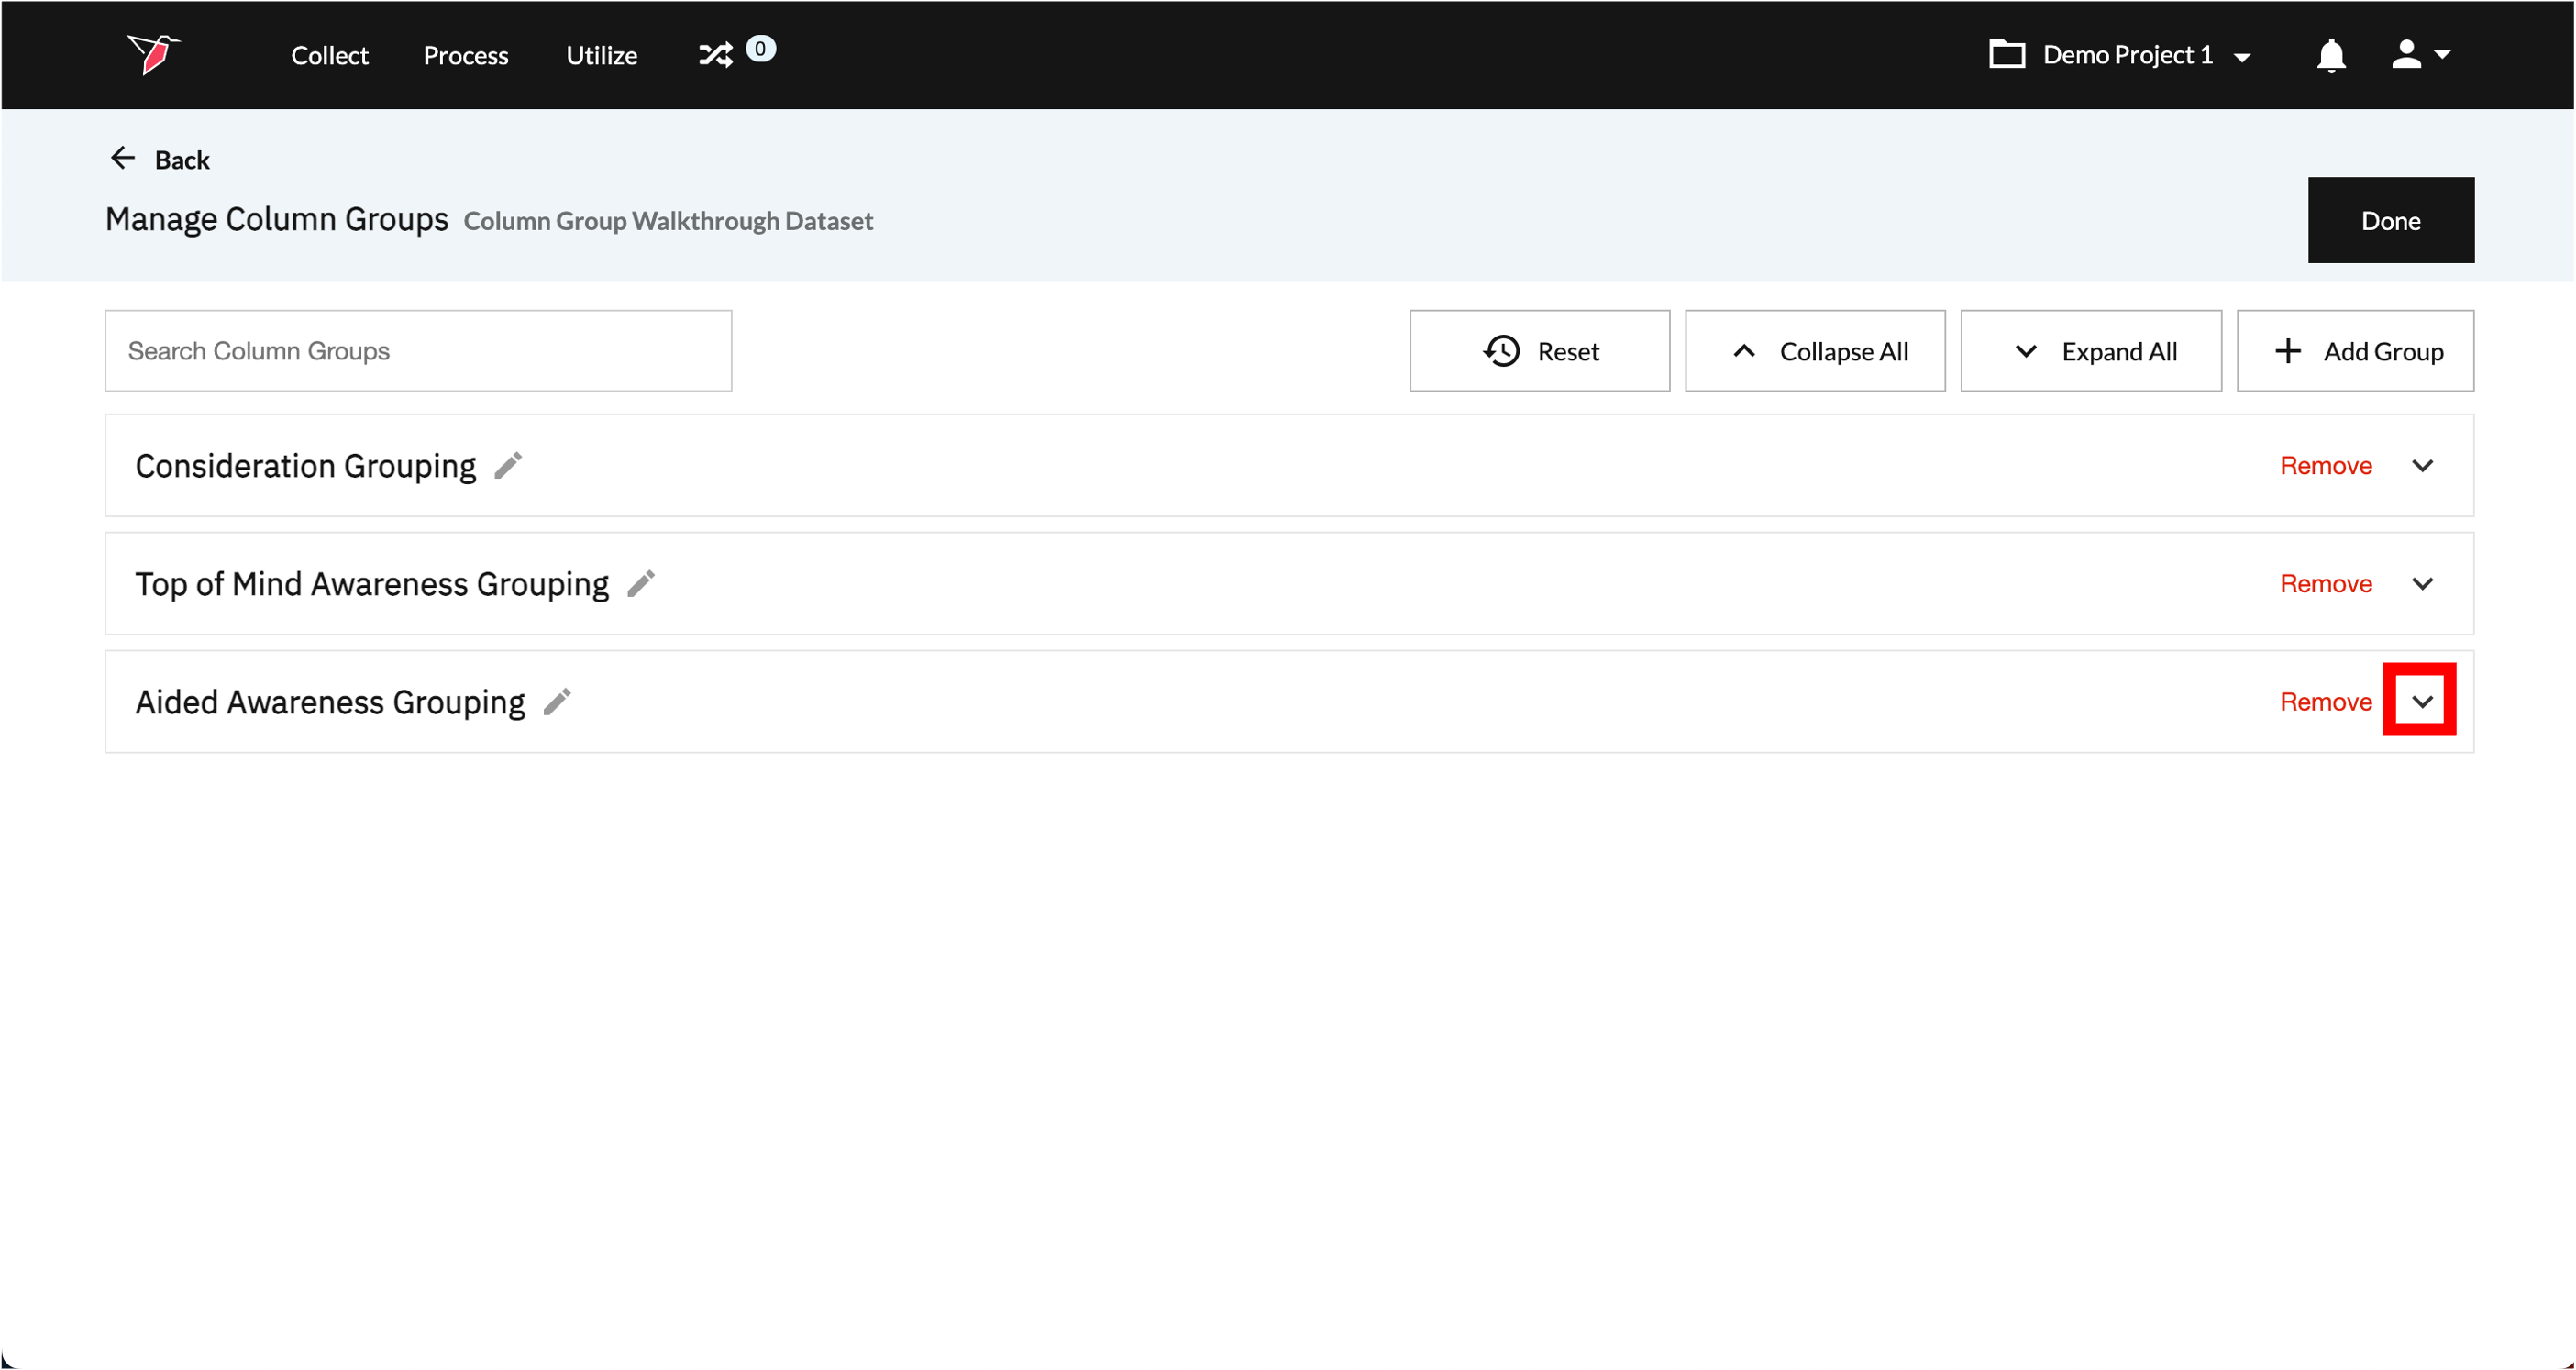
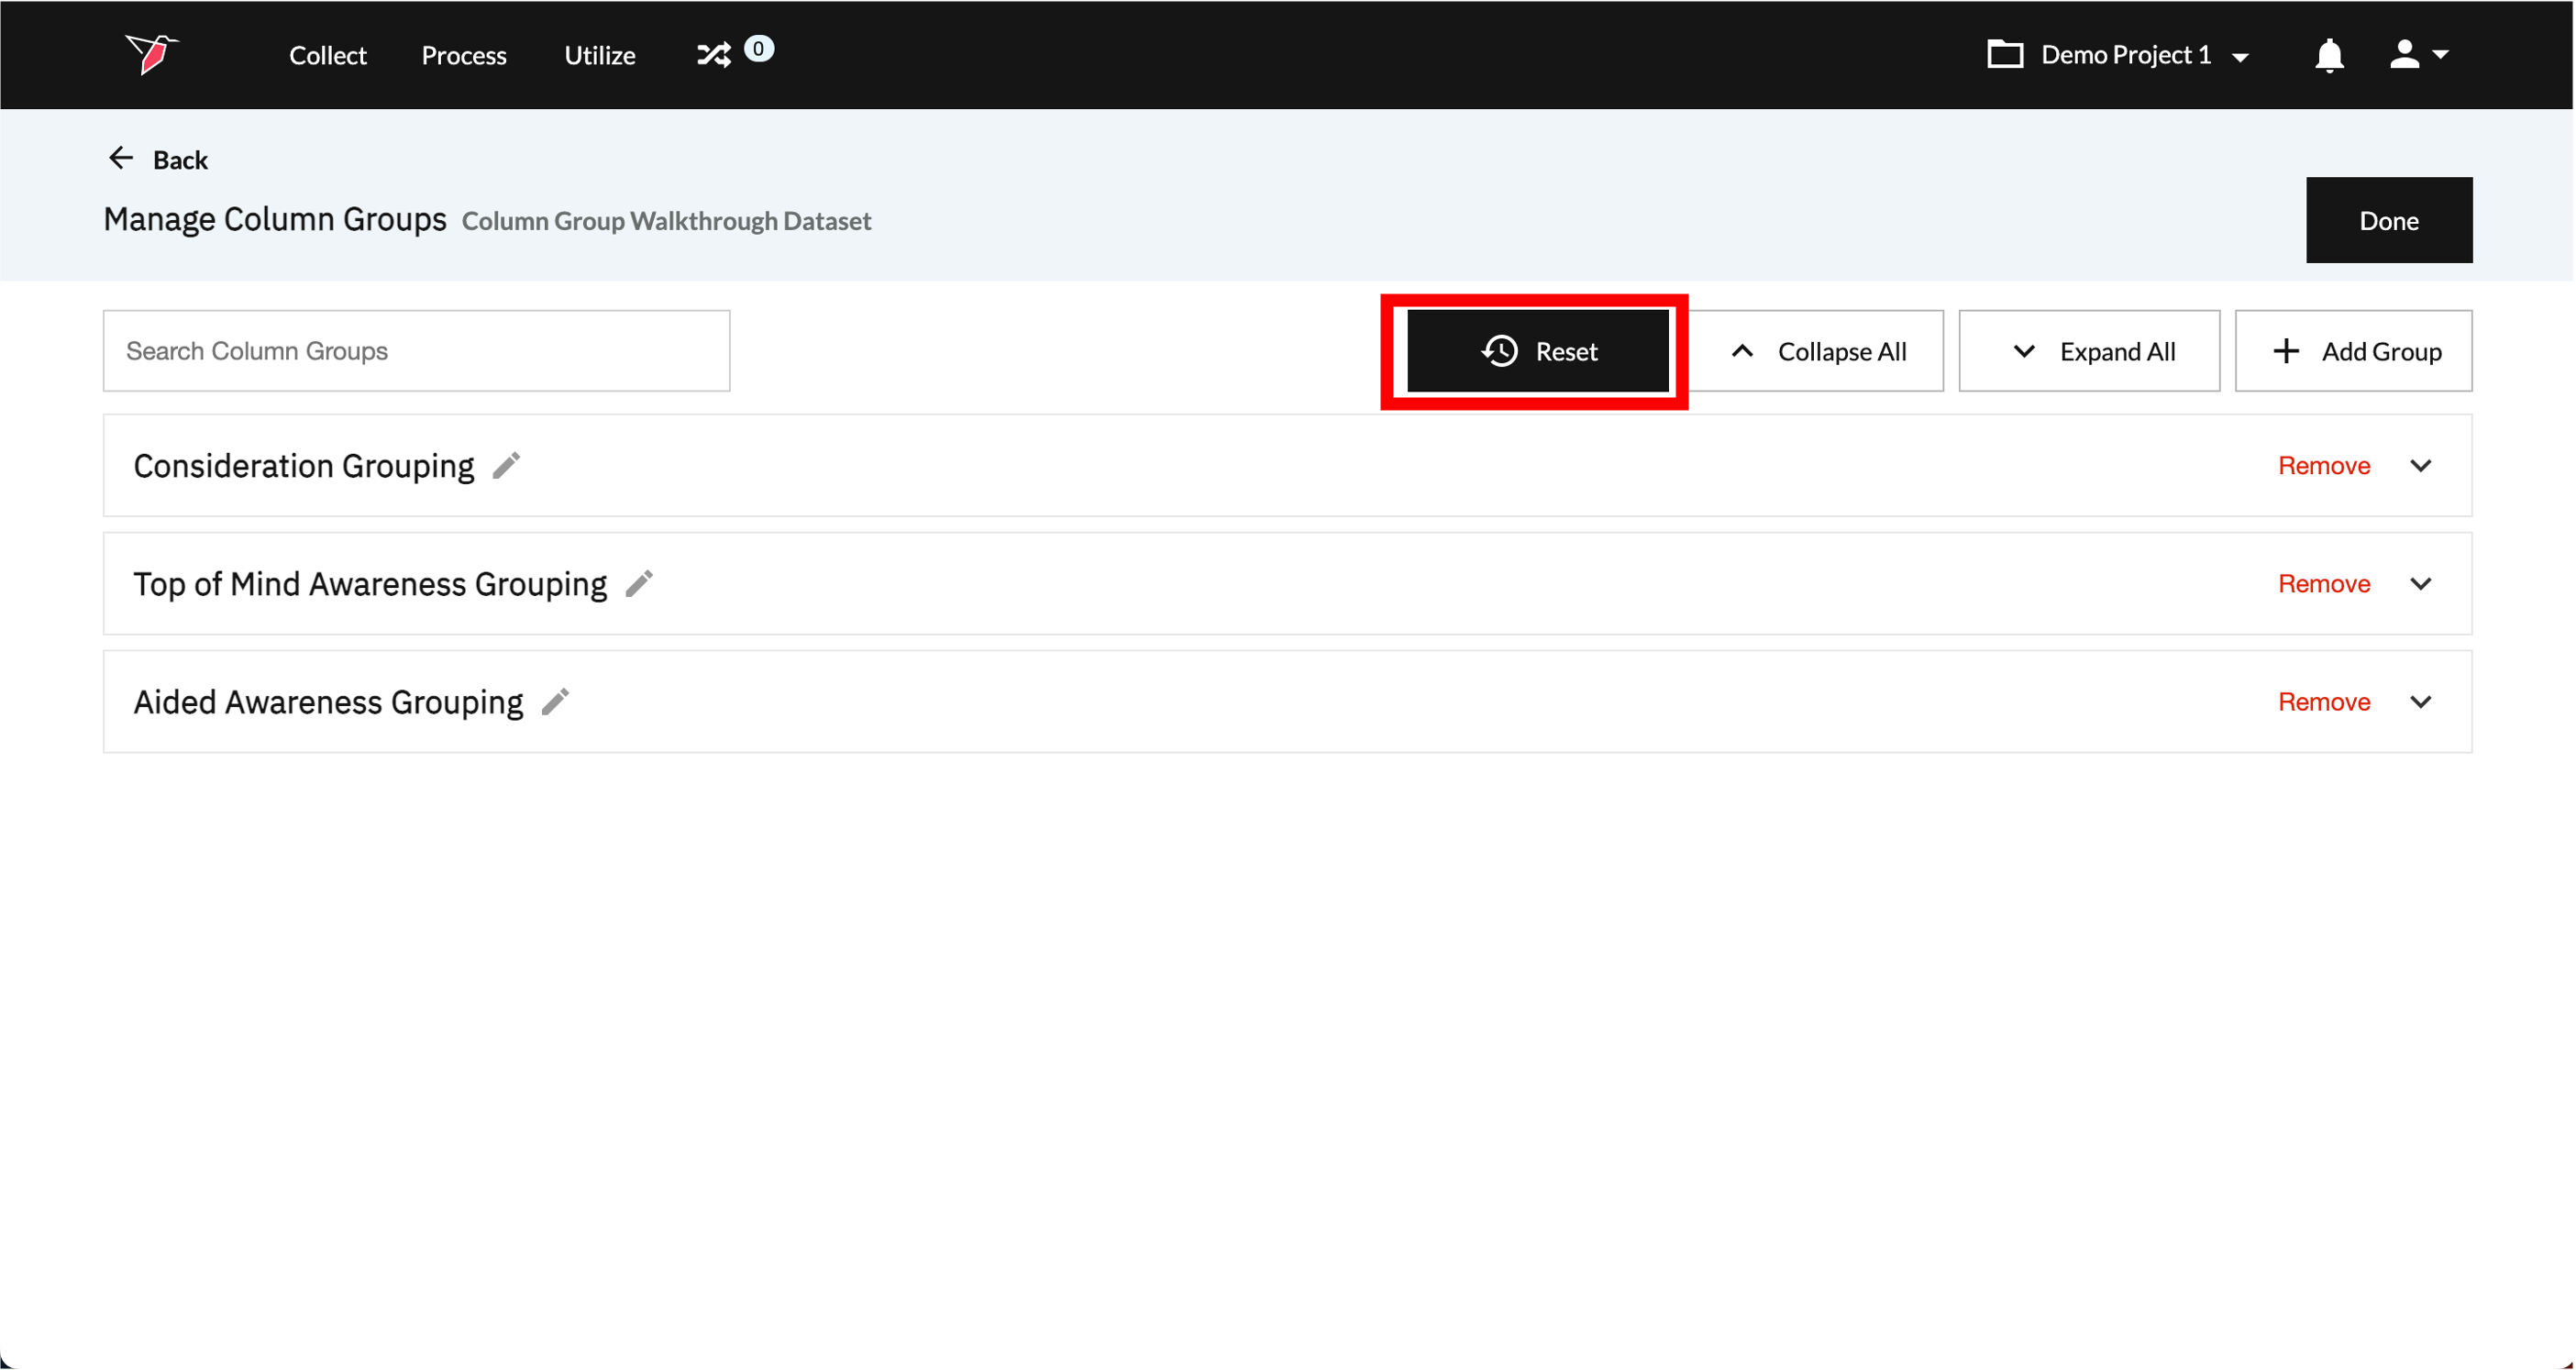
- From the Manage Column Groups page, all previously created Column Groups appear as expandable items on the page. Scroll down (or use search) to locate the one you wish to review or edit, then click the down arrow to expand that Column Group.
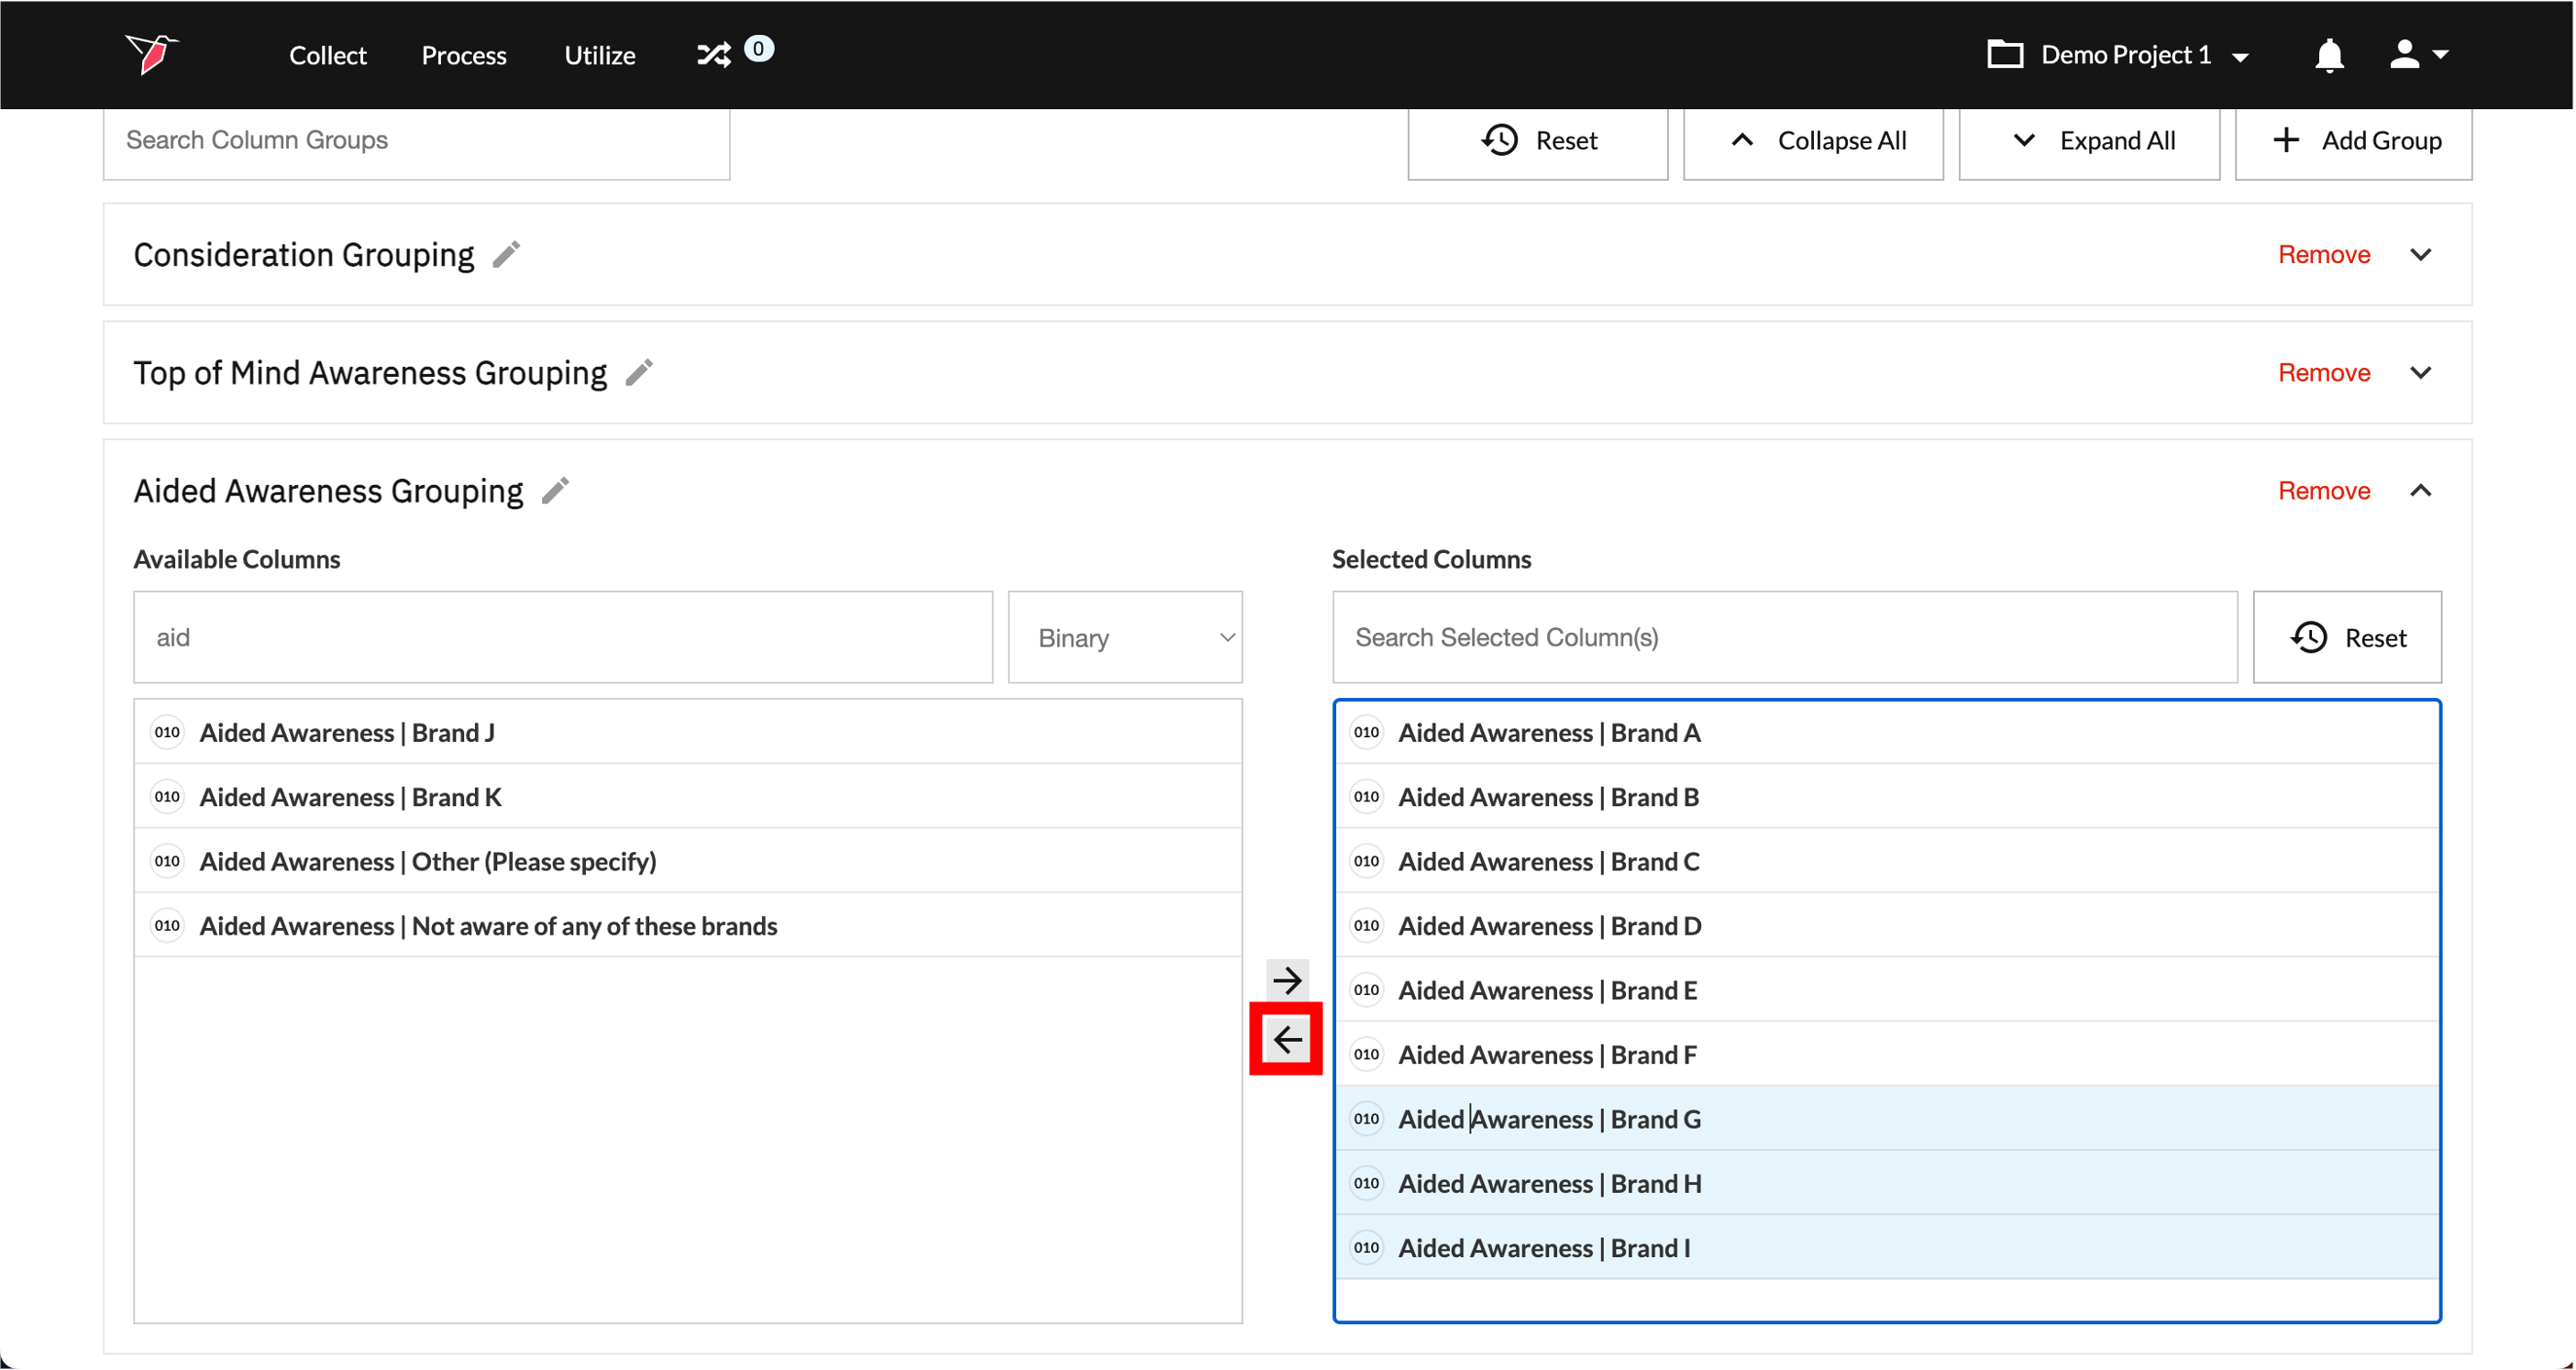
- Review all Selected Columns, or add or remove them by clicking and selecting the relevant columns and using the left and right arrows to include or exclude them.
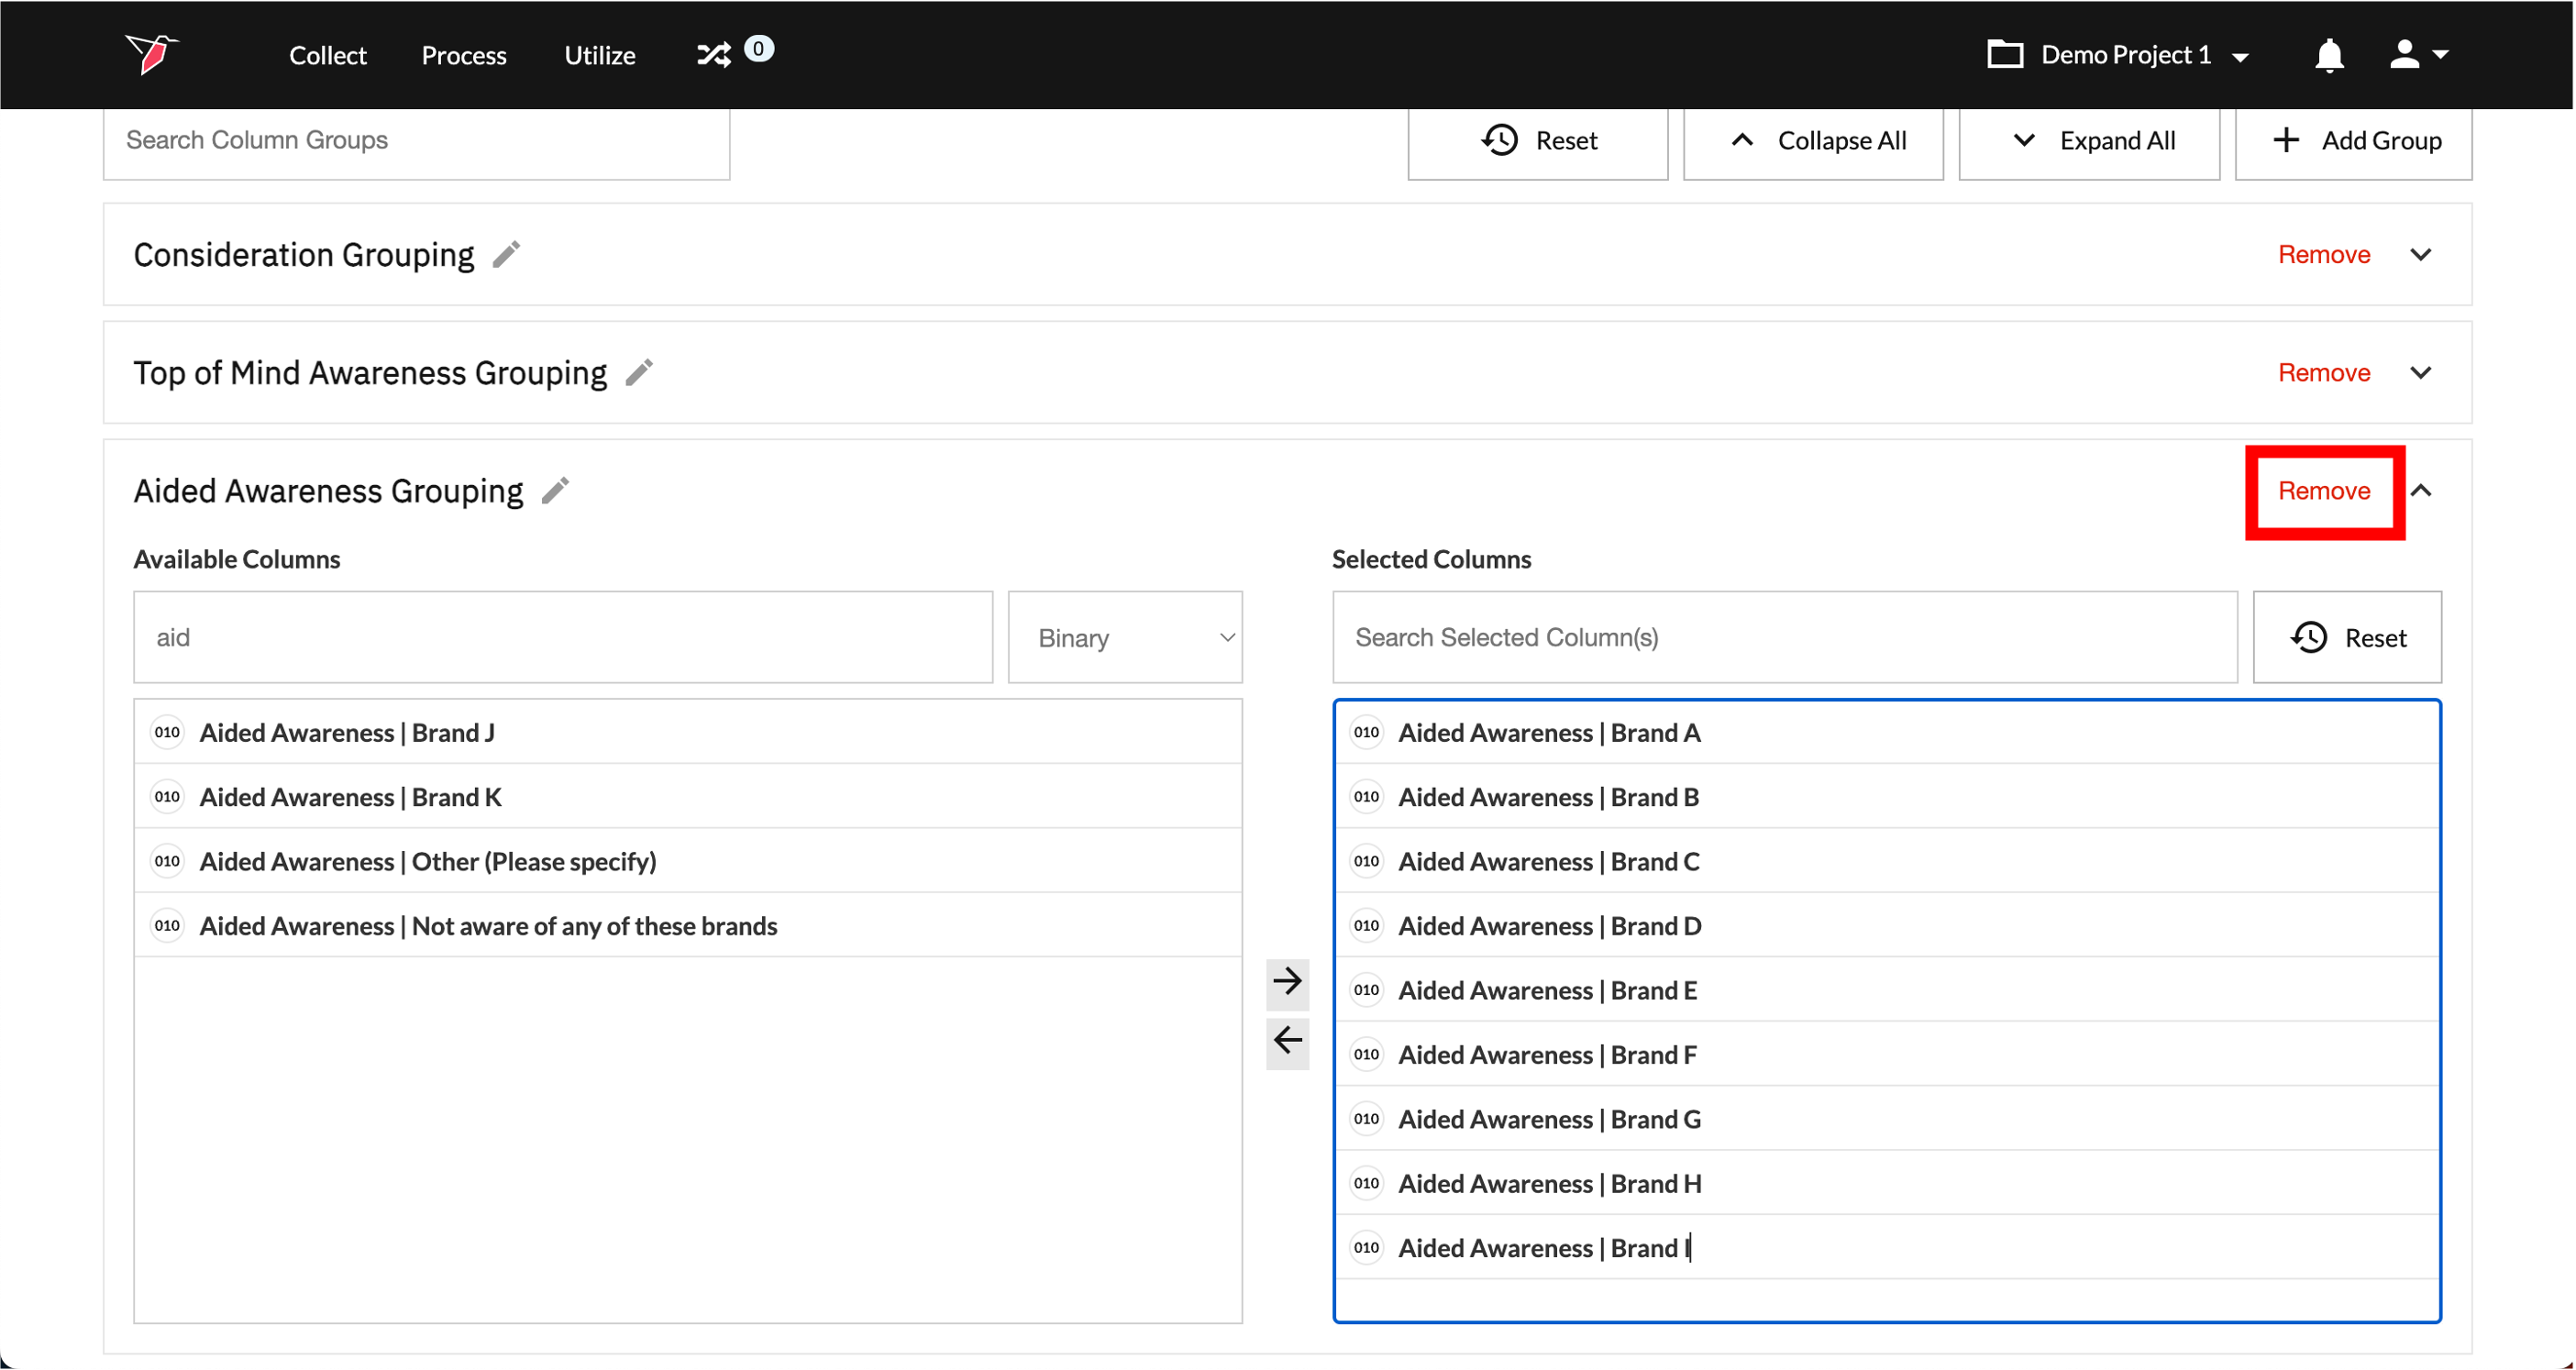
- To delete a Column Group, click Remove on the one you wish to delete.
- To reset the selection for an individual column group and empty the selected columns, click Reset for that column group.
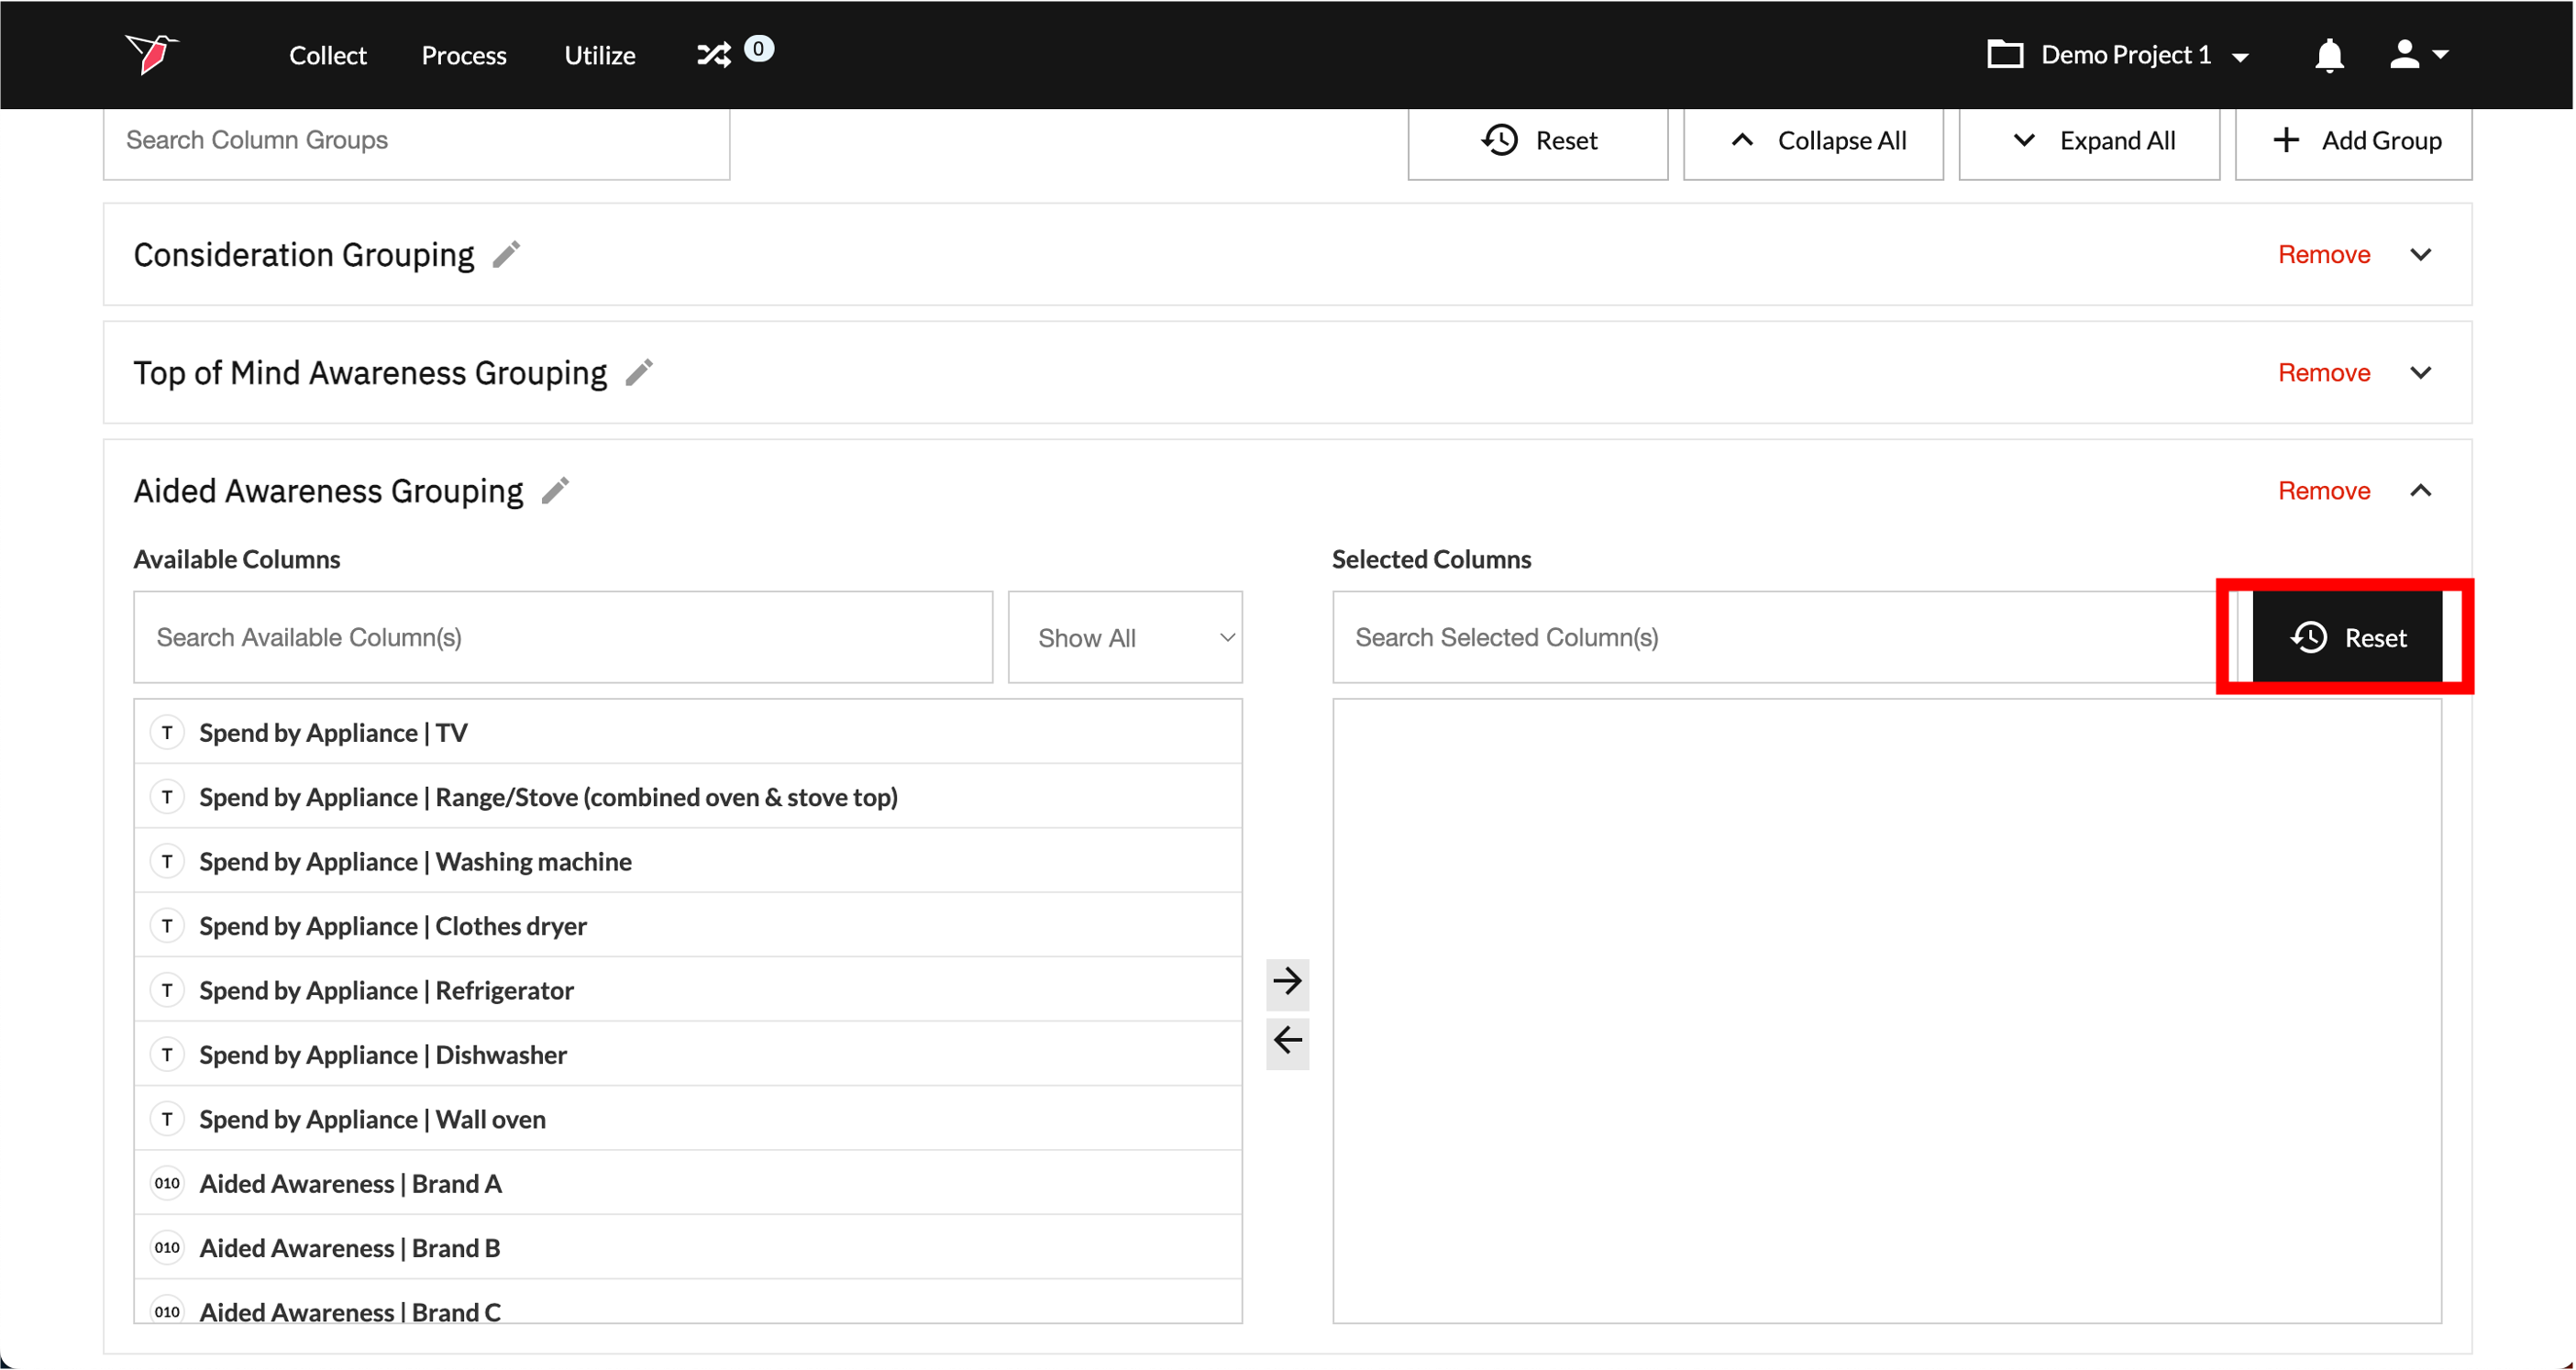
- To delete all Column Groups and reset the entire dataset to its previous state, click Reset at the master level.
Using Column Groups on Redbird
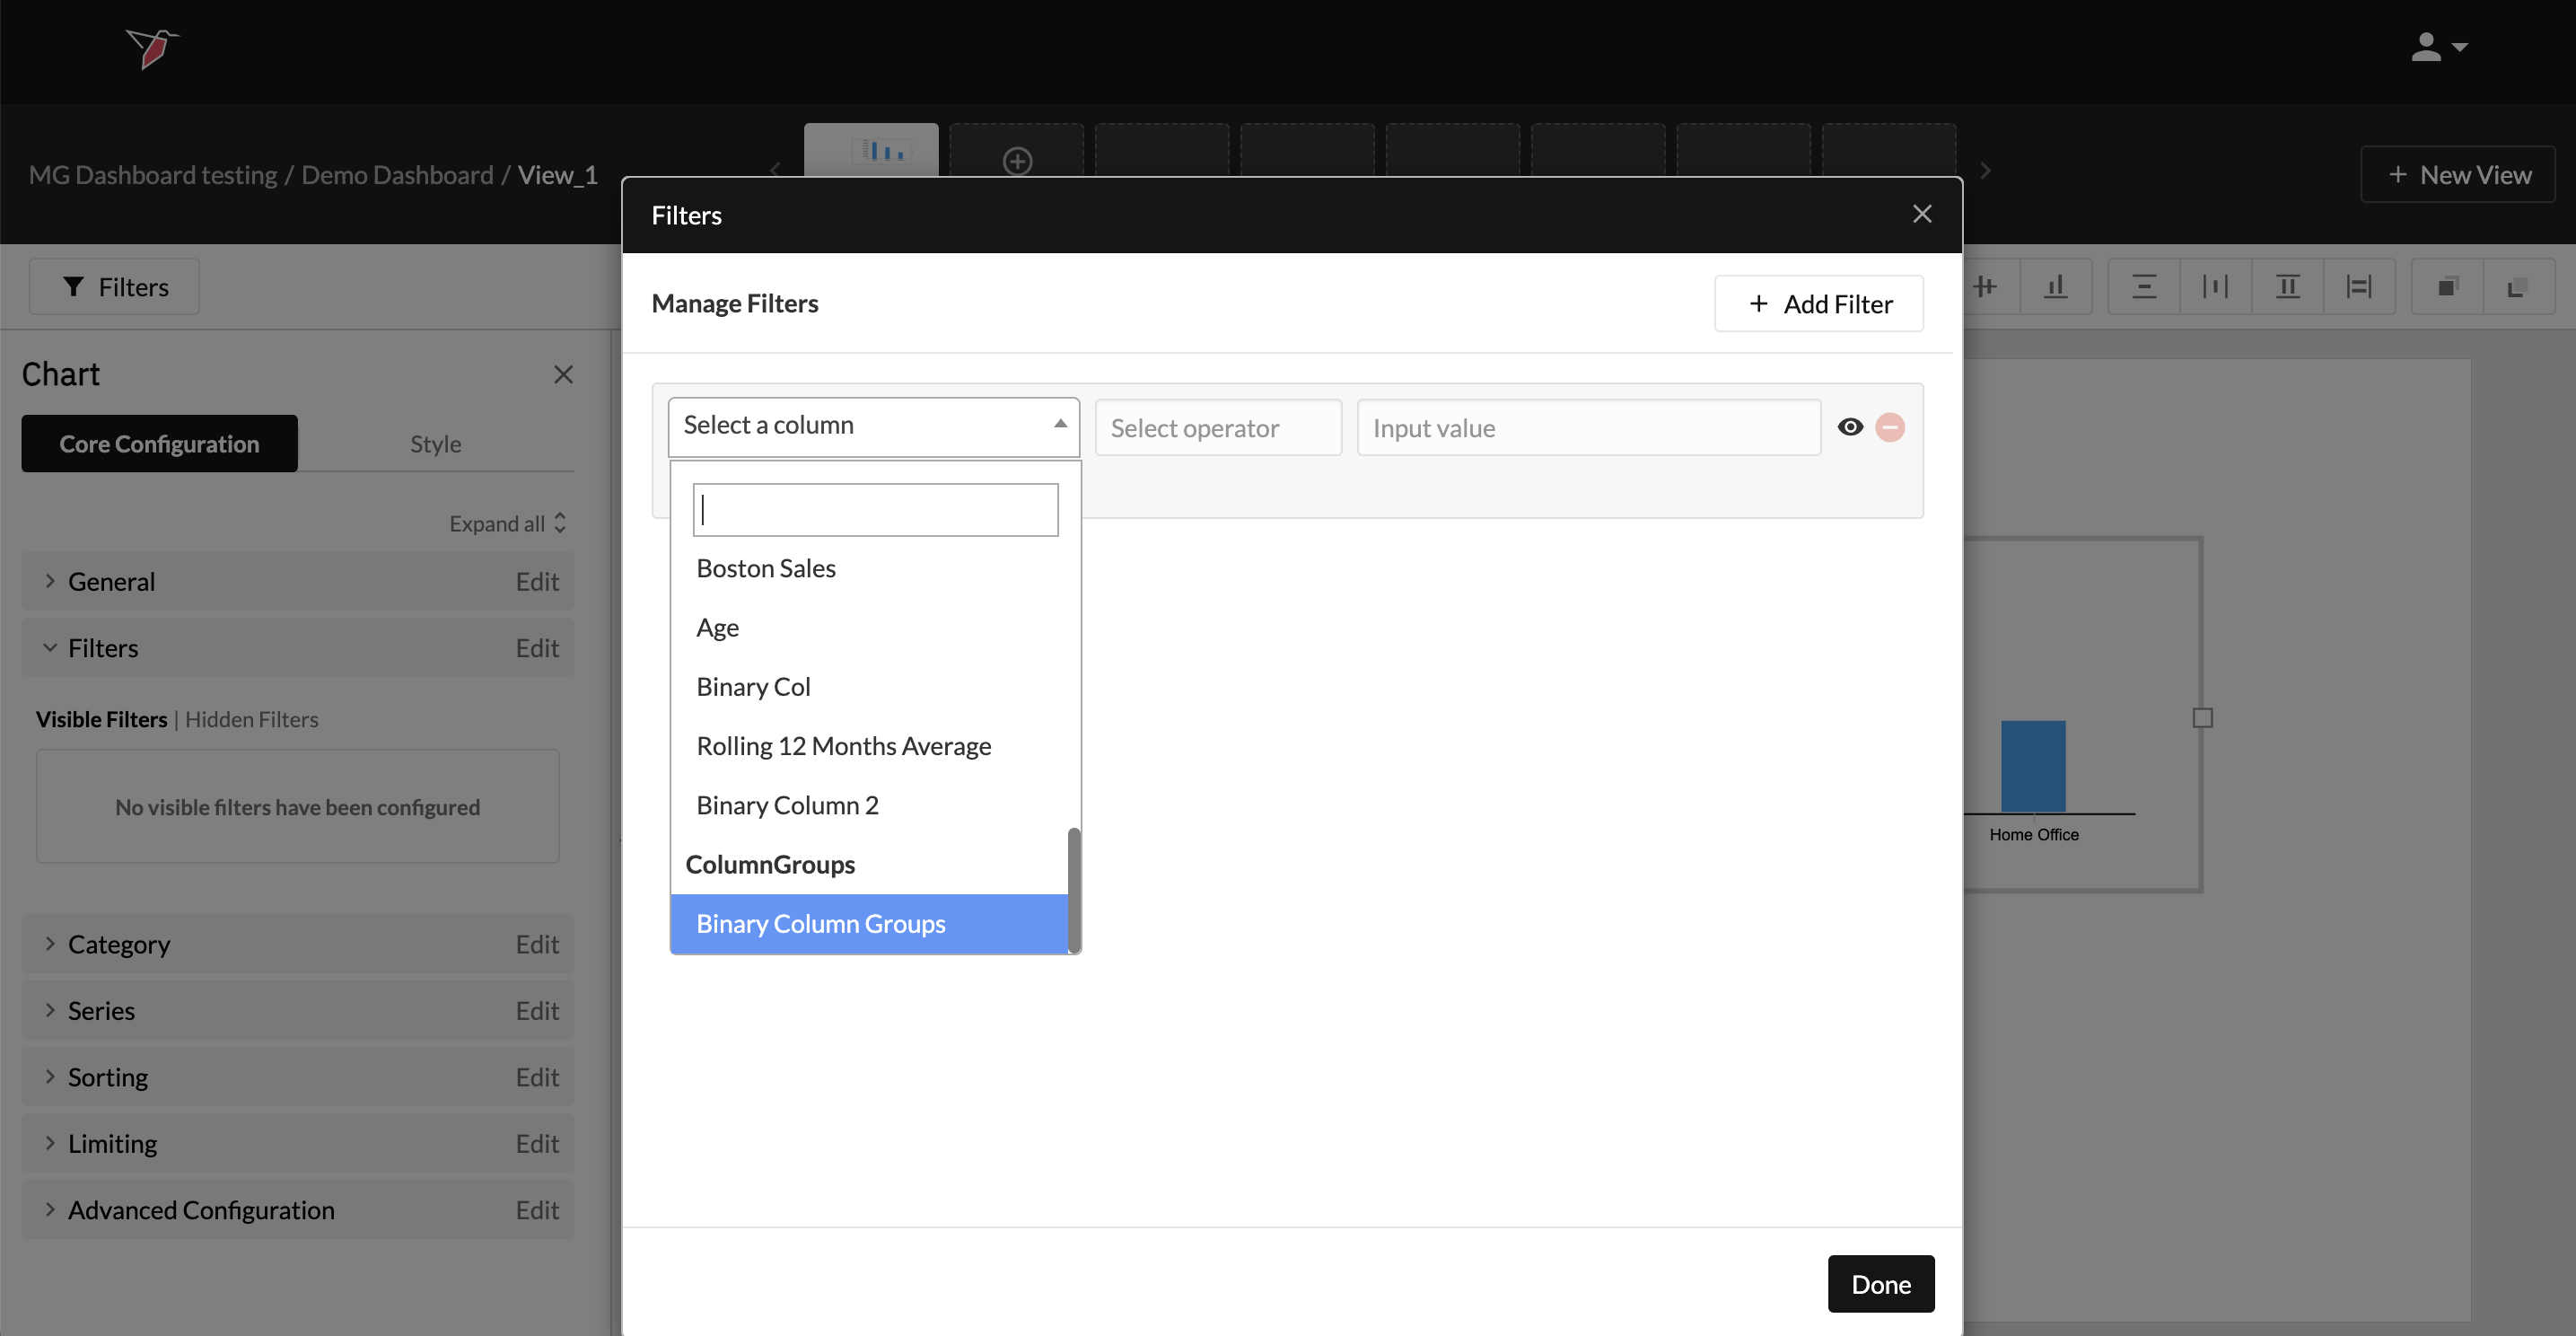
- Column Groups can be used across Redbird wherever you are able to use binary columns. You will see your Column Groups listed in the Select a Column dropdown. They will appear below the list of columns, denoted by the subheader ‘Column Groups’ - see the example below for using Columns Groups as a filter for a chart in dashboard builder:
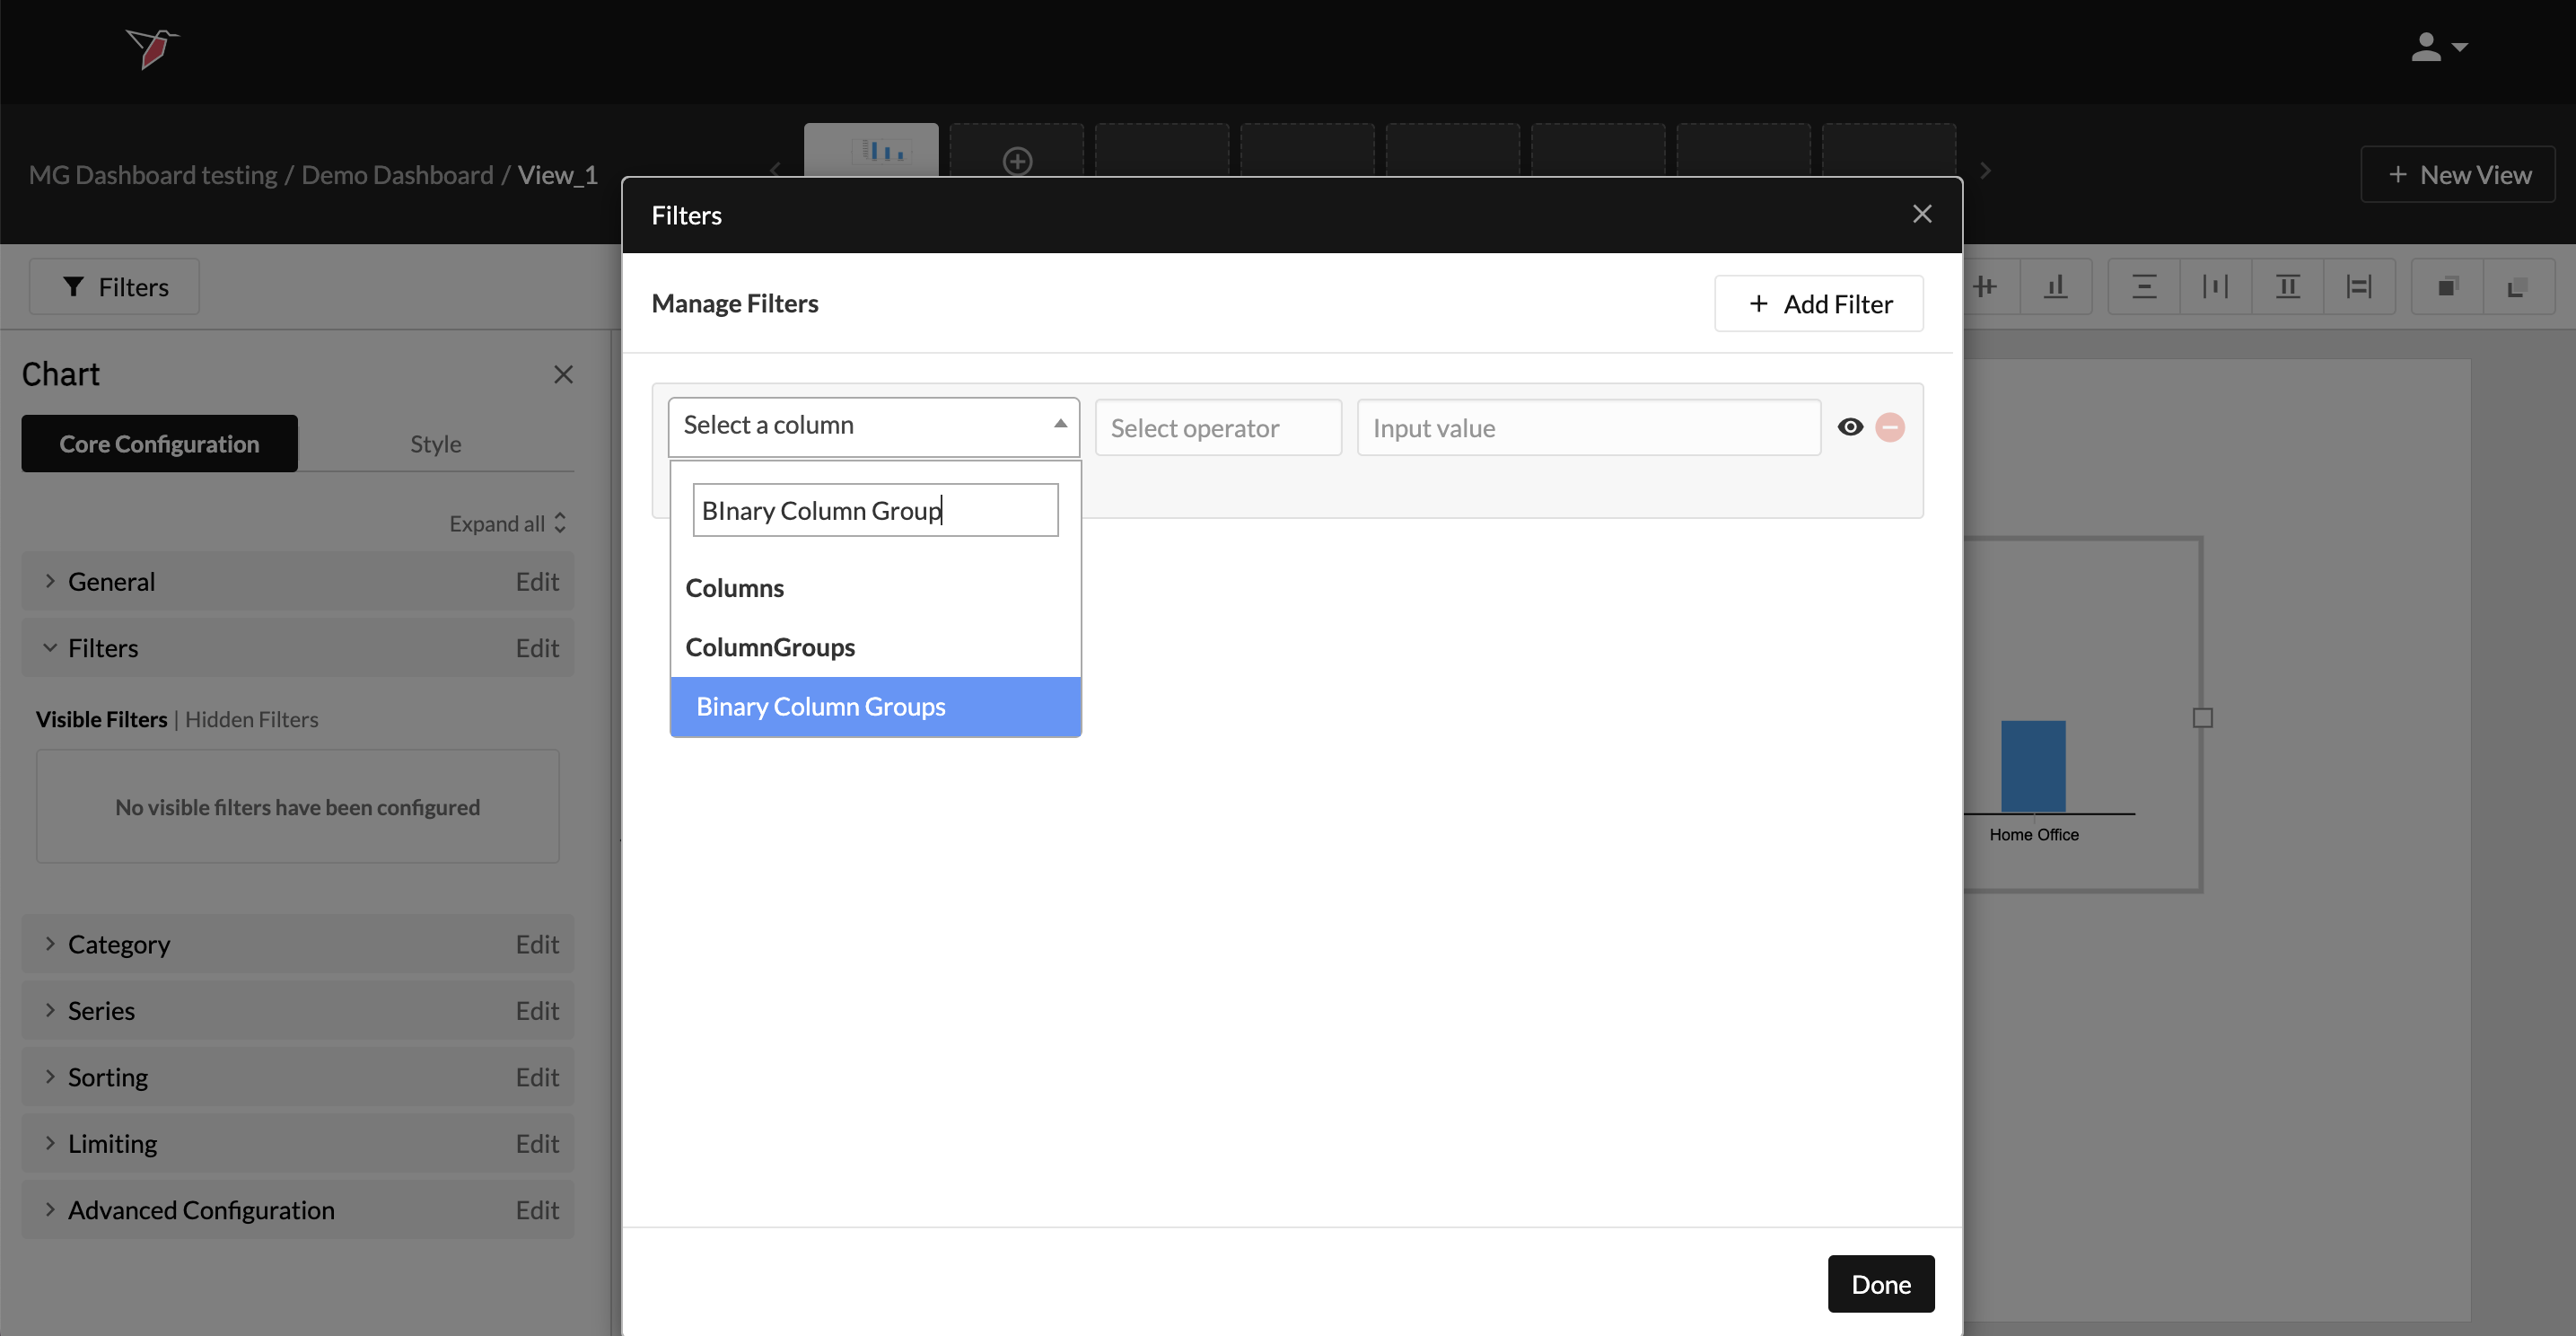
- As with regular columns, Column Groups can also be searched for in the search box at the top of the Select a Column drop-down.
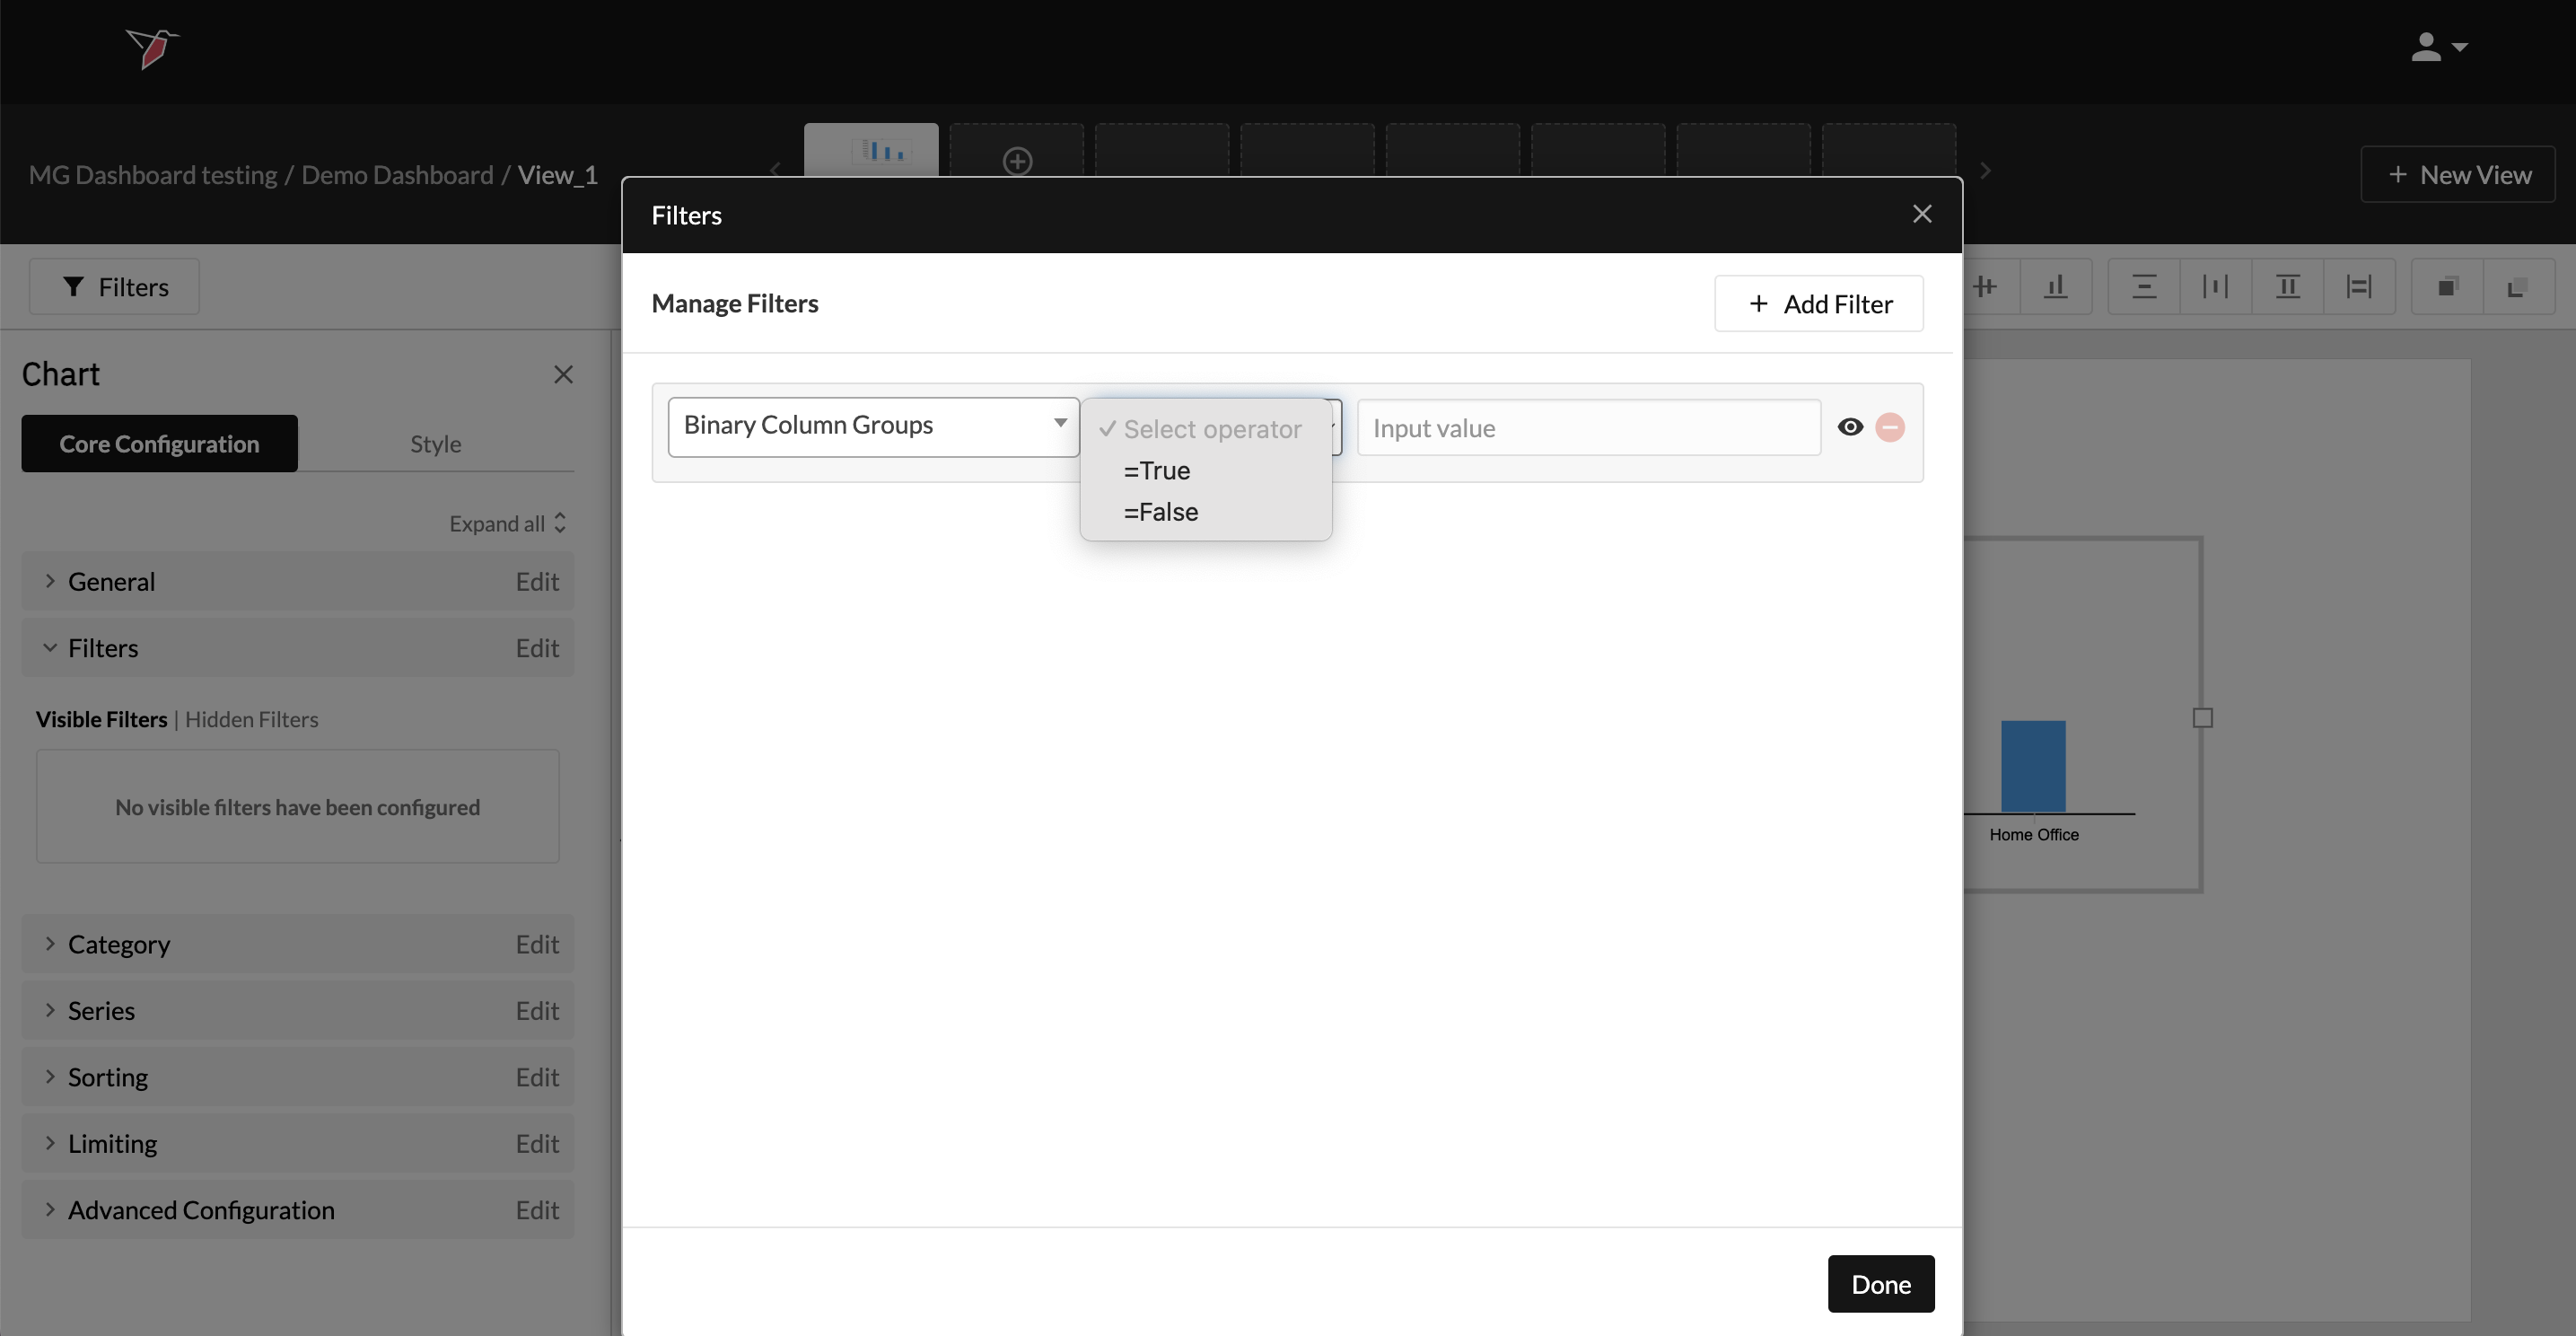
- Once you select the Column Group you wish to use, you will then be prompted to select whether you want to include TRUE or FALSE values at the Select Operator drop-down.
- Finally, you can select which column(s) you wish to include in the filter as default.
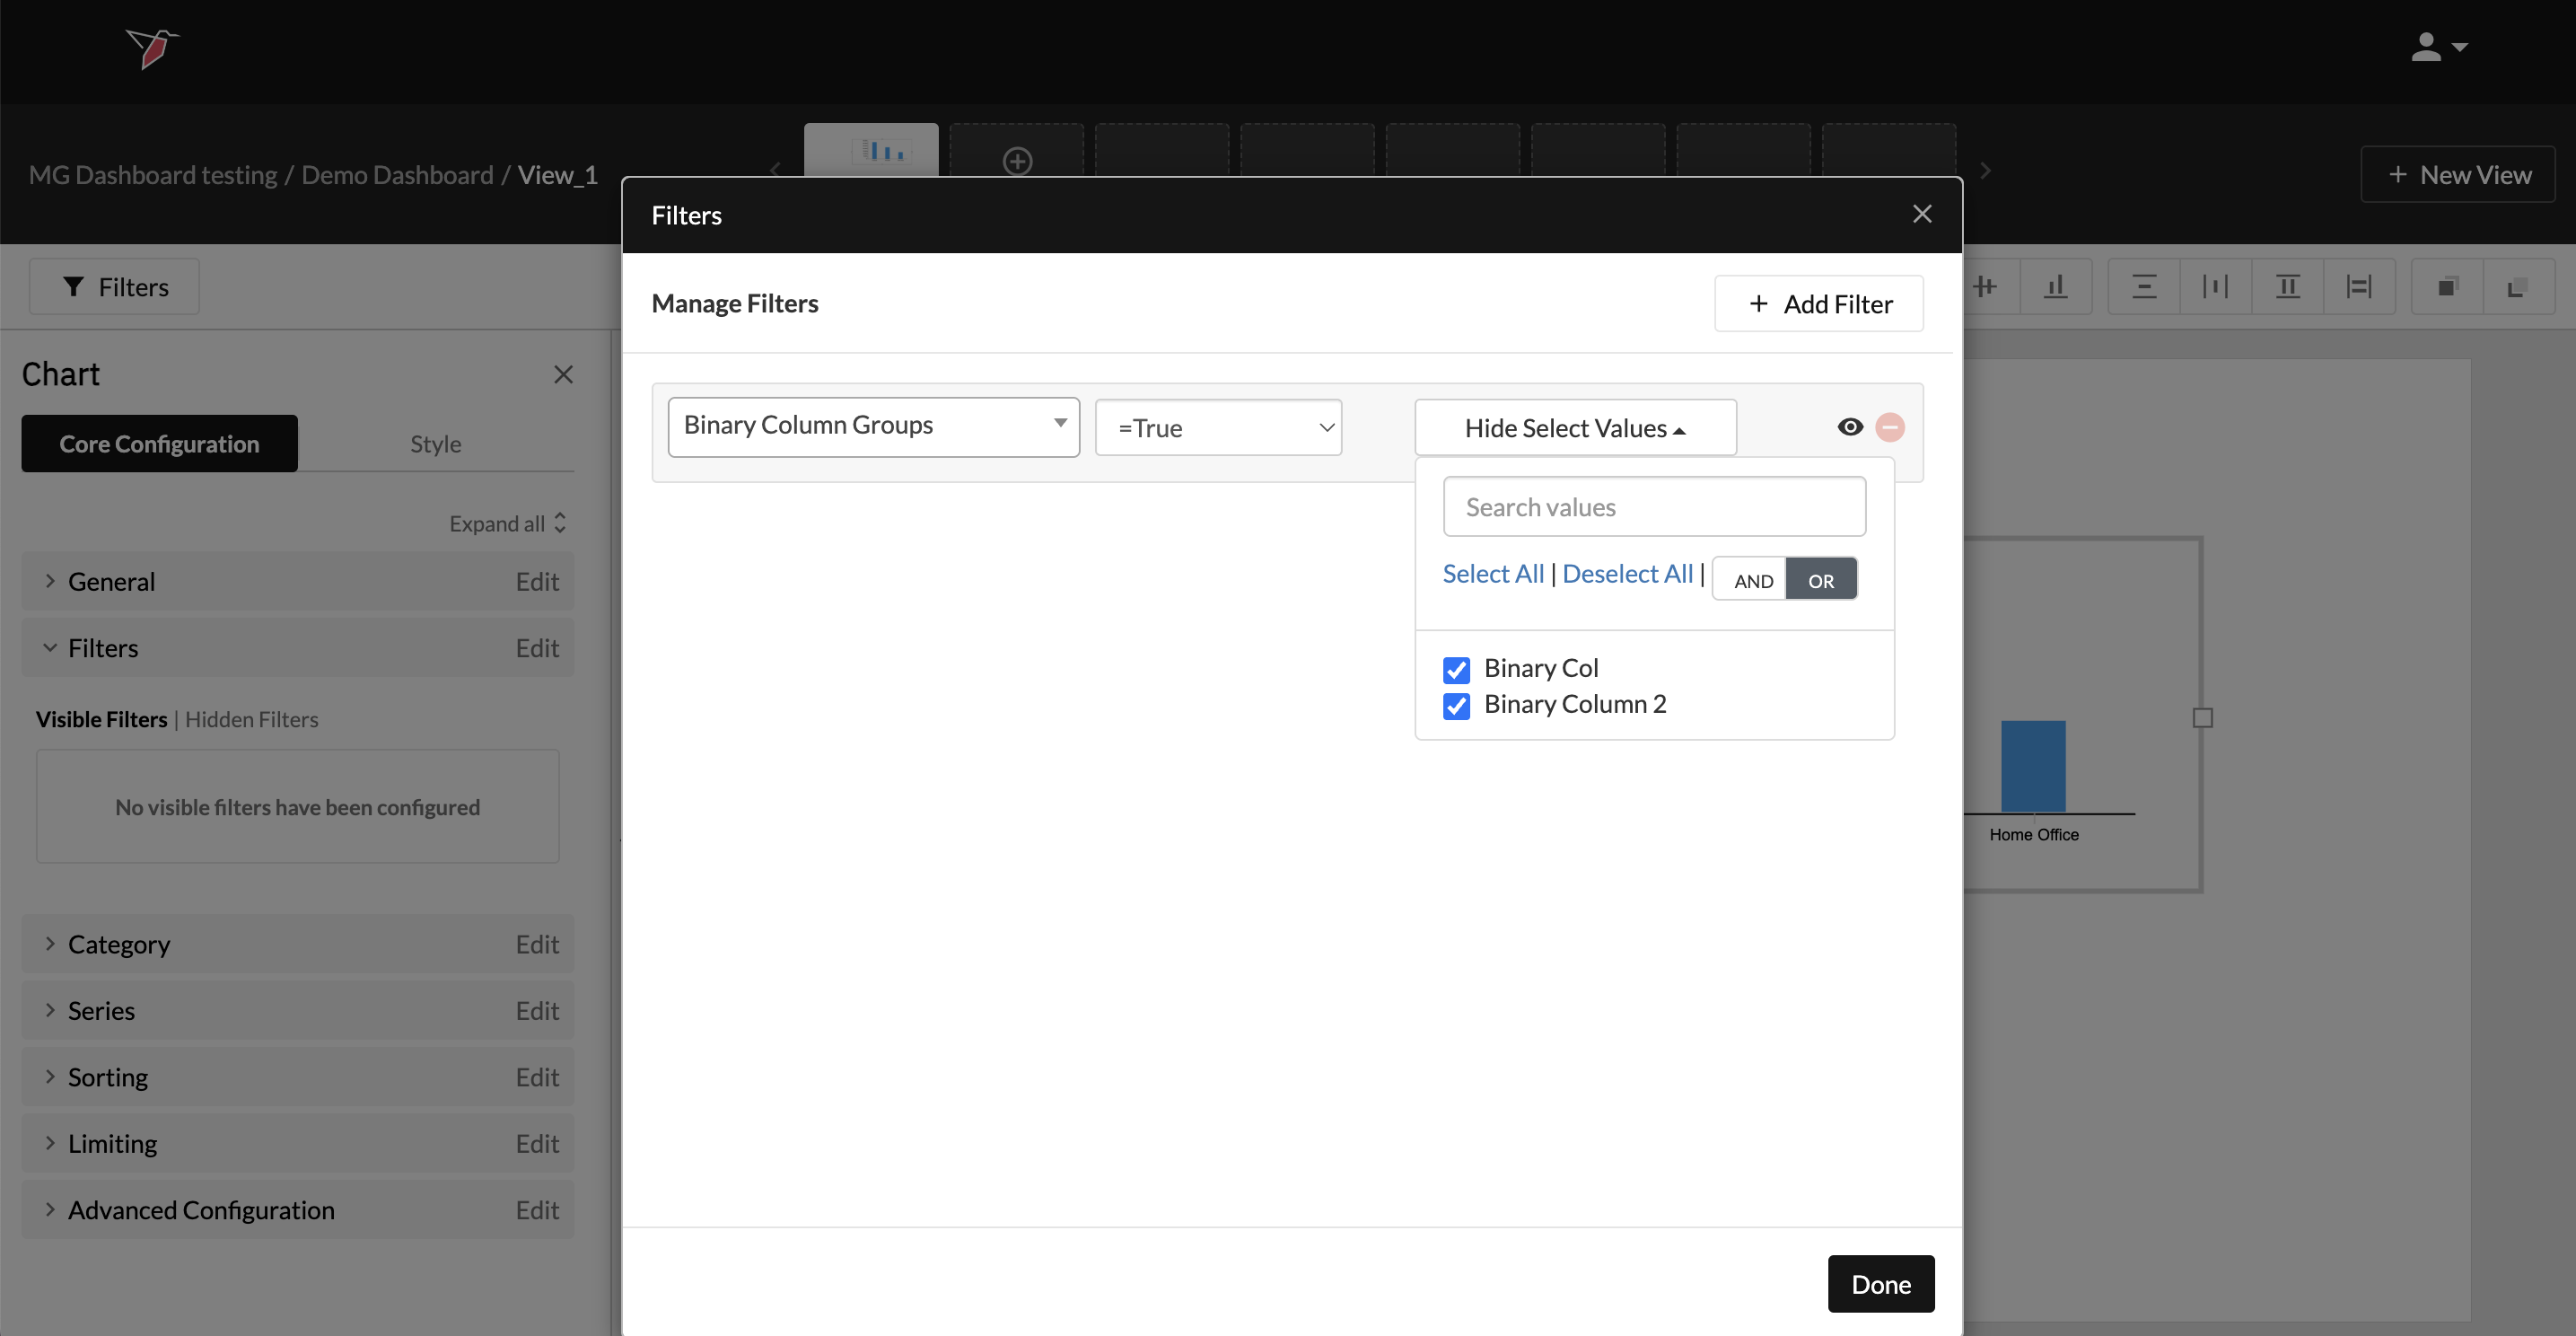
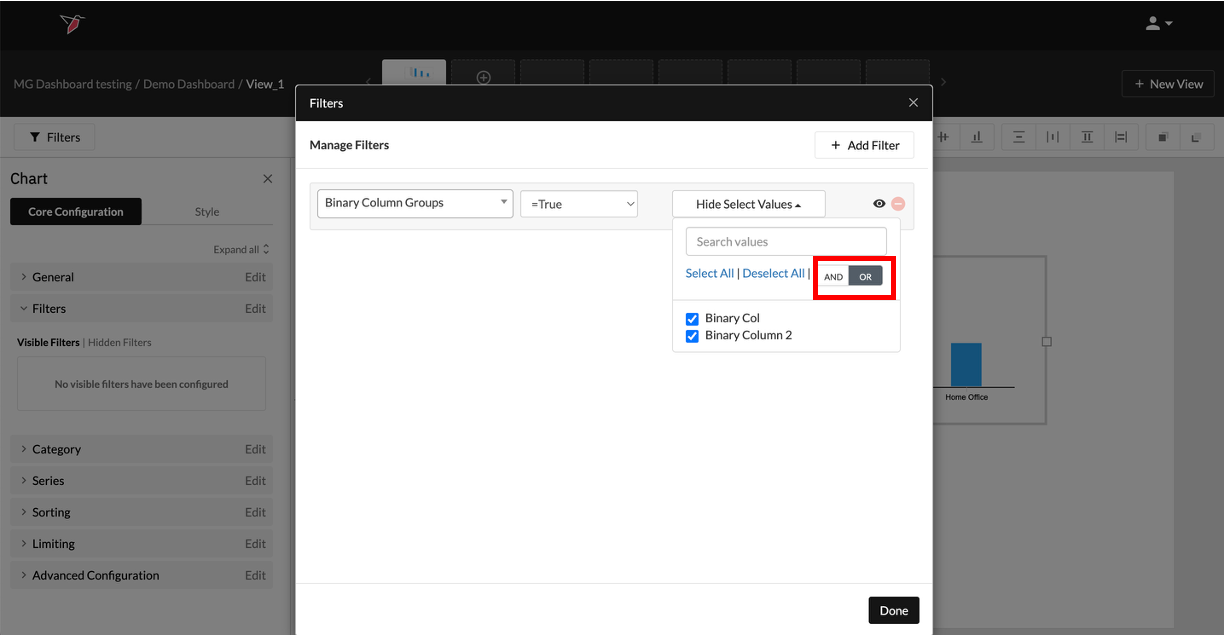
- You can also select whether you want multiple selections to be tied together with AND logic (i.e. the filter should only show values representing when all of the conditions selected are met) or with OR logic (i.e. the filter should show values if any of the conditions selected are met).
Using Column Groups for Columns in Text Data Format
Though the majority of use cases for Column Groups across Redbird are to aggregate Binary Columns, there are use cases where data relating to a variable will be stored across multiple columns in Text format, rather than Binary. An example within survey data could be the following question regarding spend per appliance:
How much would you consider spending on the following types of appliances?
TV
Range/Stove
Washing Machine
Clothes Dryer
Refrigerator
Etc.
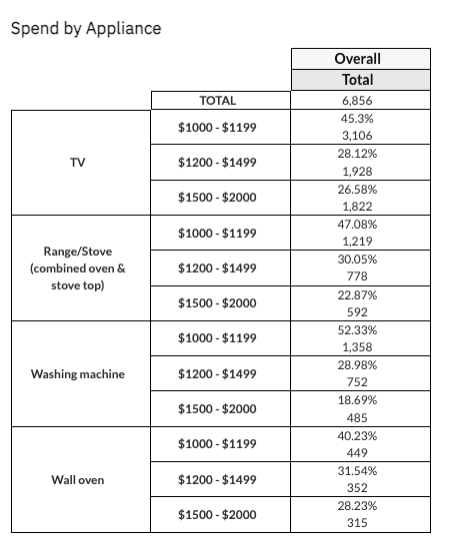
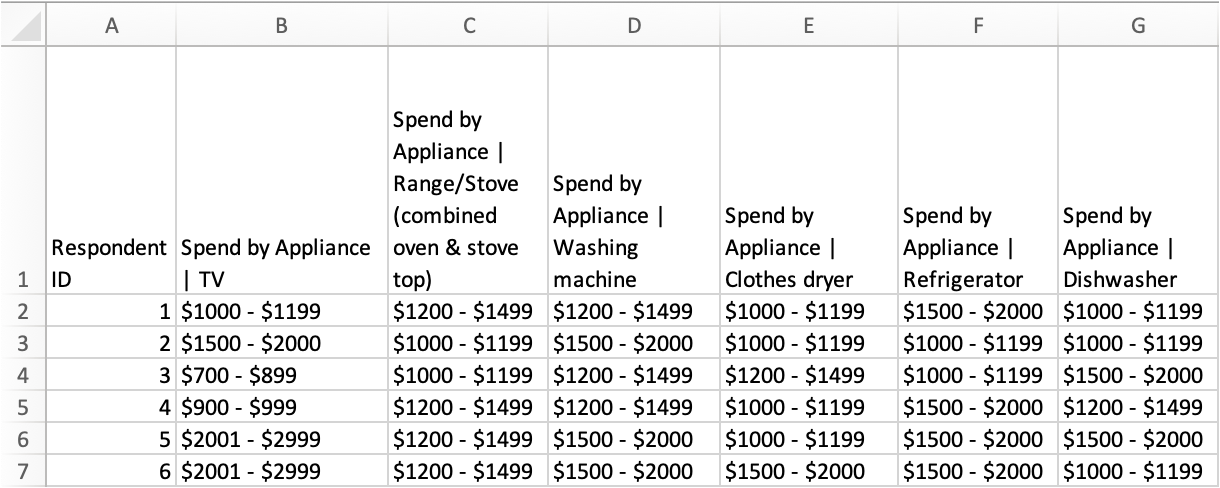
In this case, the responses to this question (variable) would most likely appear as follows, with each row representing a respondent, and each column representing the respondent’s response to each option for that question in a categorical format. In this example, considered spend for each appliance type is denoted on a scale with distinct bands of dollar amounts: $1000-$1199, $1200 - $1499, $1500 - $2000 etc. Each of these columns should be assigned the Text data type when creating the dataset given their discrete nature.
To create text column groups, follow the same steps as instructed above for creating Binary column groups, but instead, filter on ‘Text’ at Step 4 when adding a new column group. This will only show available columns with the 'Text' data format that you can then group accordingly.
Note:Text Column Groups can currently only be used in our Cross Tabs operations and are not available to use on other parts of the platform.
Continuing with the above example, Text Column groups would enable you to create the following ‘Spend by Appliance’ table in the Cross Tabs: