Event Logs
Background
When a node runs on the canvas, you’ll see a general notification in the banner indicating whether it ran successfully. The node’s status icon (circle in the top right corner of the node) will also update its color and symbol accordingly.
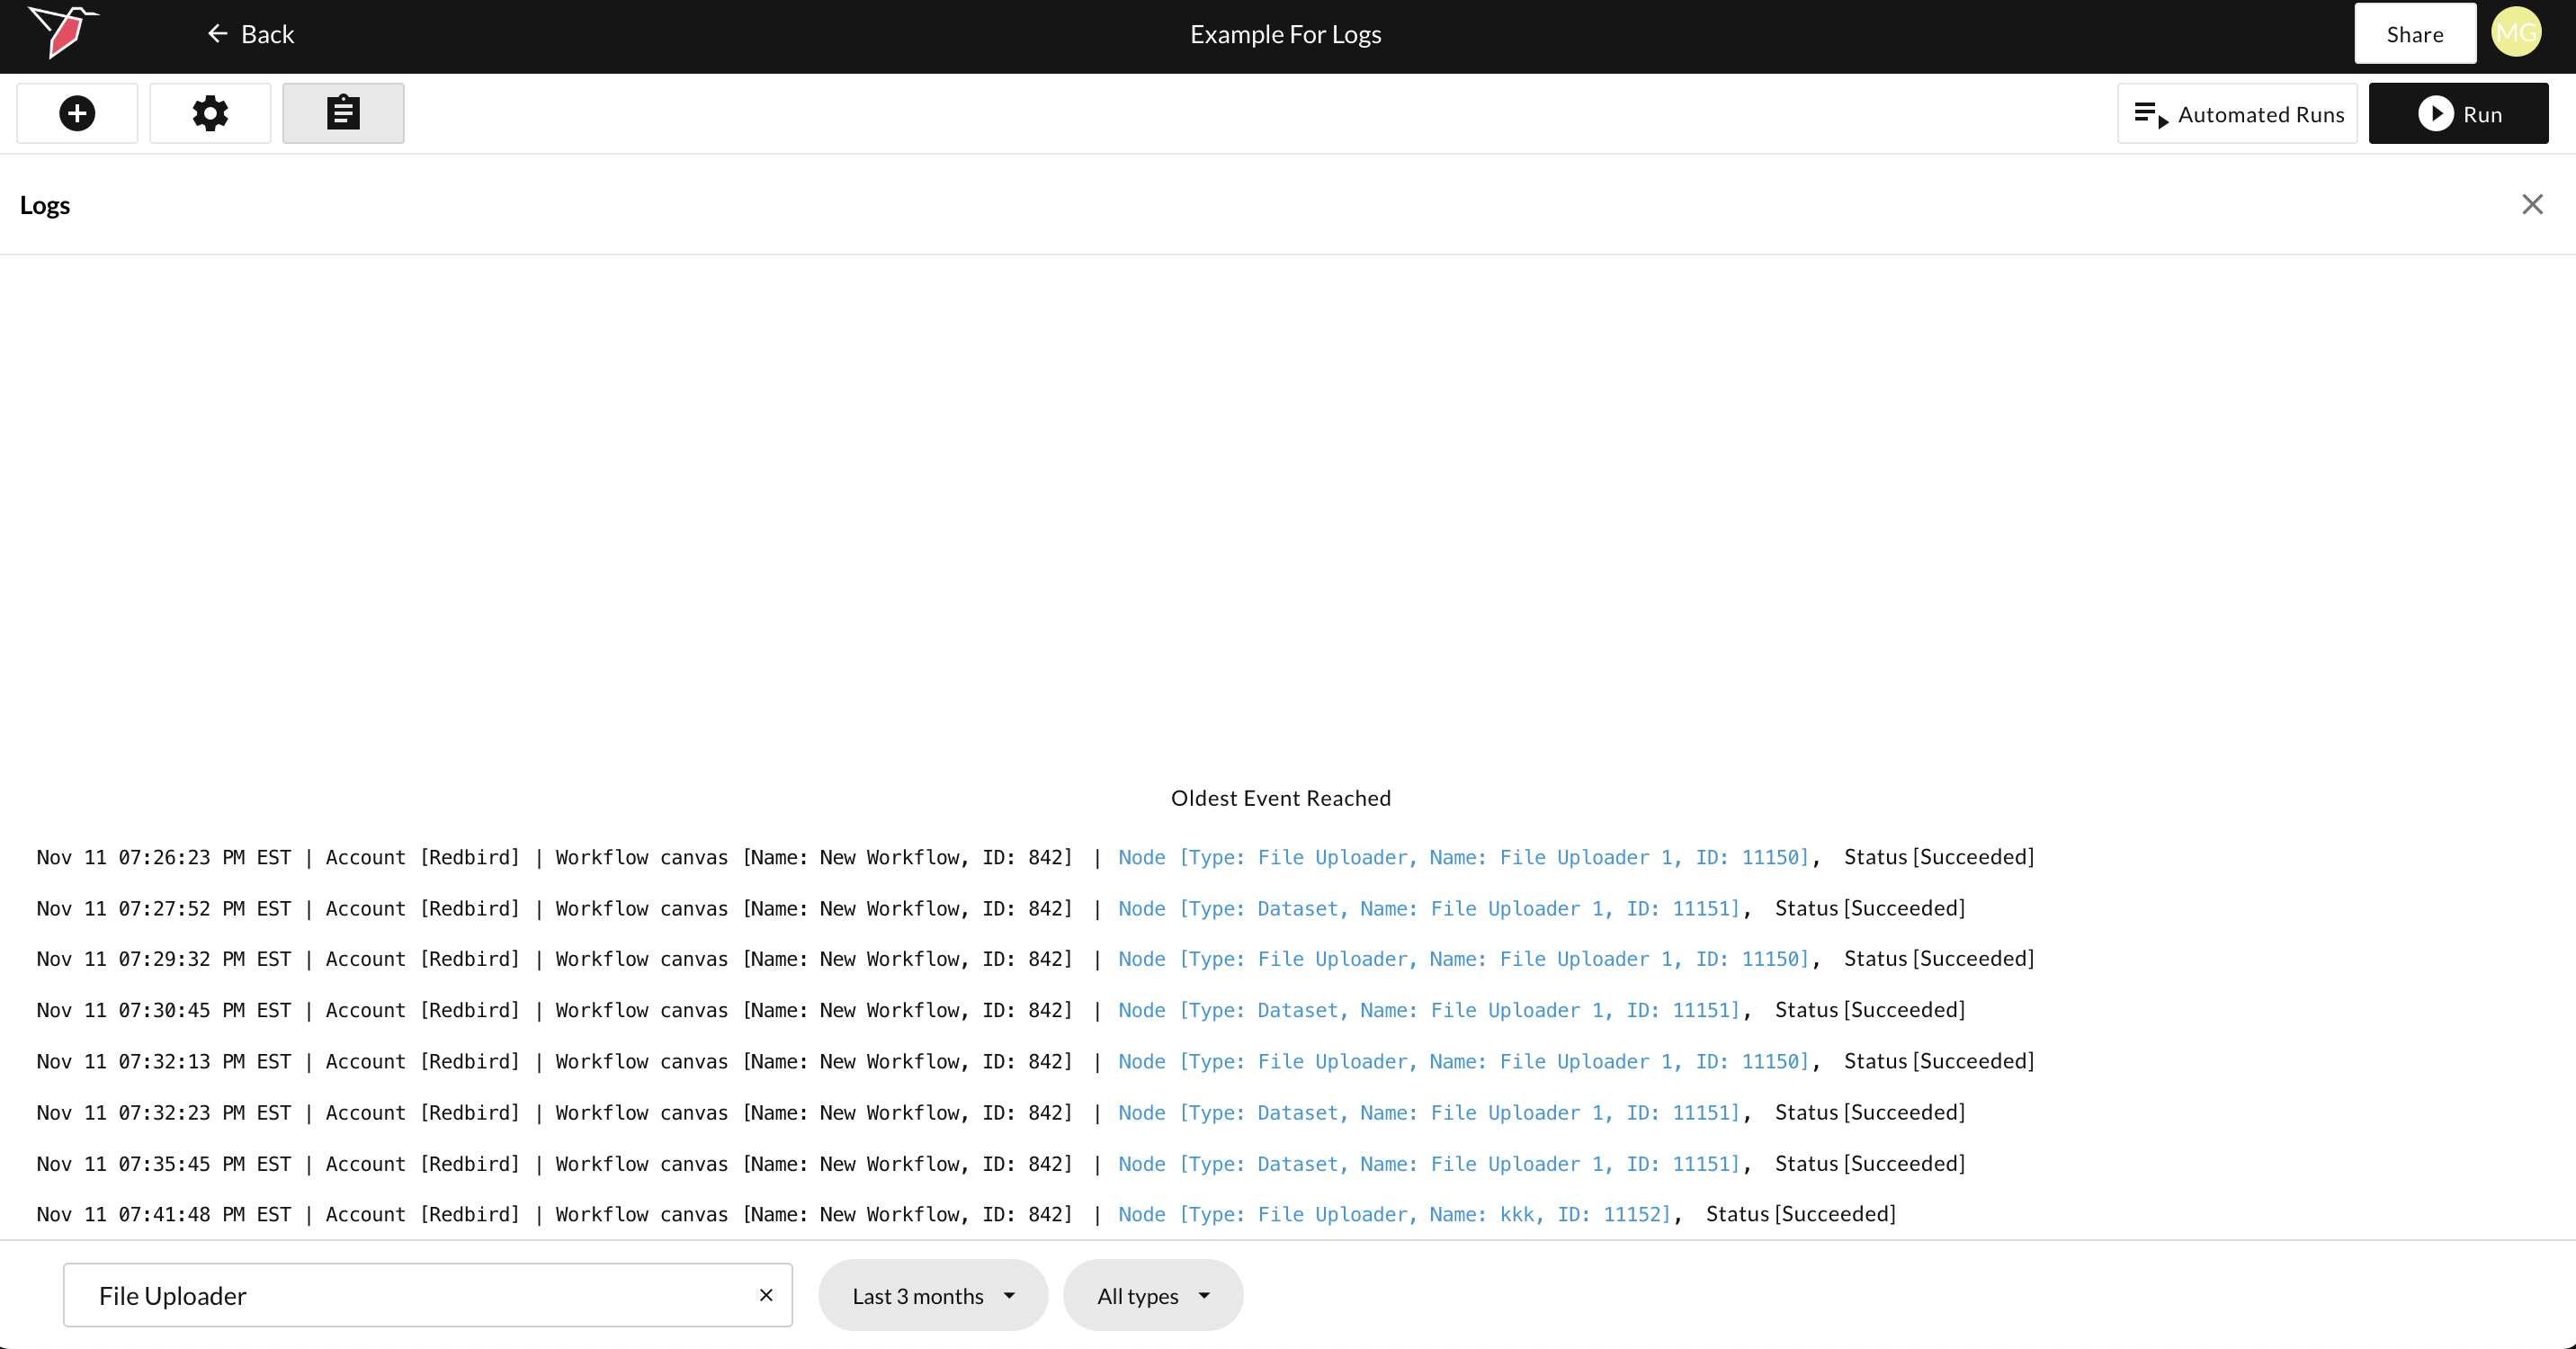
If you’d like more detailed information about the run, you can view the event logs for each node on the workflow canvas. Typically, there will be one log per node run showing whether it succeeded or failed, along with an explanation if it failed. This helps with troubleshooting and guiding users toward the necessary adjustments or fixes to ensure the node runs successfully.
For workflow runs involving multiple nodes, you will see logs for each node that has run.
Some nodes may have multiple log entries per run — for example, when each entry represents a different stage of the process or an iteration within the run.
Accessing the logs
To access the logs, click the log icon on any canvas.
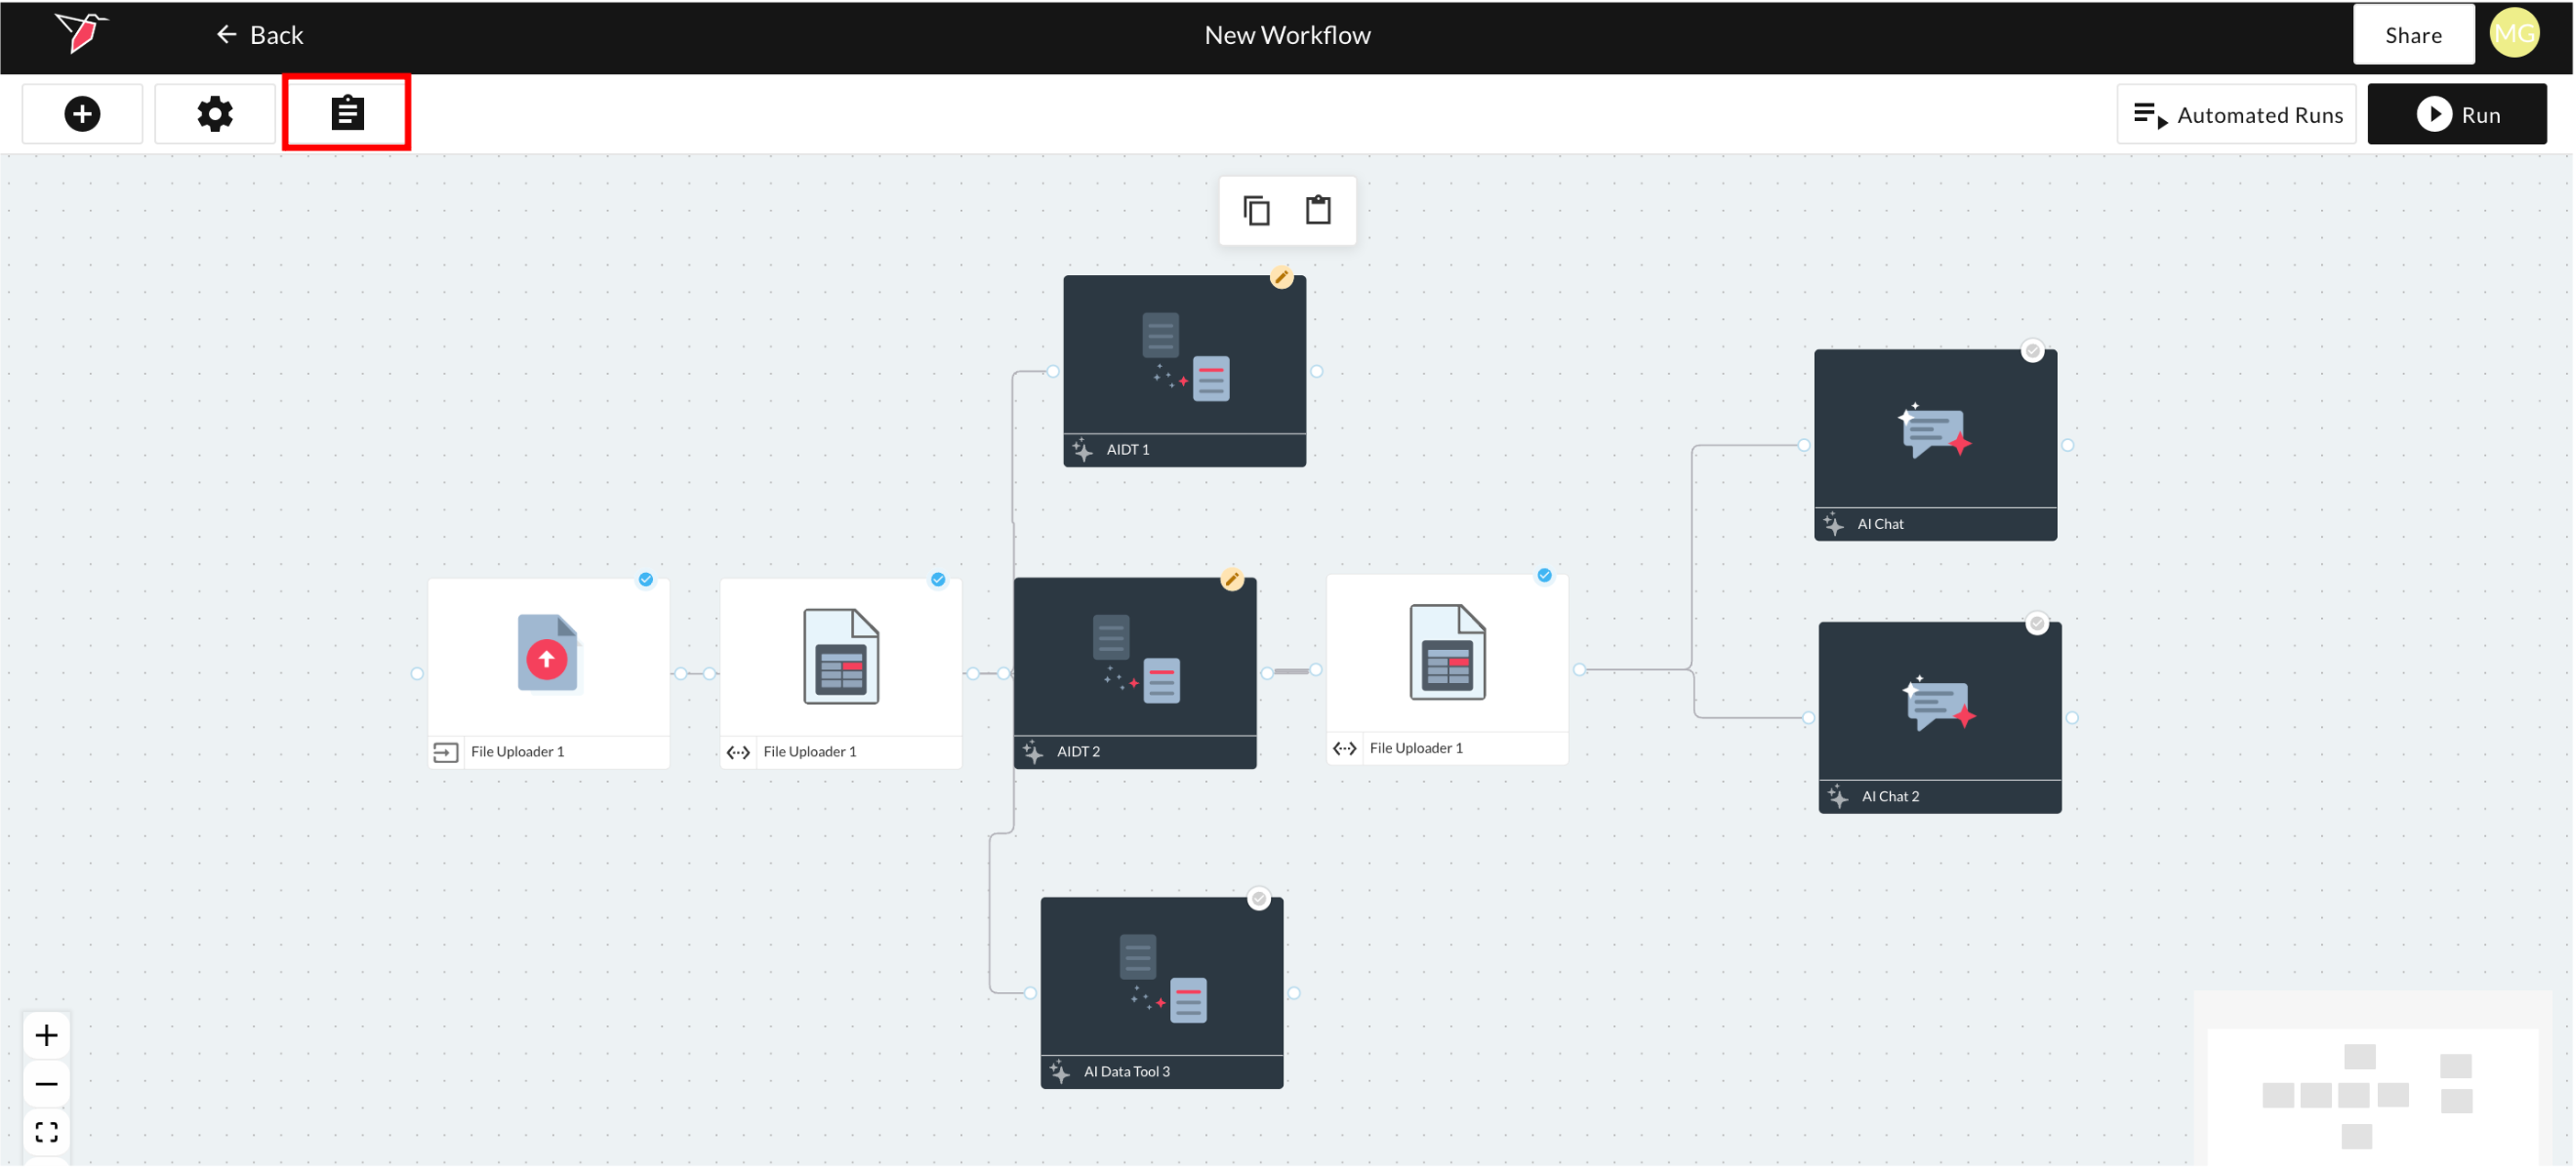
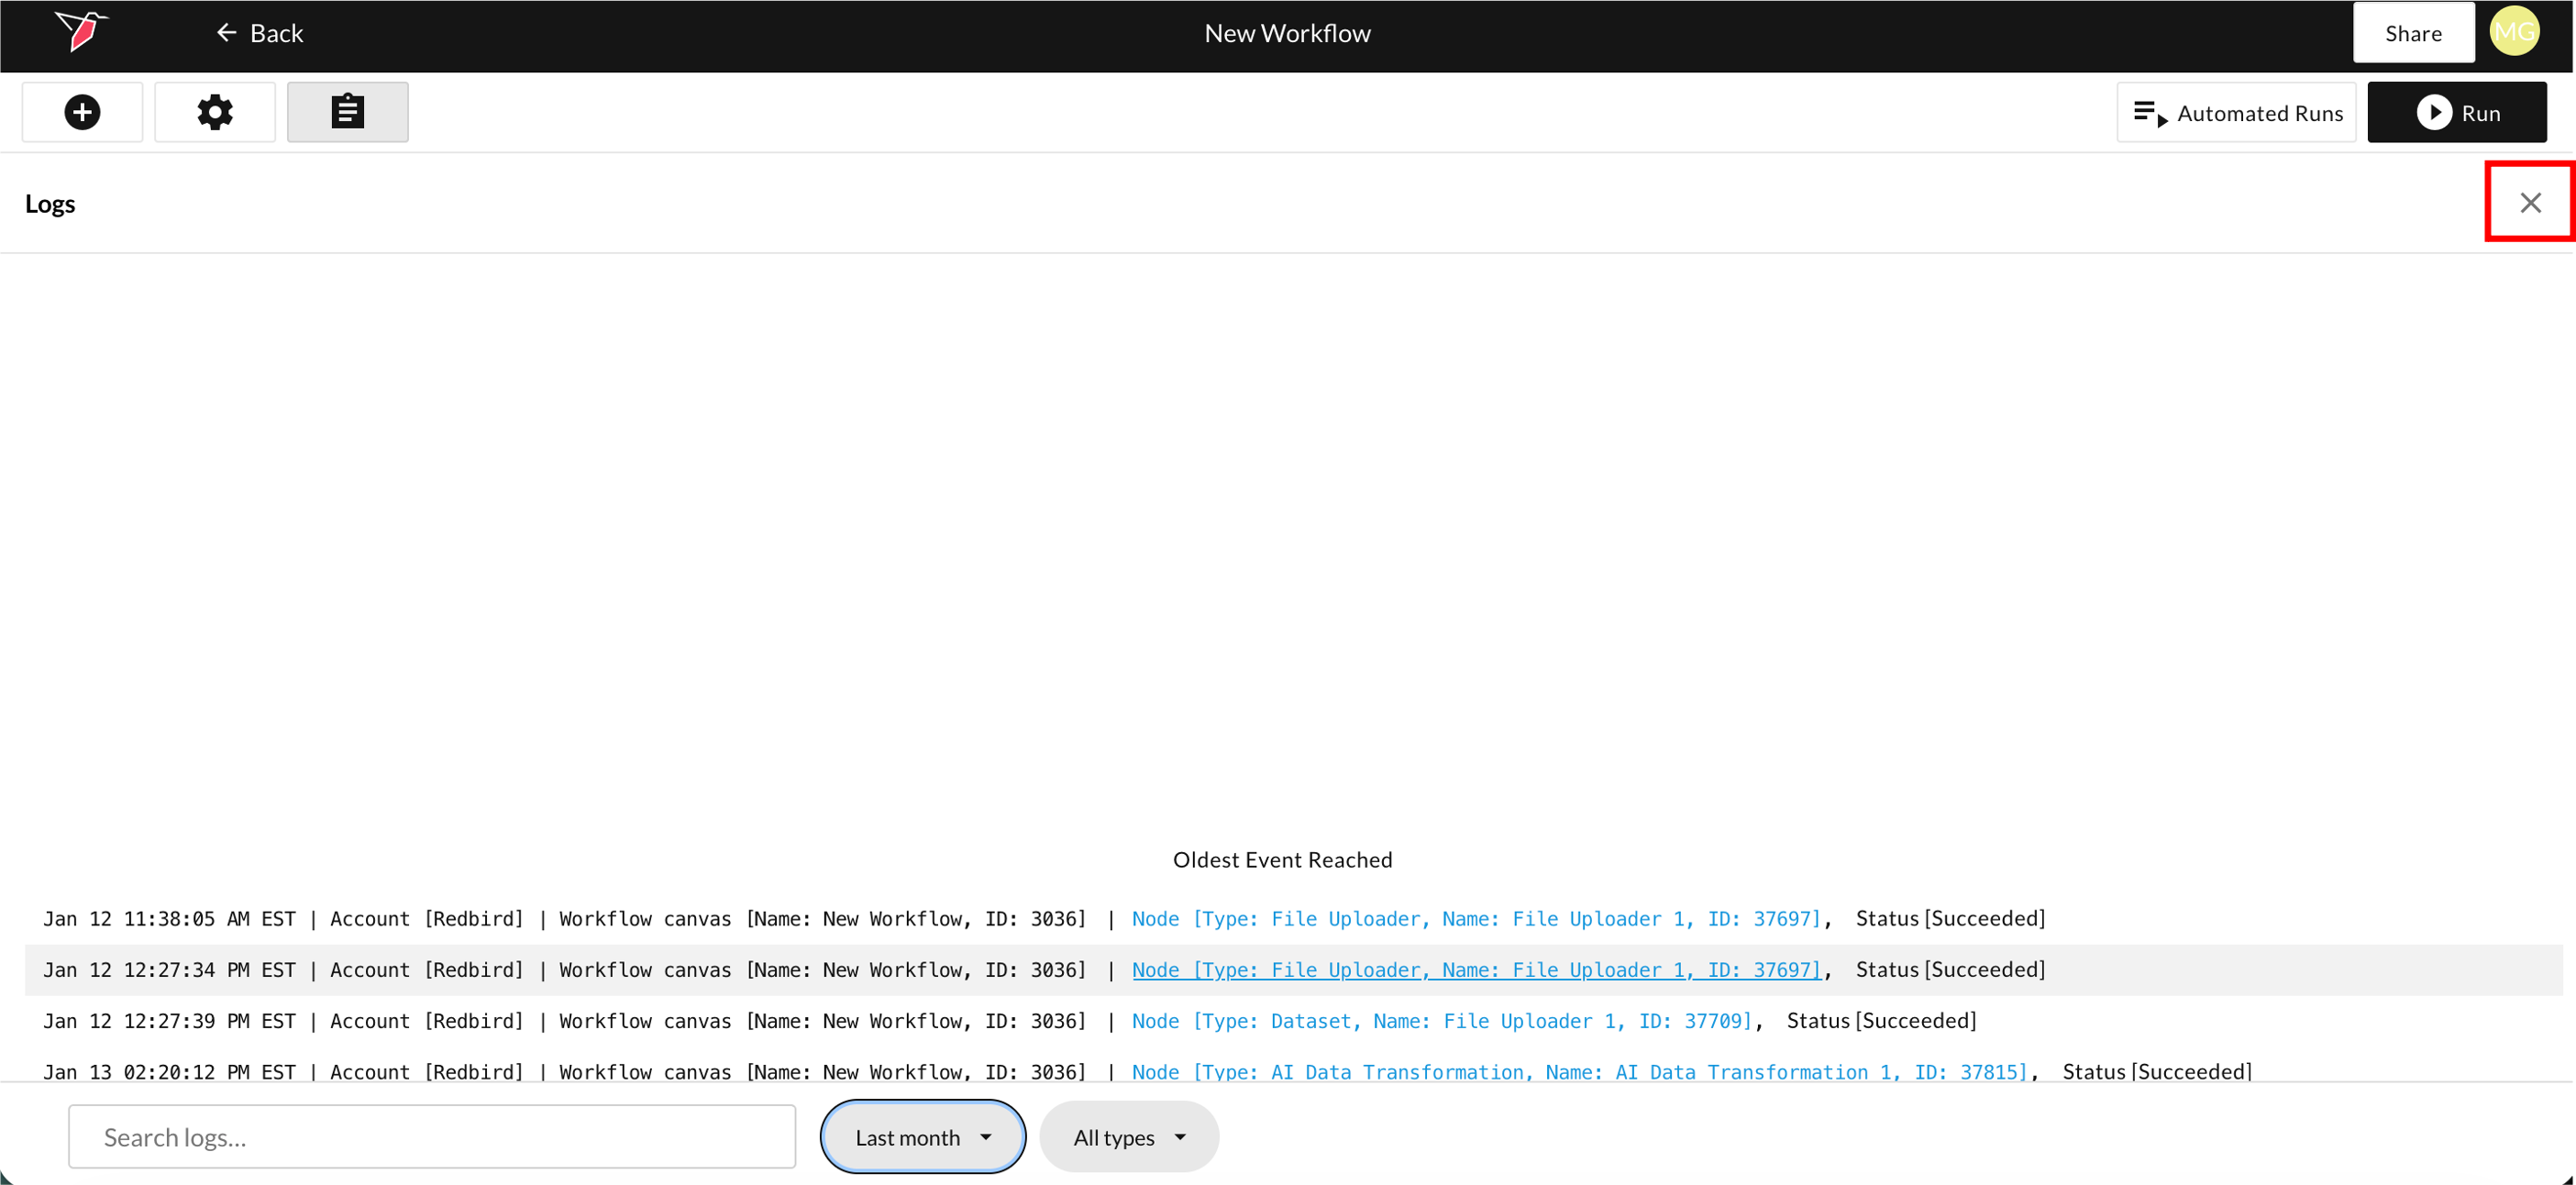
This will open the log window, where you can view logs for any nodes that have previously run. The logs displayed are scoped to all runs on that canvas. To close the window, click the X icon on the right-hand side.
Interpreting the logs
The logs follow a standard structure, with each section separated by a pipe symbol (“|”). Below is an example log entry, followed by a legend explaining what each section represents:
Example Log Entry:
Nov 07 07:40:57 PM EST | Account [Redbird] | Workflow canvas [Name: New Workflow, ID: 842] | Node [Type: Amazon Prime Video Direct, Name: Amazon Prime Video Direct 1, ID: 11109], Status [Failed] | The process failed because a required file was not found, preventing the collection task from completing.
Log Structure:
- Date and time stamp of when the node finished running (EST)
- Redbird account name
- Workflow canvas name and ID
- Node type, name, and ID — This section appears in blue for successful runs and red for failed runs
- Status (Success or Failed)
- Summary of the issue (if the run failed)
Finding the relevant logs
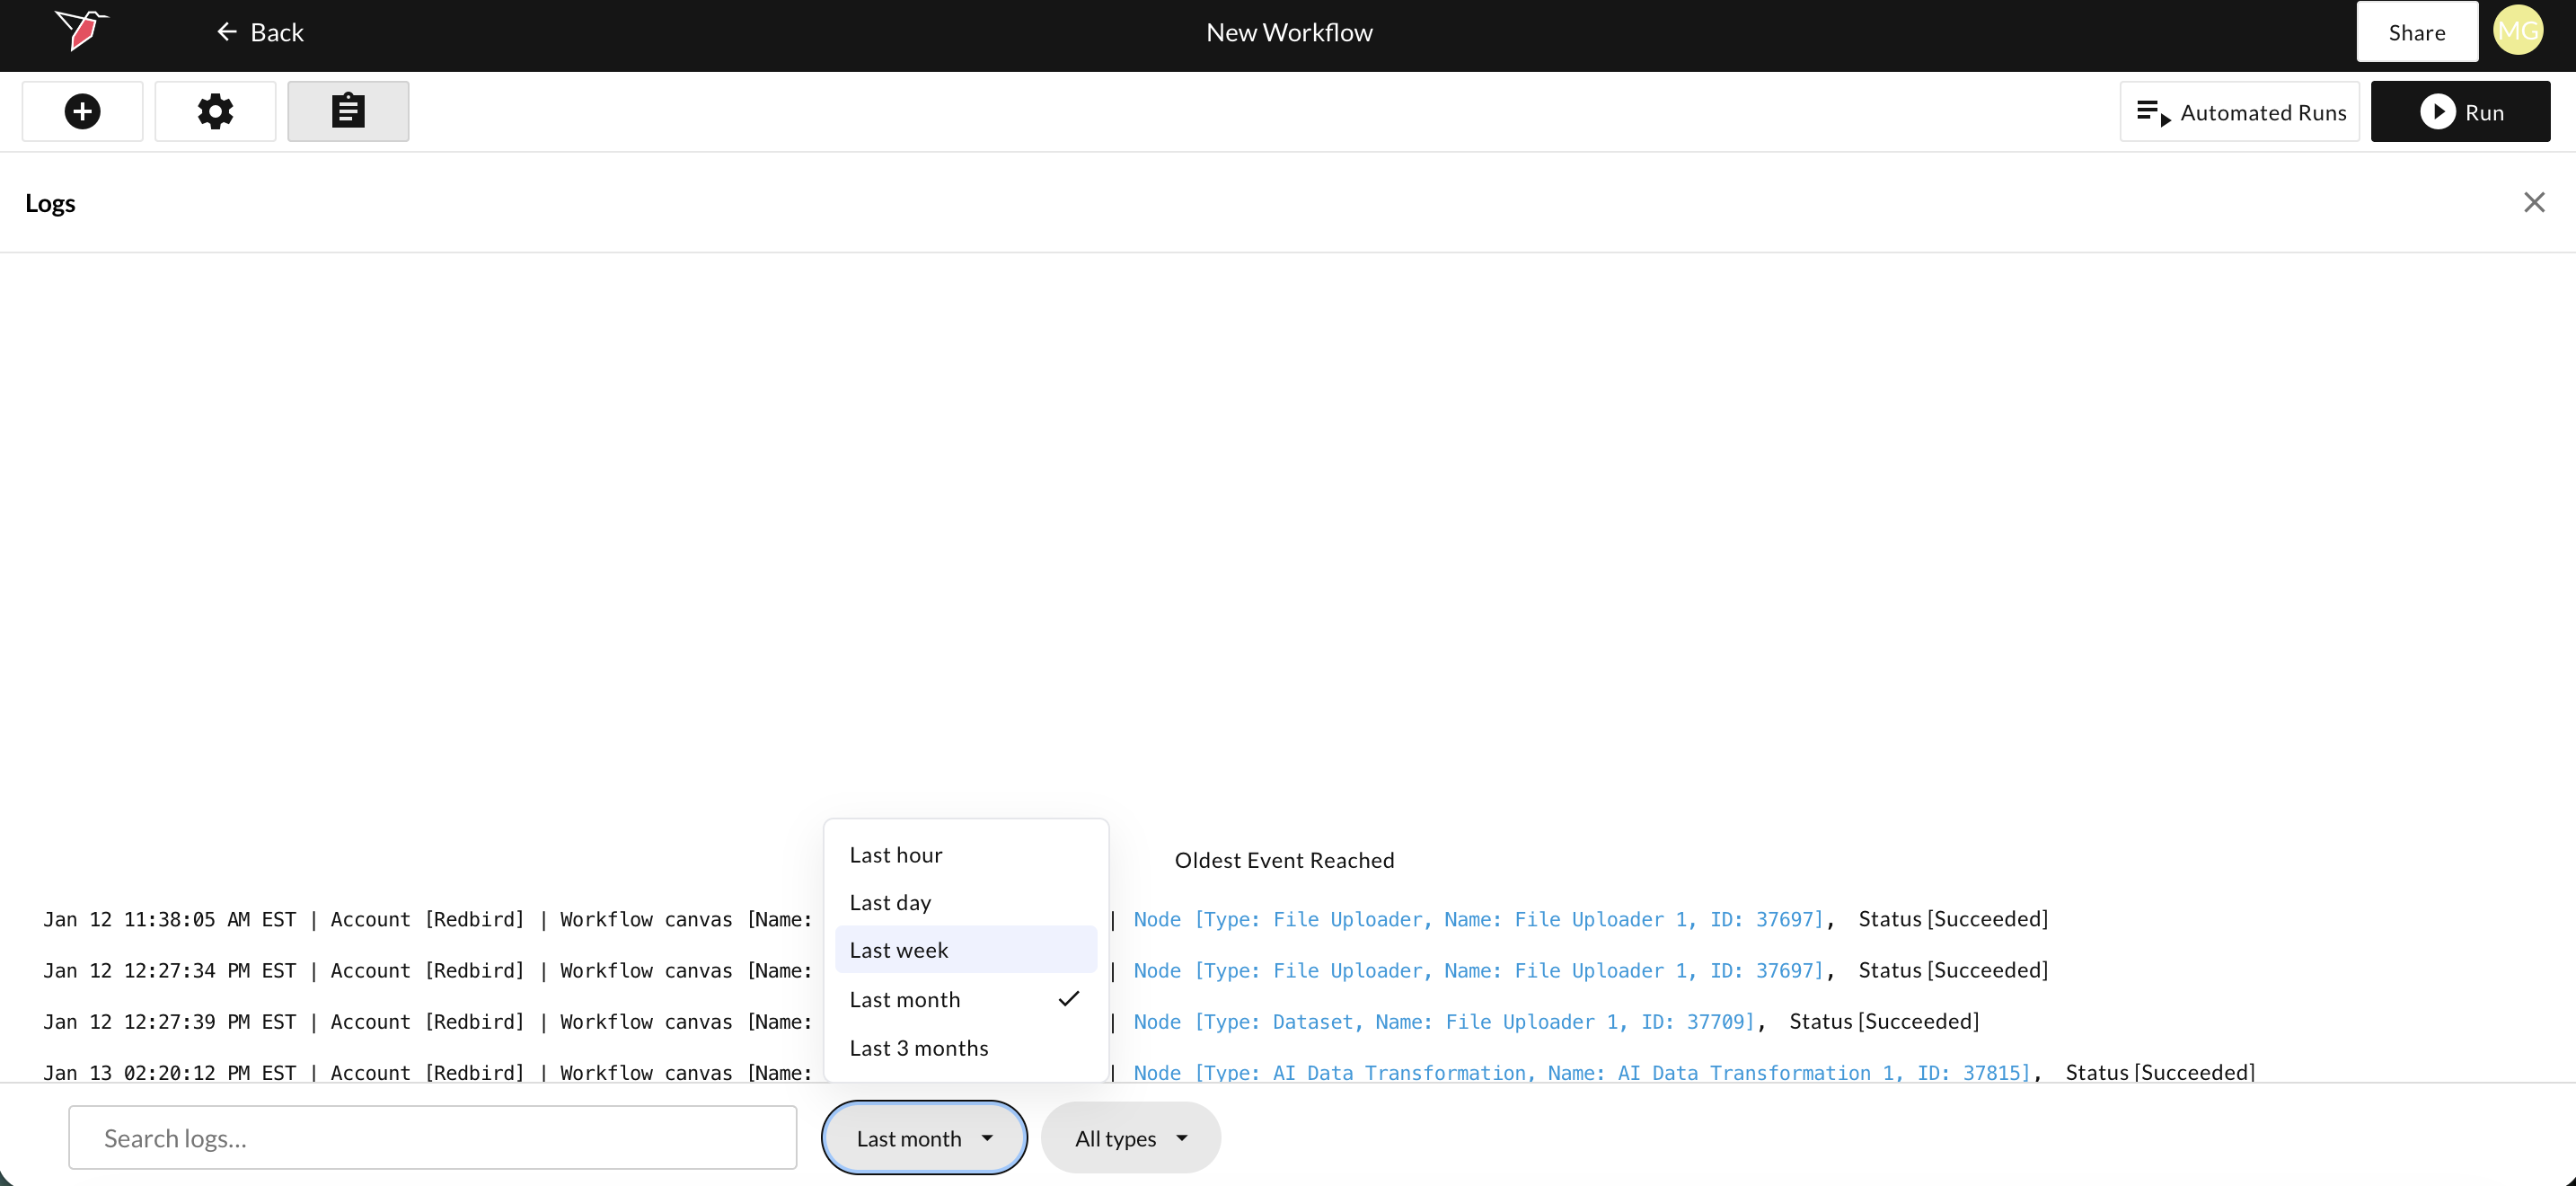
The most recent logs appear at the bottom of the screen, and you can scroll up to view earlier entries. By default, the logs are filtered to show only those that occurred within the last day. You can adjust this by selecting a different date range using the date filter located at the bottom of the page. You can choose from the following options:
- Last hour
- Last day
- Last week
- Last month
- Last 3 months
You can also narrow down the logs shown to you by type using the log type filter at the bottom of the page. The available options are:
- All types (default)
- Succeeded
- Failed
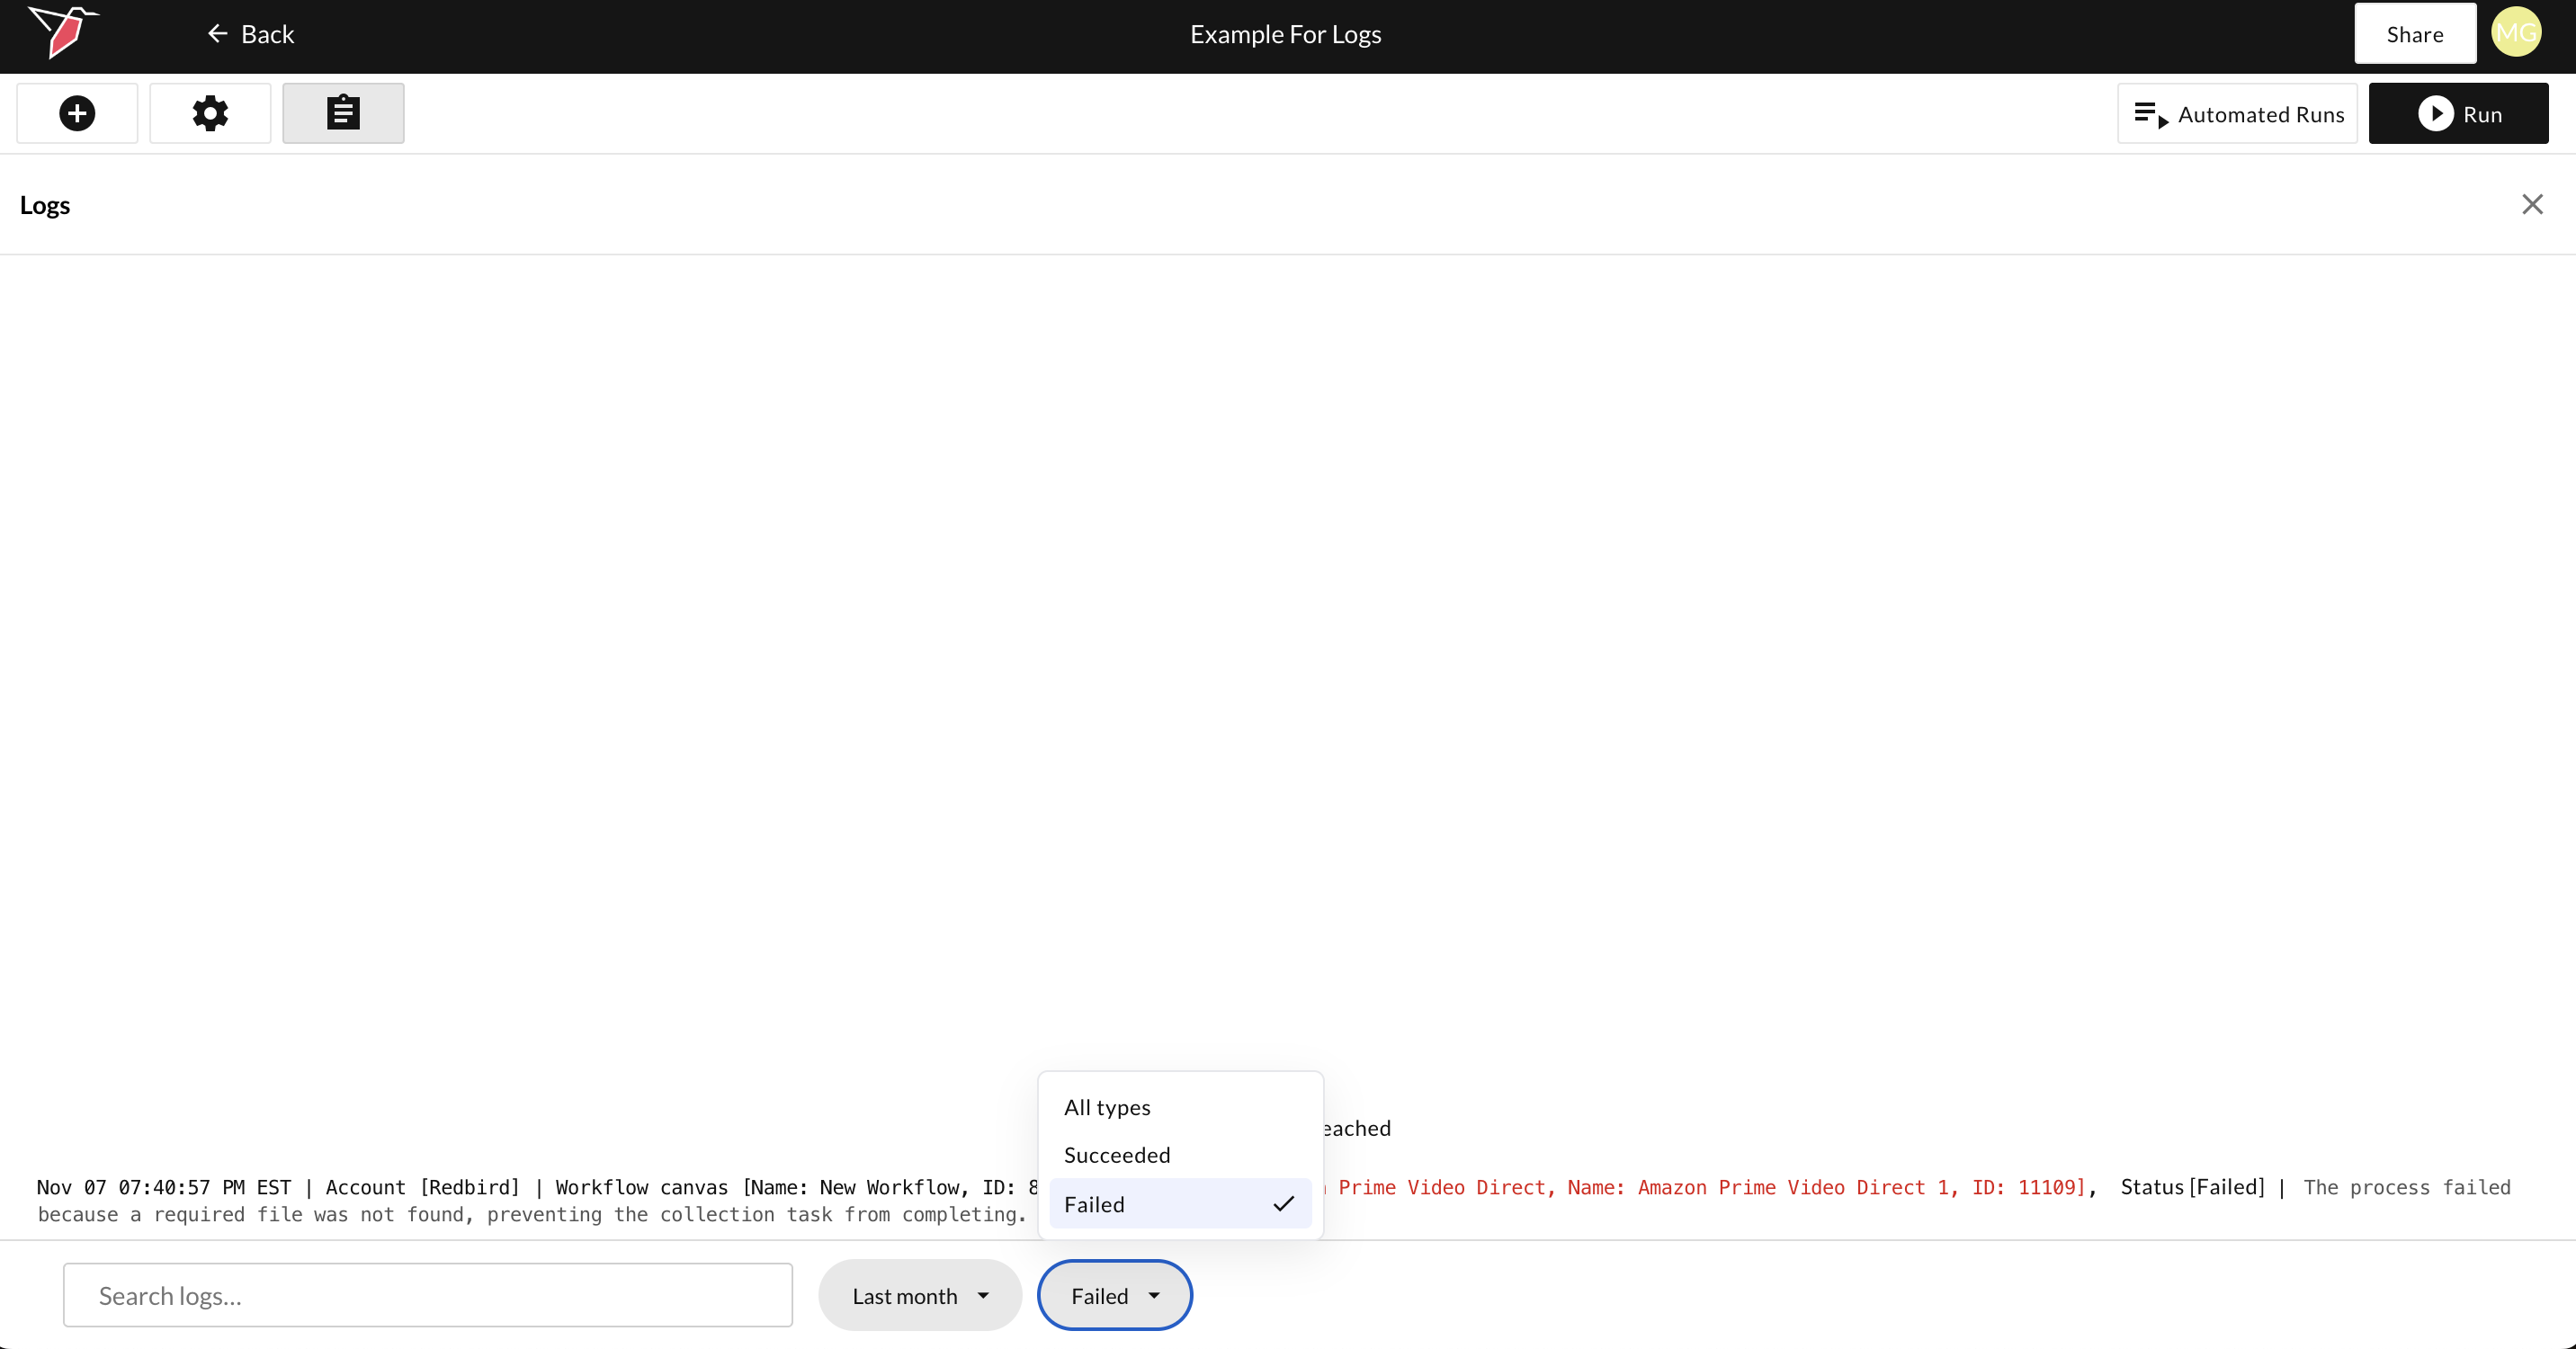
You can also use the search box at the bottom to search for any key terms, including the node name, node type, specific error messages, and more.