AI Agents - Data Visualization Agent
Introduction
The Data Visualization Agent allows users to effortlessly visualize their data with charts, tables, and other visualizations based on natural language prompts in an AI Chat. Users can let the Data Visualization Agent choose the best visualization to represent the data being analyzed, or they can describe the characteristics of the visualization they are looking for.
Connecting Your Data
In order to use the Data Visualization Agent, first, you will need to add an AI Chat node to the canvas by selecting it from the Left Side Panel and dragging it onto the canvas. Next step is to connect a data source to your AI Chat node - see here for more info.
Getting Started Using the Data Visualization Agent
- Once you've connected the data you want to analyze to the chat environment, make sure the Data Visualization agent is toggled on in the resources panel in the AI Chat.
- Once your data and agent are set up, you can easily start using the Data Visualization agent by asking questions in natural language. Simply type your prompt in the prompt box at the bottom of the chat view.
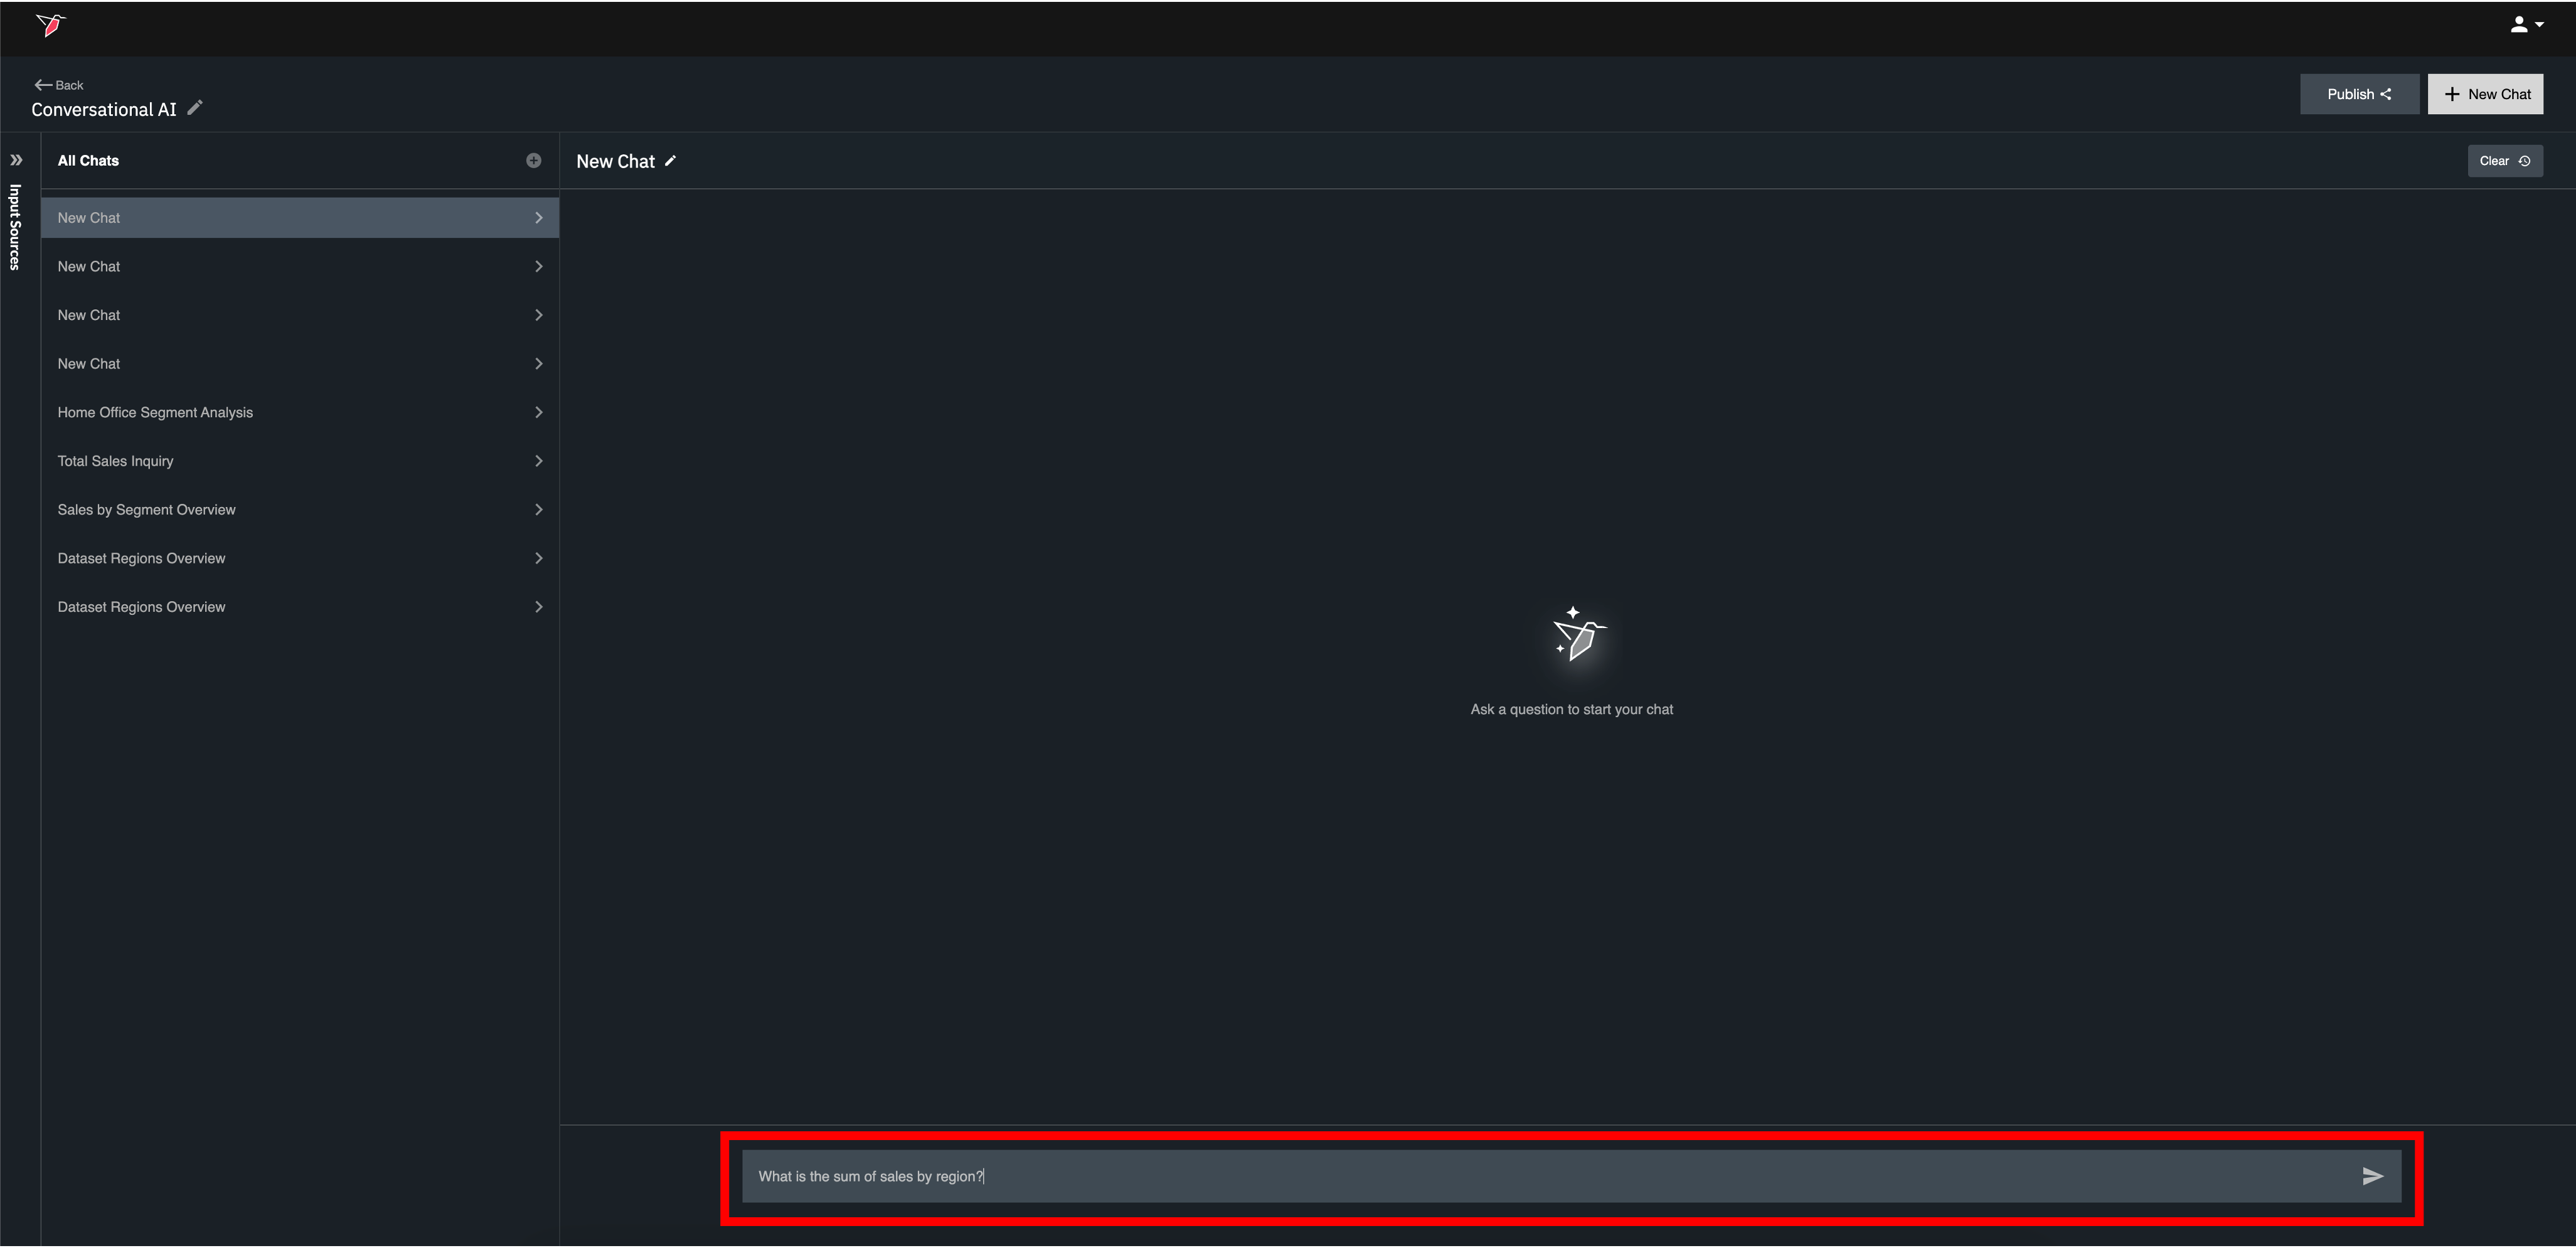
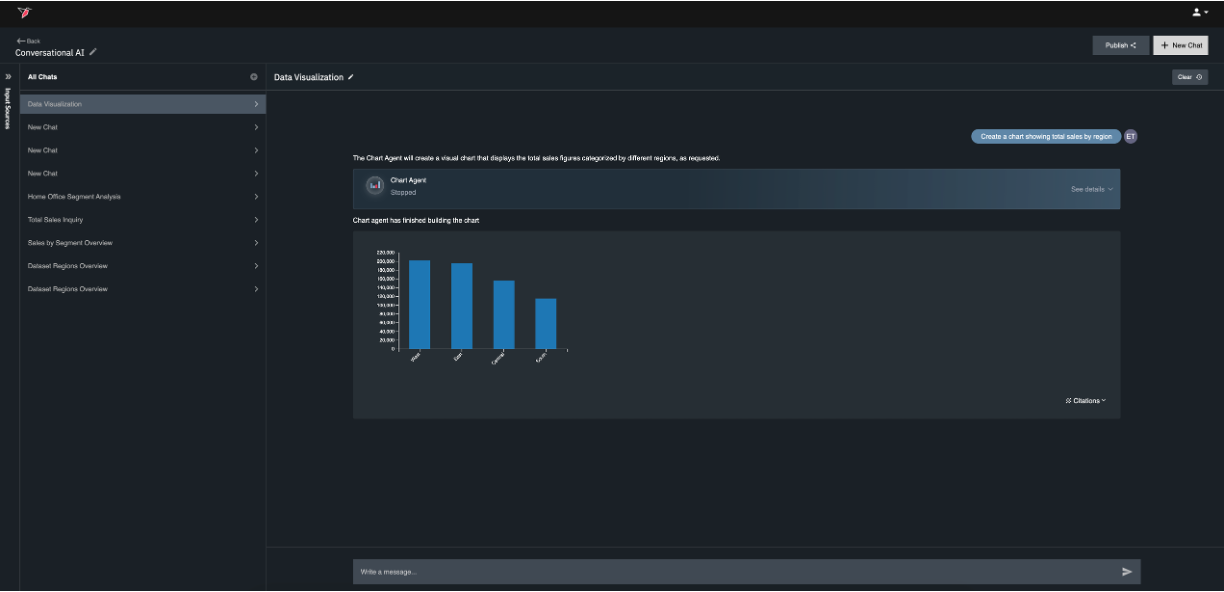
- The Data Visualization Agent will respond to your question with a data visualization output, as well as citations that specify the data assets and queries used to create the output.
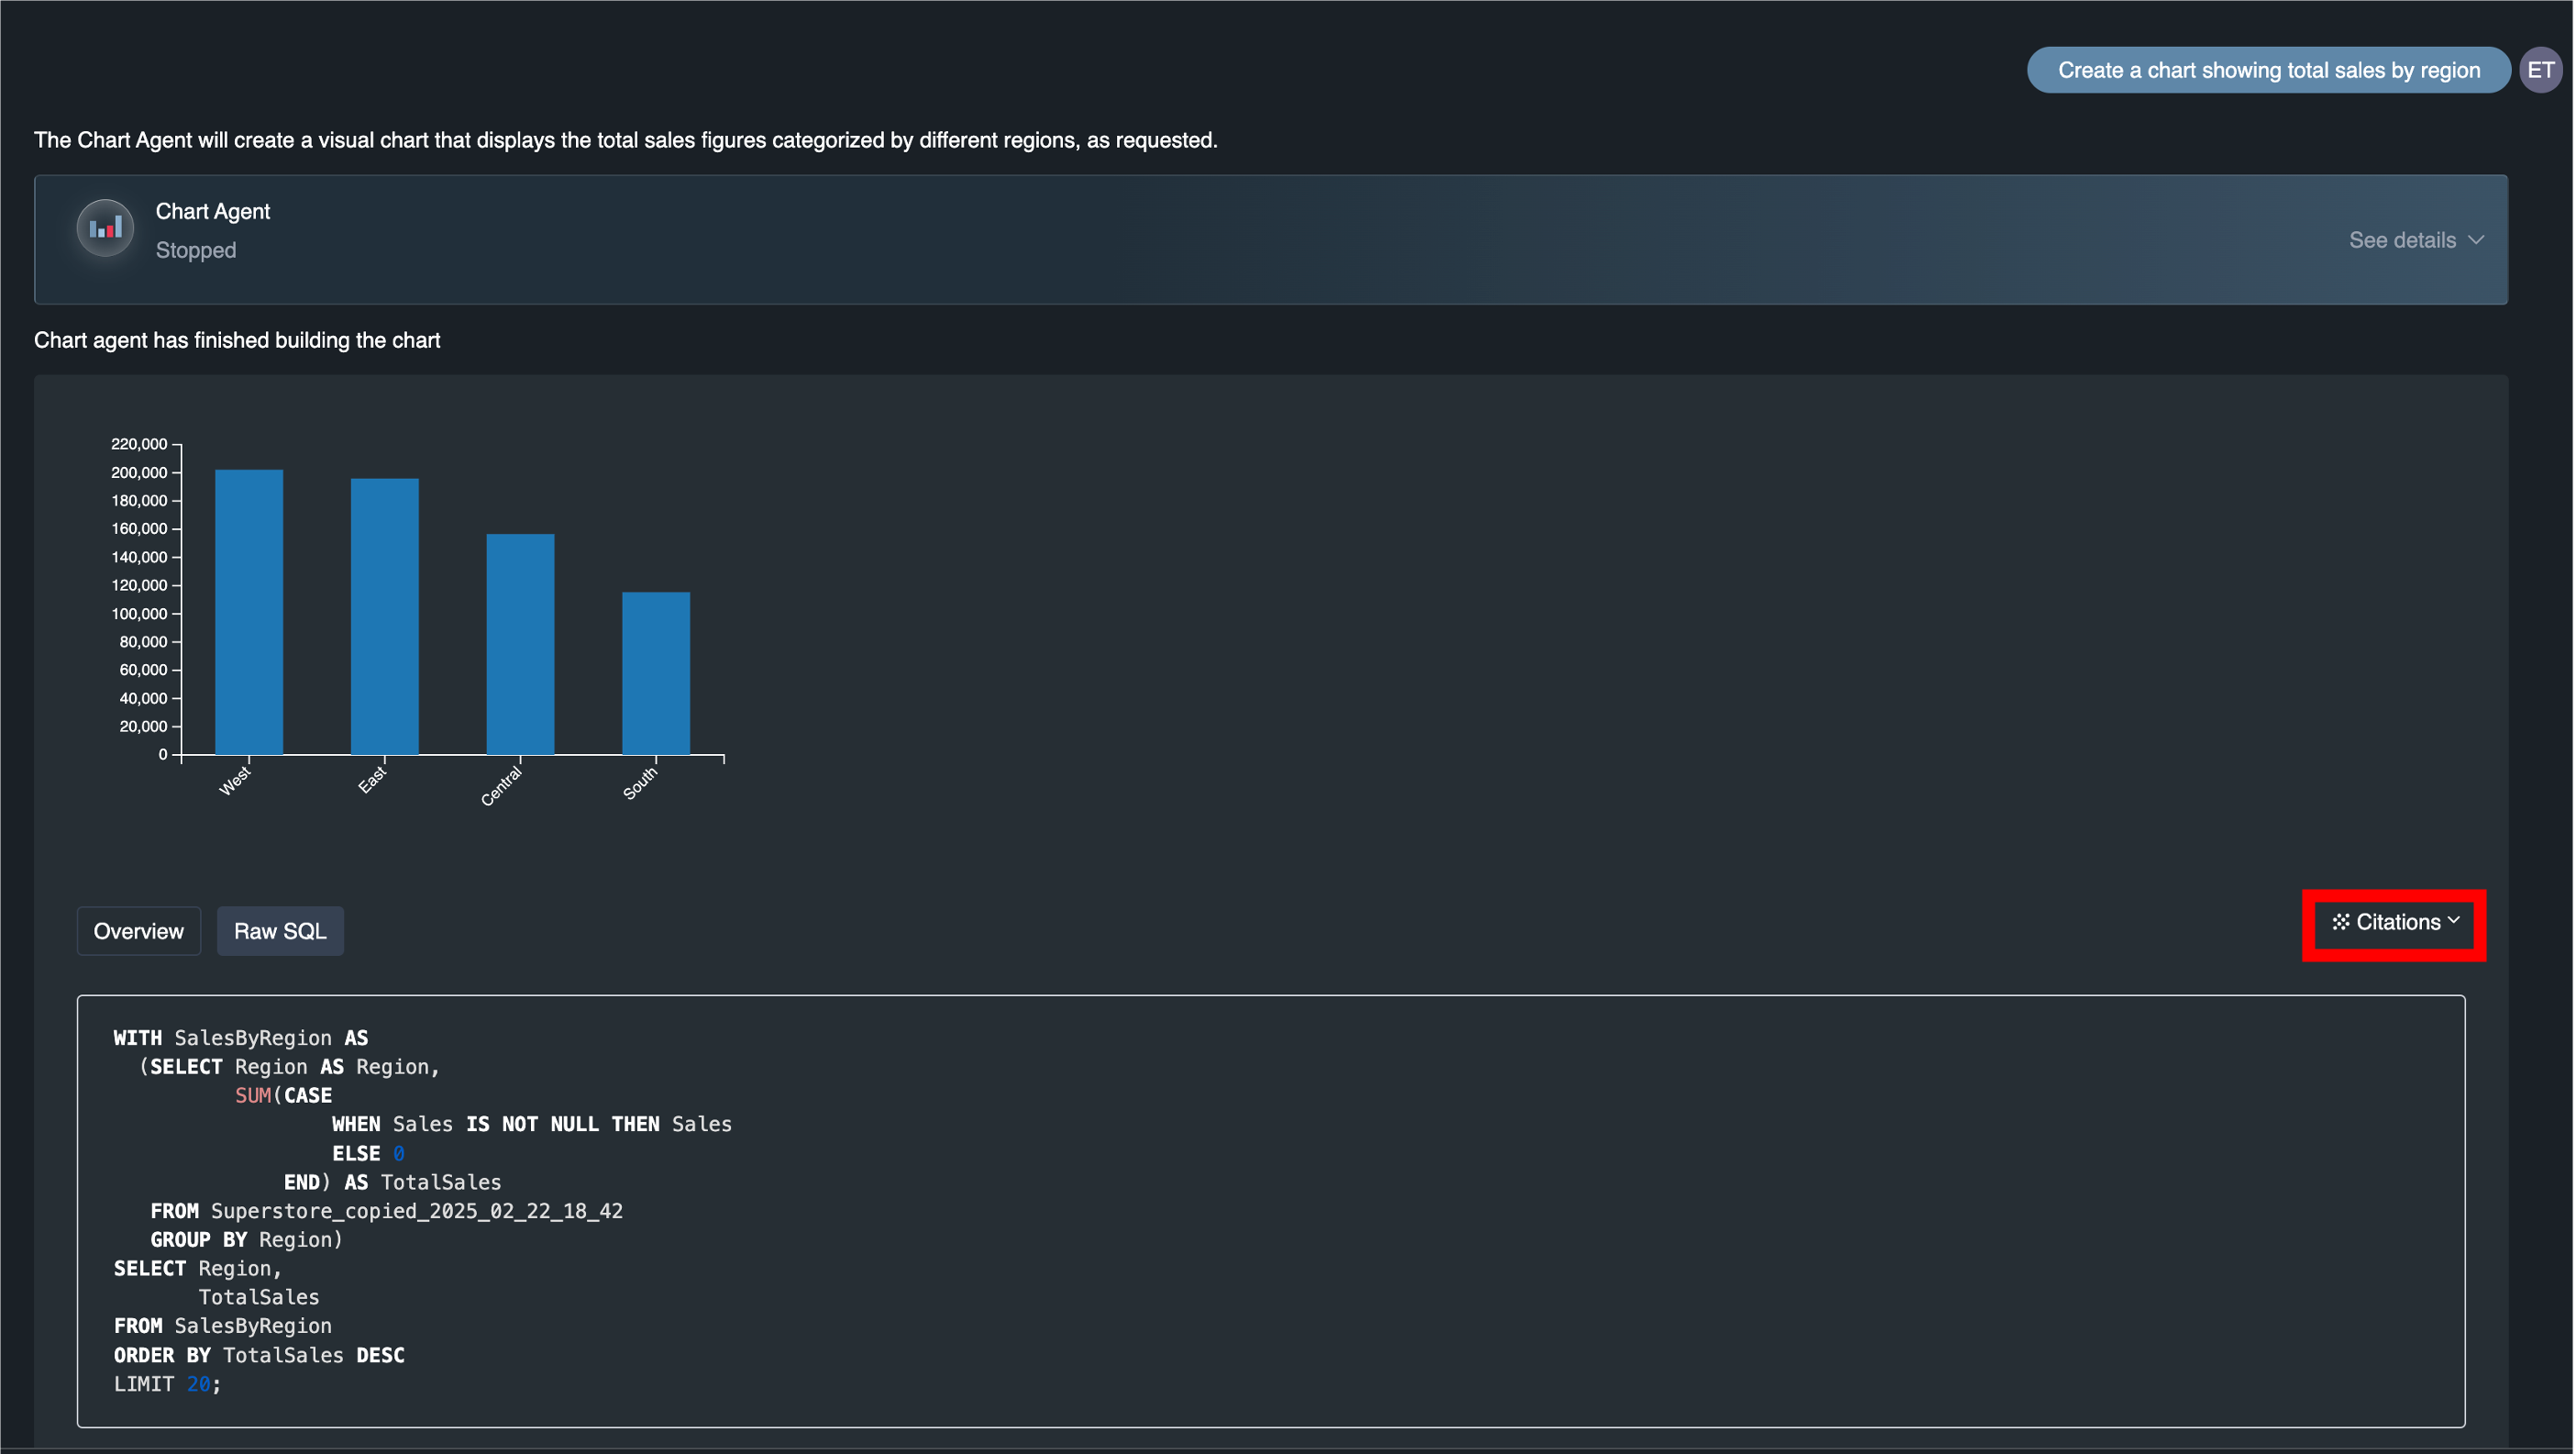
- You can access citation details by clicking expand on the 'Citations' link below the answer. Within the expanded citation details, click the 'Overview' tab to view a less technical summary of the approach and click the 'Raw SQL' tab to view the actual SQL query that was executed.
Updated 5 months ago
What’s Next
Did this page help you?