Exploring Redbird Datasets
Overview
Once a dataset has been created in Redbird, you may want to explore its contents at a top level. This can help you quickly extract basic insights from your data without needing to run in-depth analysis. It’s also a useful step to better understand whether any downstream workflows will need to be built on top of the data.
To access the Explore view for a dataset:
- Click on the dataset node to open the right-side panel.
- Click Explore. This will open a new tab where you can interact with and explore the dataset using the steps outlined below.
Viewing and Downloading Data
Once you are in the new Explore tab view, you can view your data in a table within Redbird or download it as a file to work with outside of Redbird. Both of these options live within the Table tab on the Explore view.
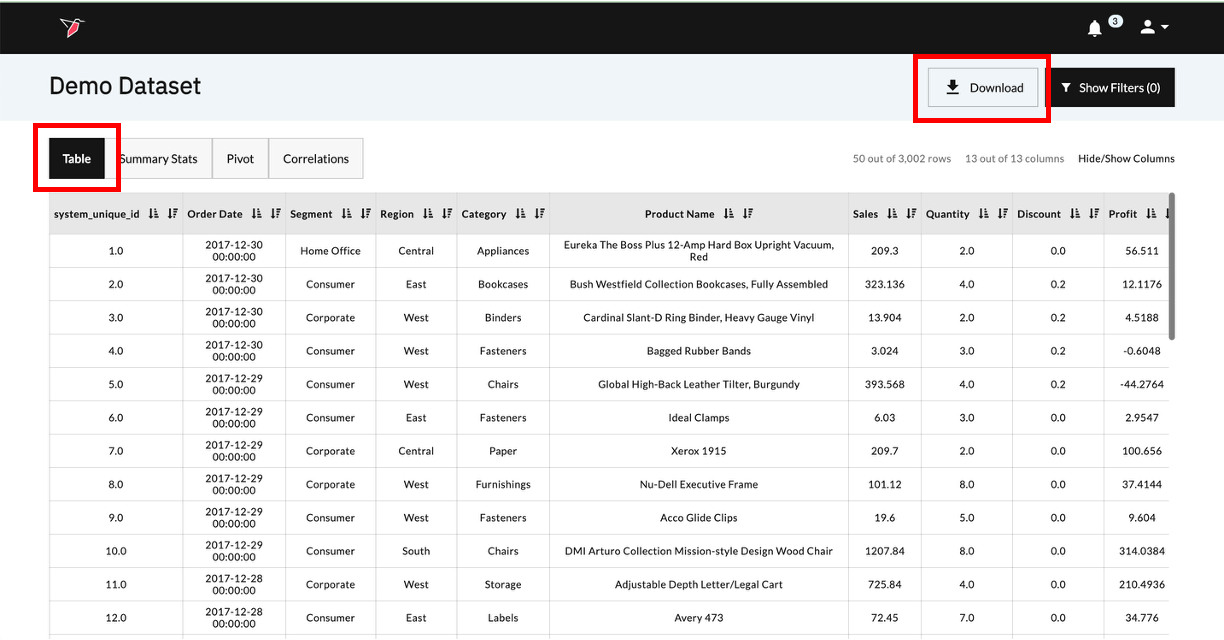
- Initially, the table view will load up to the first 50 rows and all of the columns in your dataset.
- If you want to view more rows, just scroll to the bottom of the table and click on Load More. This will load the next 50 rows from the dataset into the table view area.
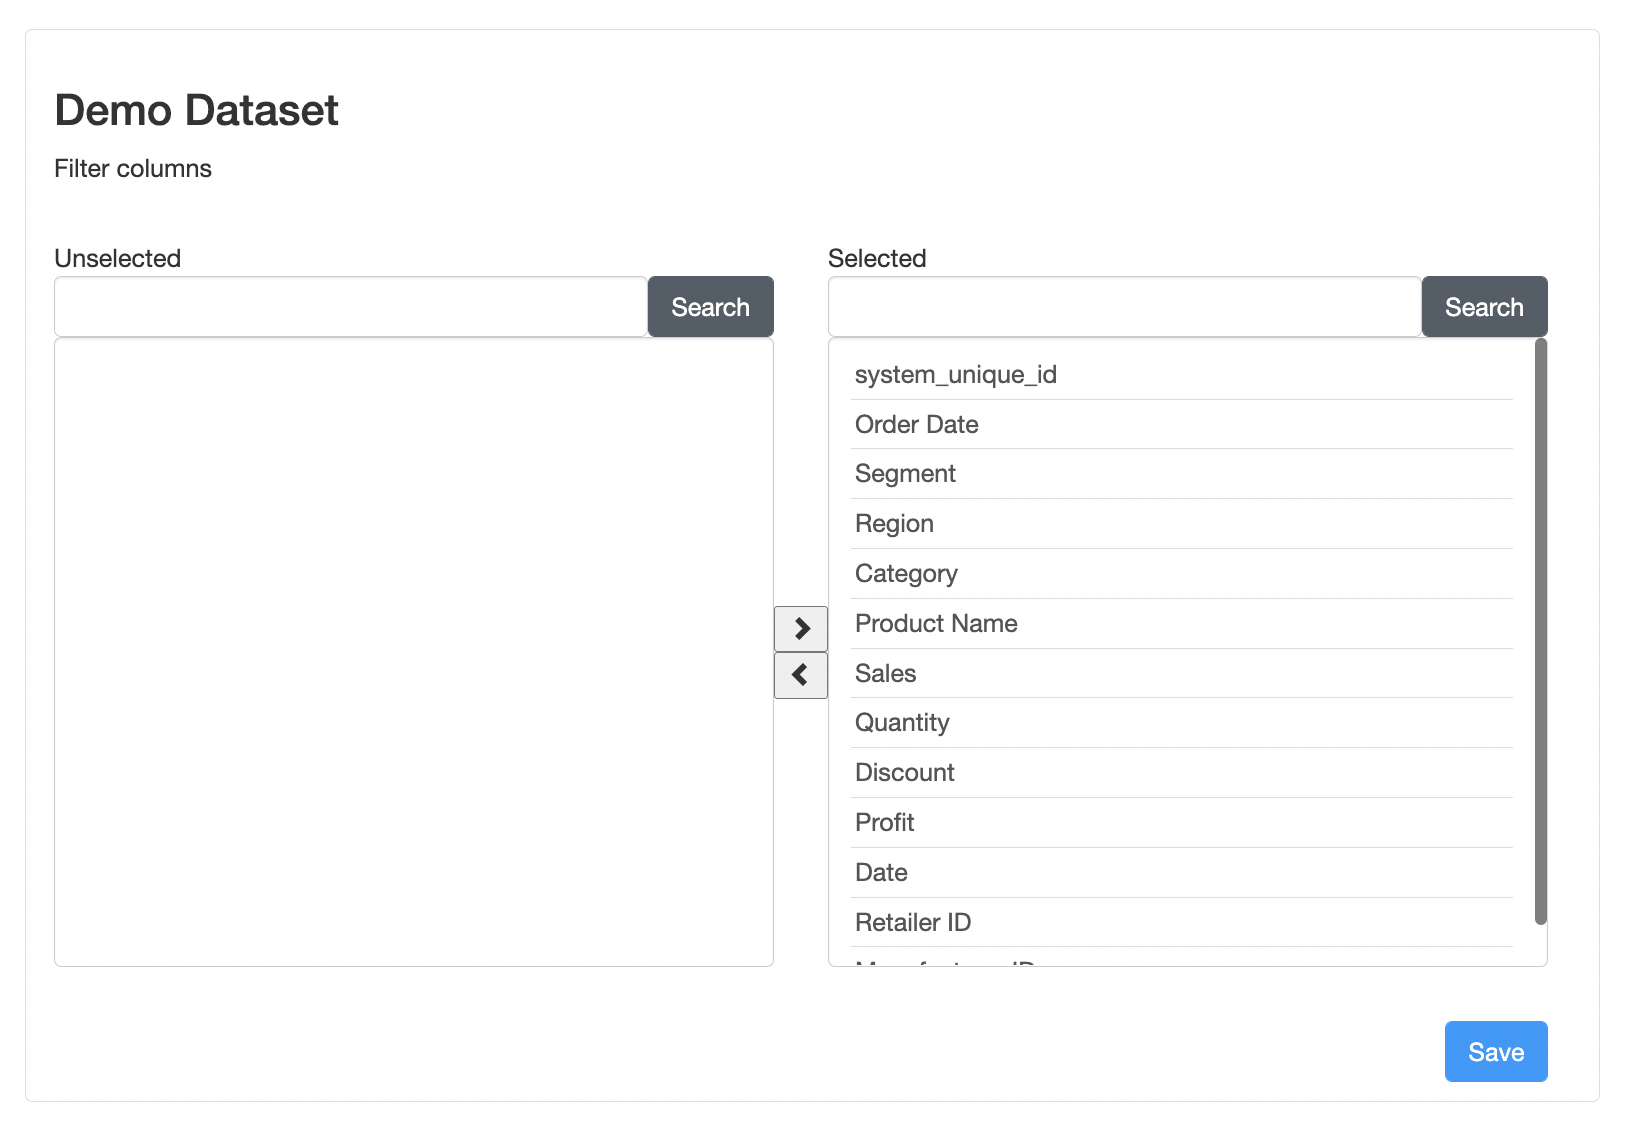
- If you want to hide columns currently in the table or show columns not currently in the table, click on Hide/Show located on the top right area above the table. This will open a new window where you can select or deselect the viewable columns as desired by clicking the left arrow or right arrow buttons.
- Filtering
- You can filter the data displayed in the table viewer by adding filters to the Filters area at the top of the Explore view. Once you have added and configured your desired filters, just click Apply Filters at the top right corner of the filters area. The table viewer will update to reflect the filtered dataset below.
- Filters can be removed individually by clicking the icon next to each filter and applying the remaining filters once again by clicking Apply Filters. If you would like to clear all filters in bulk, just click Remove All Filters at the top right corner of the filters area. The table viewer will automatically update to reflect the original dataset with no filters applied after clicking Remove All Filters.
- Sorting
- You can sort the data displayed in the table viewer by clicking on the or buttons next to each column name. Clicking will sort the dataset rows in ascending order based on the values in the selected column, and clicking will sort in ascending order.
Top-level Exploration
Automated Summary Statistics
You can access summary statistics for the data within individual columns of your dataset, by clicking on the Summary Stats tab on the Explore view.
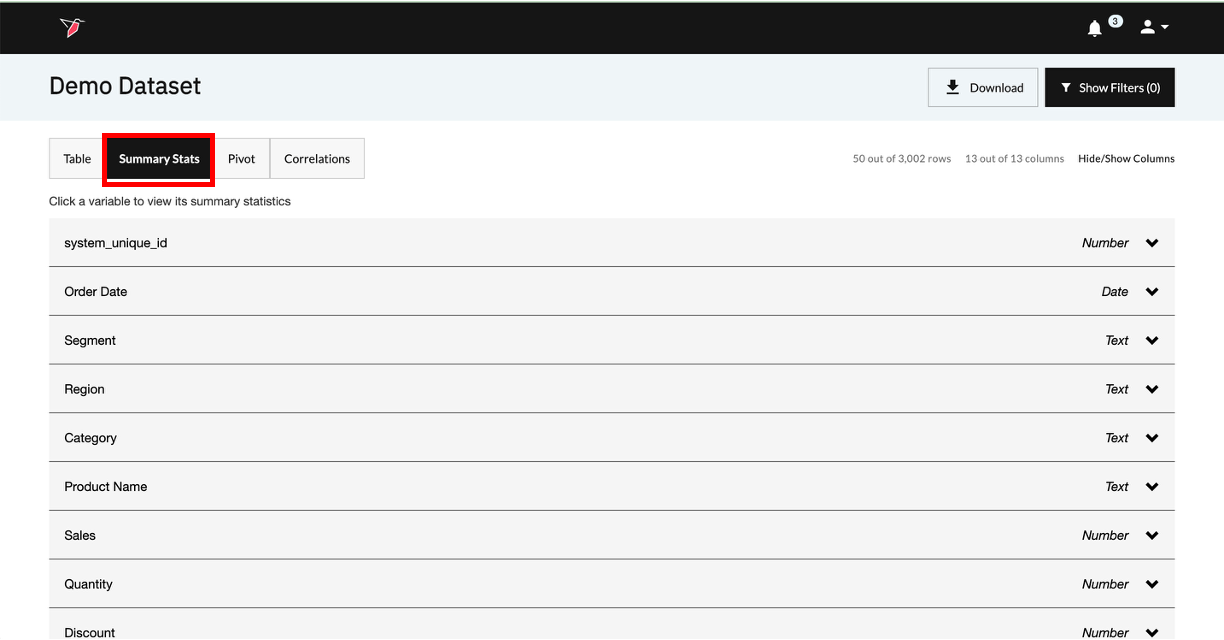
Summary statistics are calculated automatically, and can give you quick insight into the properties of your dataset. To access summary statistics for a given column, just click anywhere on the grey row to expand and show the information (clicking again collapses the information). The statistics shown vary by column type, and contain the following:
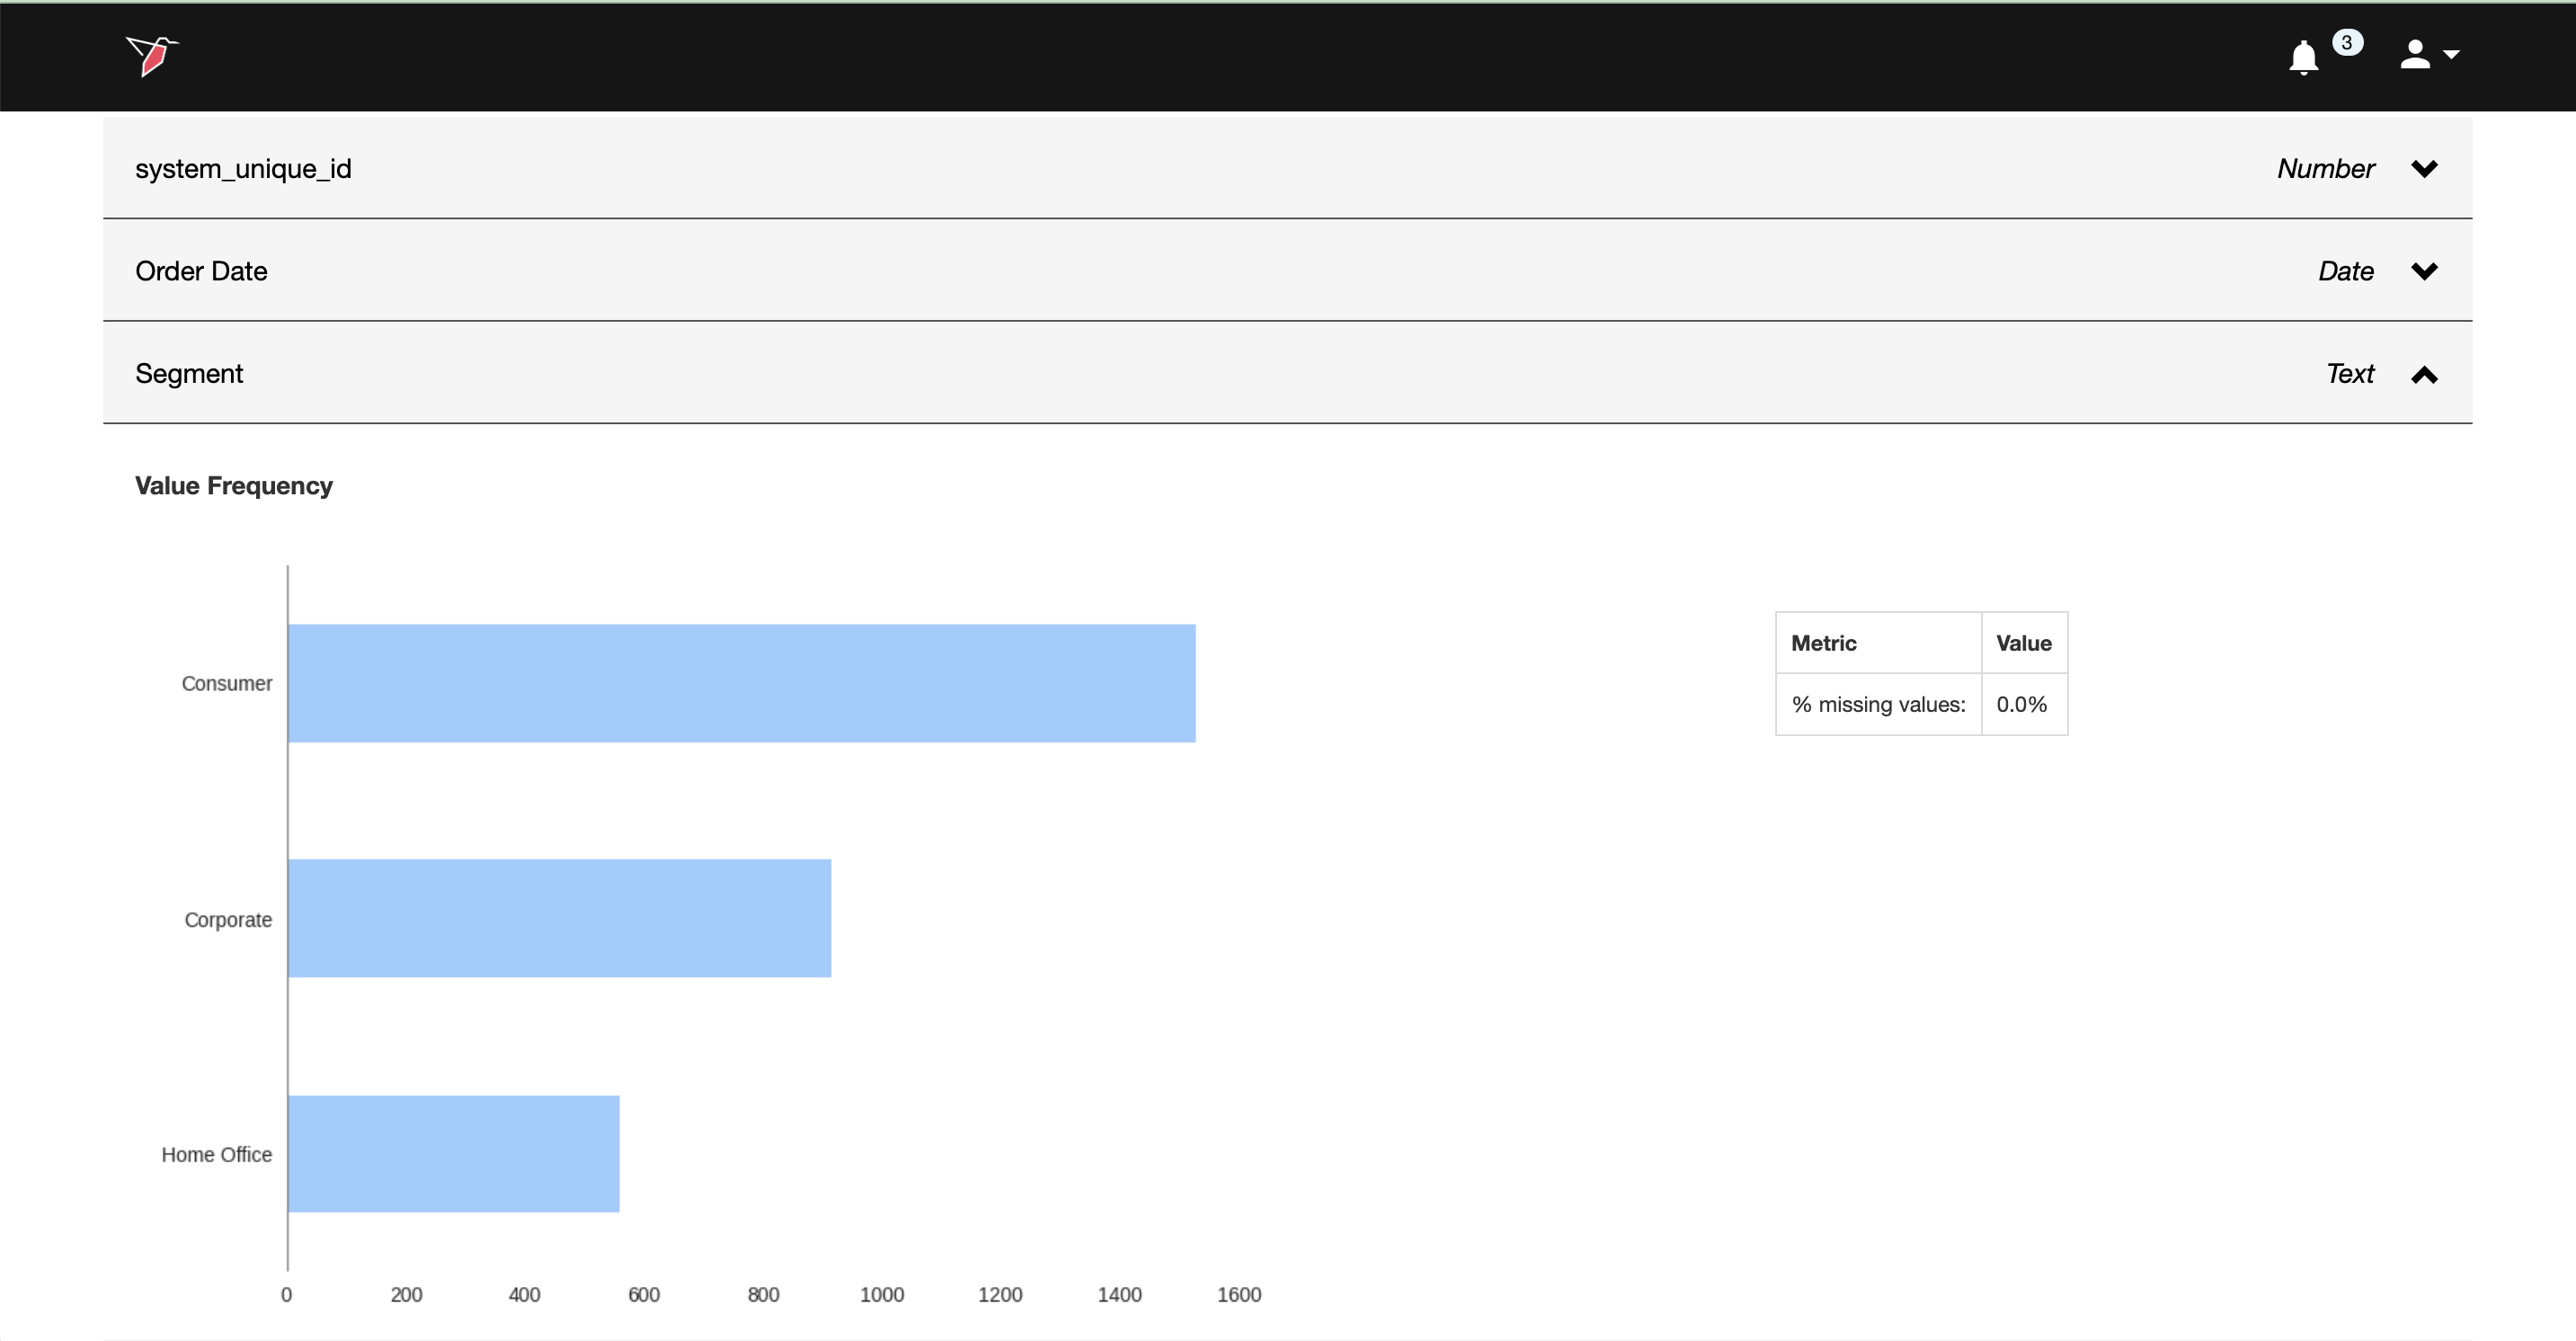
- Text, Binary, and Date columns
- Breakout of distinct values contained within the column
- For longer-form text (where each row in the column is a lengthy piece of text - e.g. social media posts), breakout of word frequency and WordCloud summarizing the main themes within the text.\
<br
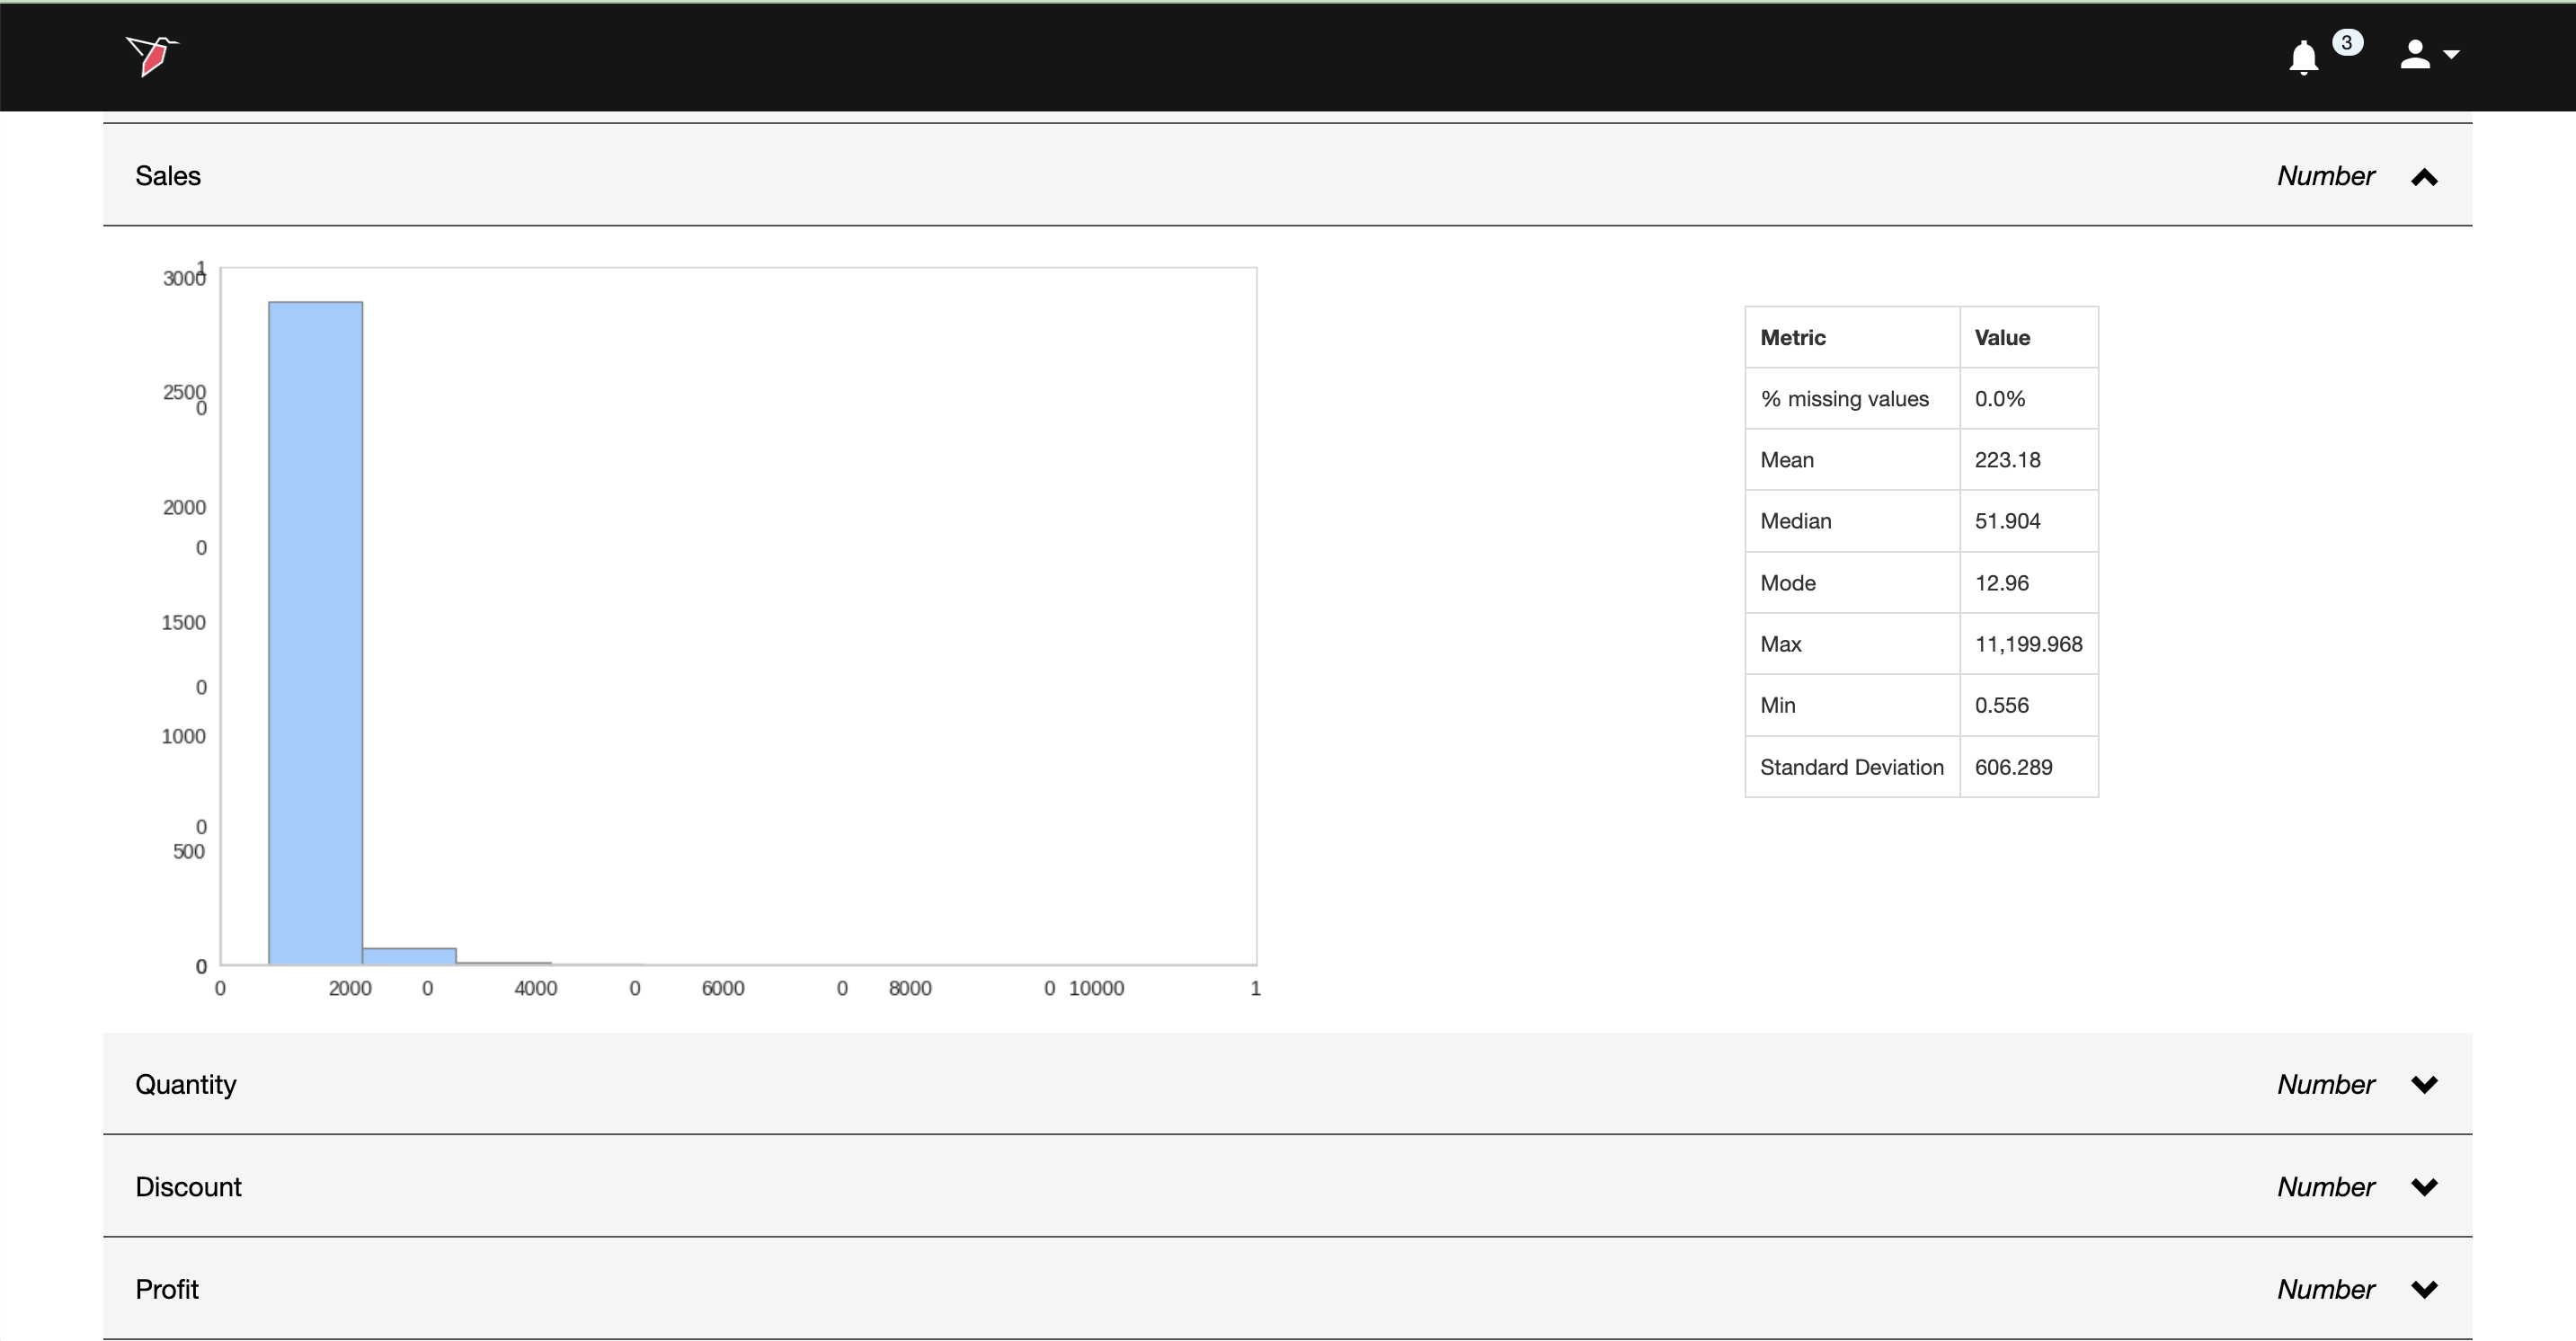
- Number columns
- Histogram of number values distribution
- Key statistics (Mean, Median, Mode, Max, Min, Standard Deviation, % of missing values)\
Pivot Tables
You can create pivot tables for your data by clicking on the Pivot tab on the Explore view.
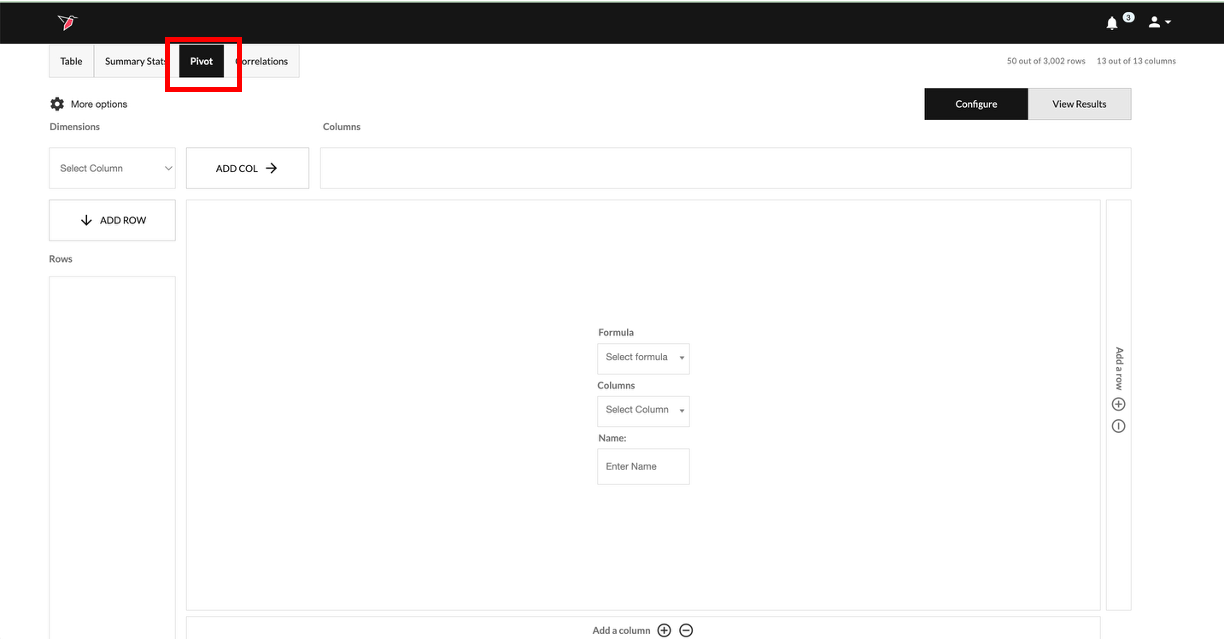
Within the Pivot tab, you can explore your data by cutting and aggregating it as you wish in the Configure toggle view and then switching the toggle to View Results to see the resulting output table from your configuration. See the full documentation for pivot tables here
Correlations
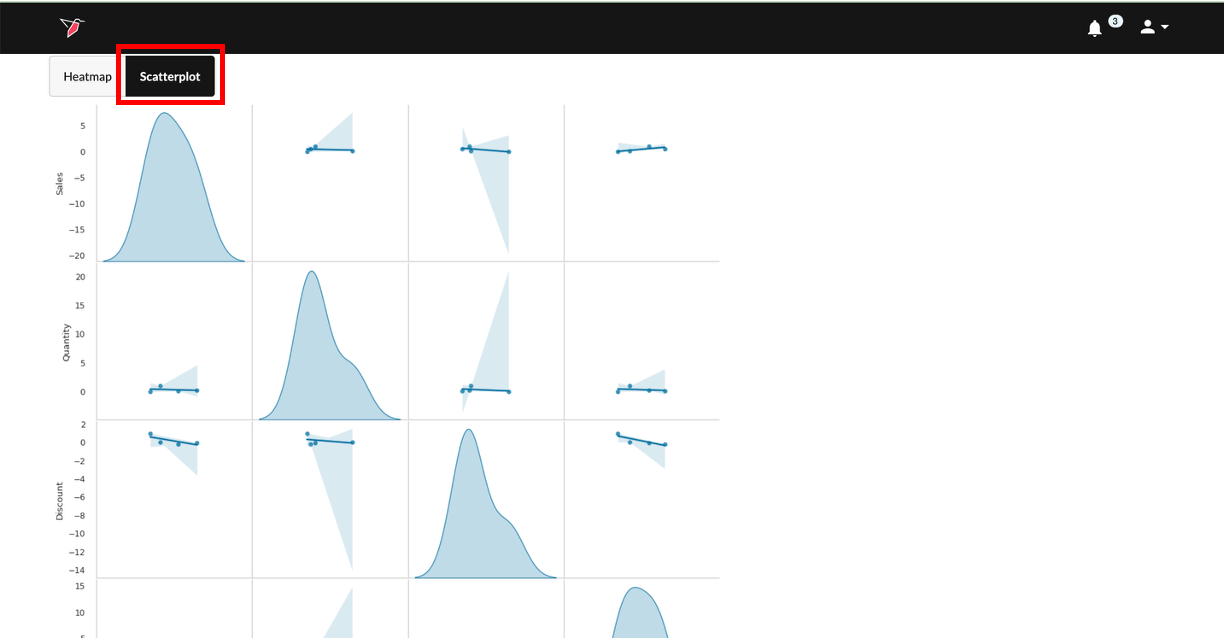
You can also easily explore correlations between numerical variables in your dataset by clicking on the Correlations tab on the Explore view.
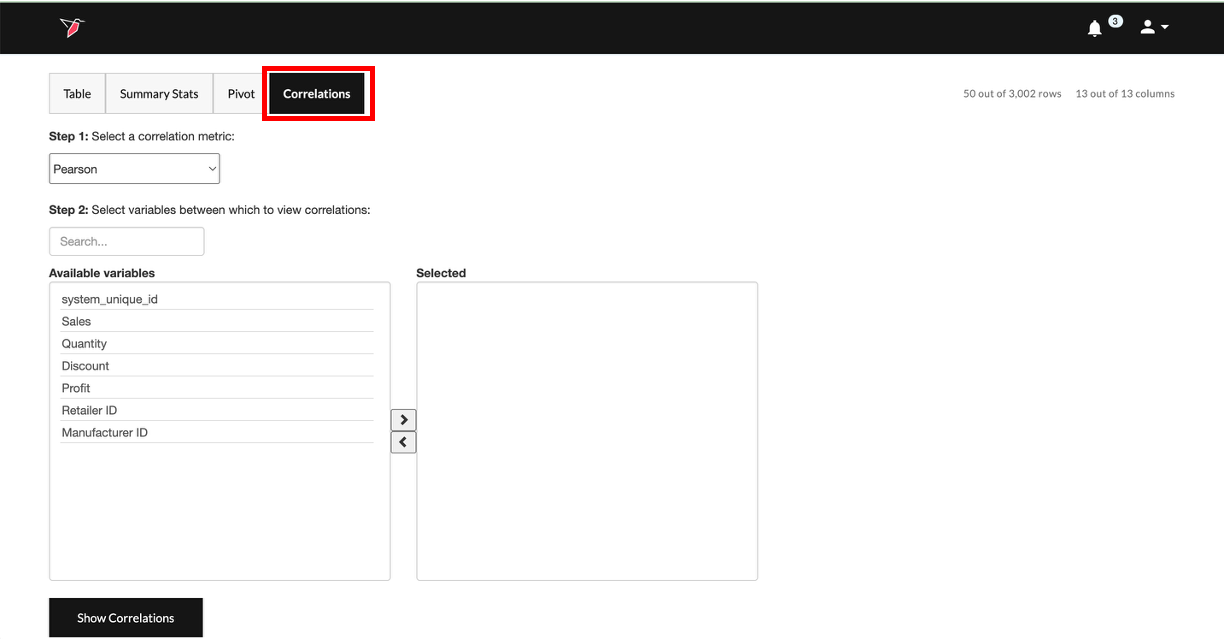
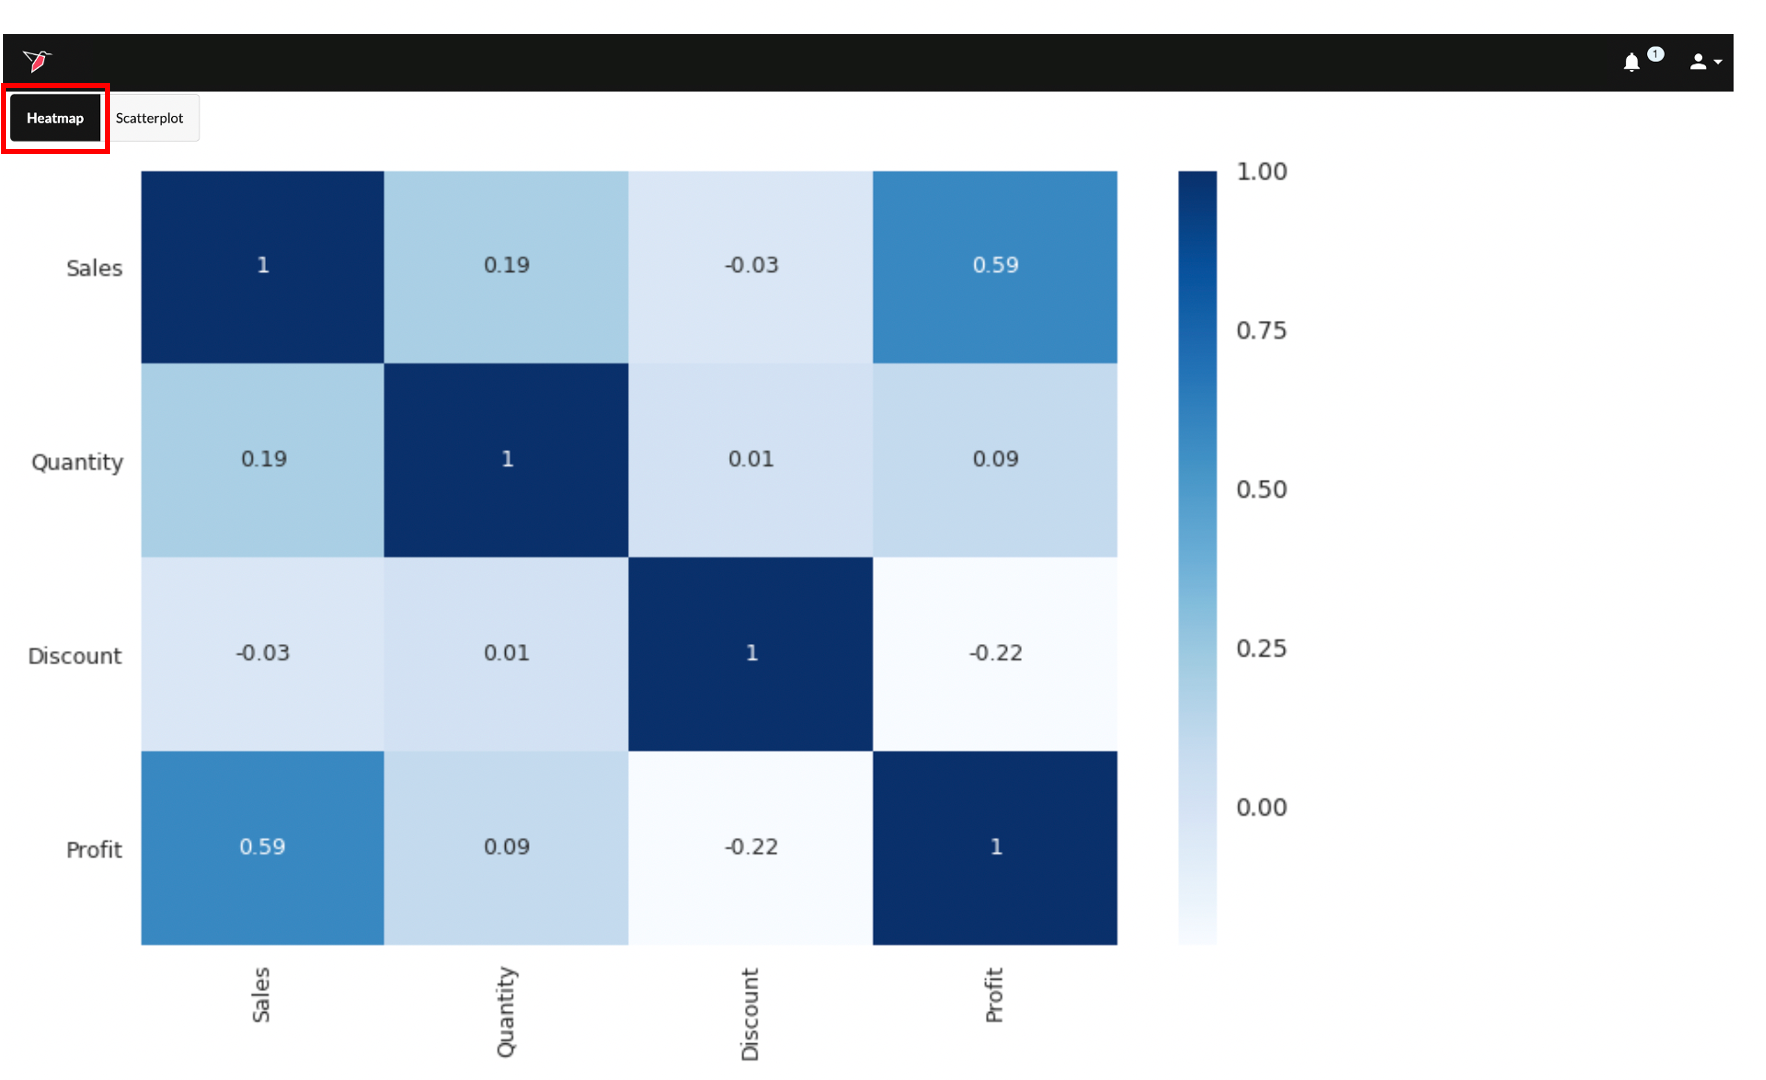
Within the Correlations tab, choose a correlation type, and select/deselect the numerical variables to correlate using the < or > buttons. Once your configuration is complete, click Show correlations and toggle between the Heatmap and Scatterplot tabs to view your correlation results.
Updated 5 months ago