Google Analytics Report
For more general information on data collection in Redbird, check out: Getting Started With Data Collection
This guide explains how to set up access and collect data from the Google Analytics platform. Advertisers can serve their ads on properties like YouTube and Google Search using Google Ads, and the API provides a programmatic way to pull data.
If you cannot see the Google Analytics collection app in the left-side panel on the workflow canvas, refer to: Enabling Collection Apps Guide
Creating a Collection
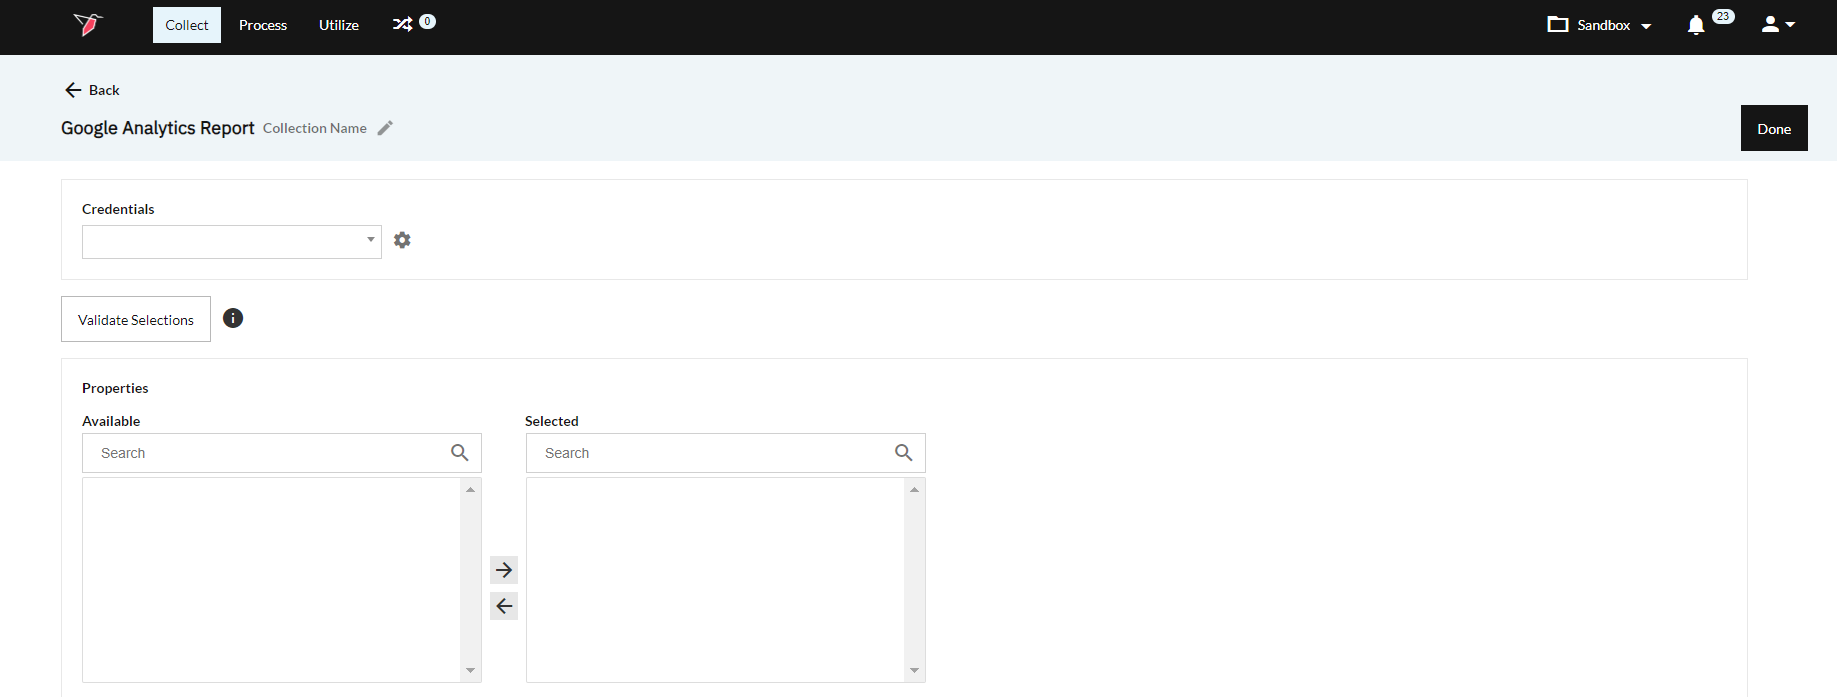
- Double-click on the node to enter configuration mode
- Click the pencil icon at the top to name your collection
- Select the credentials that you need to pull data from under the Credentials drop-down.\
 \
\
-
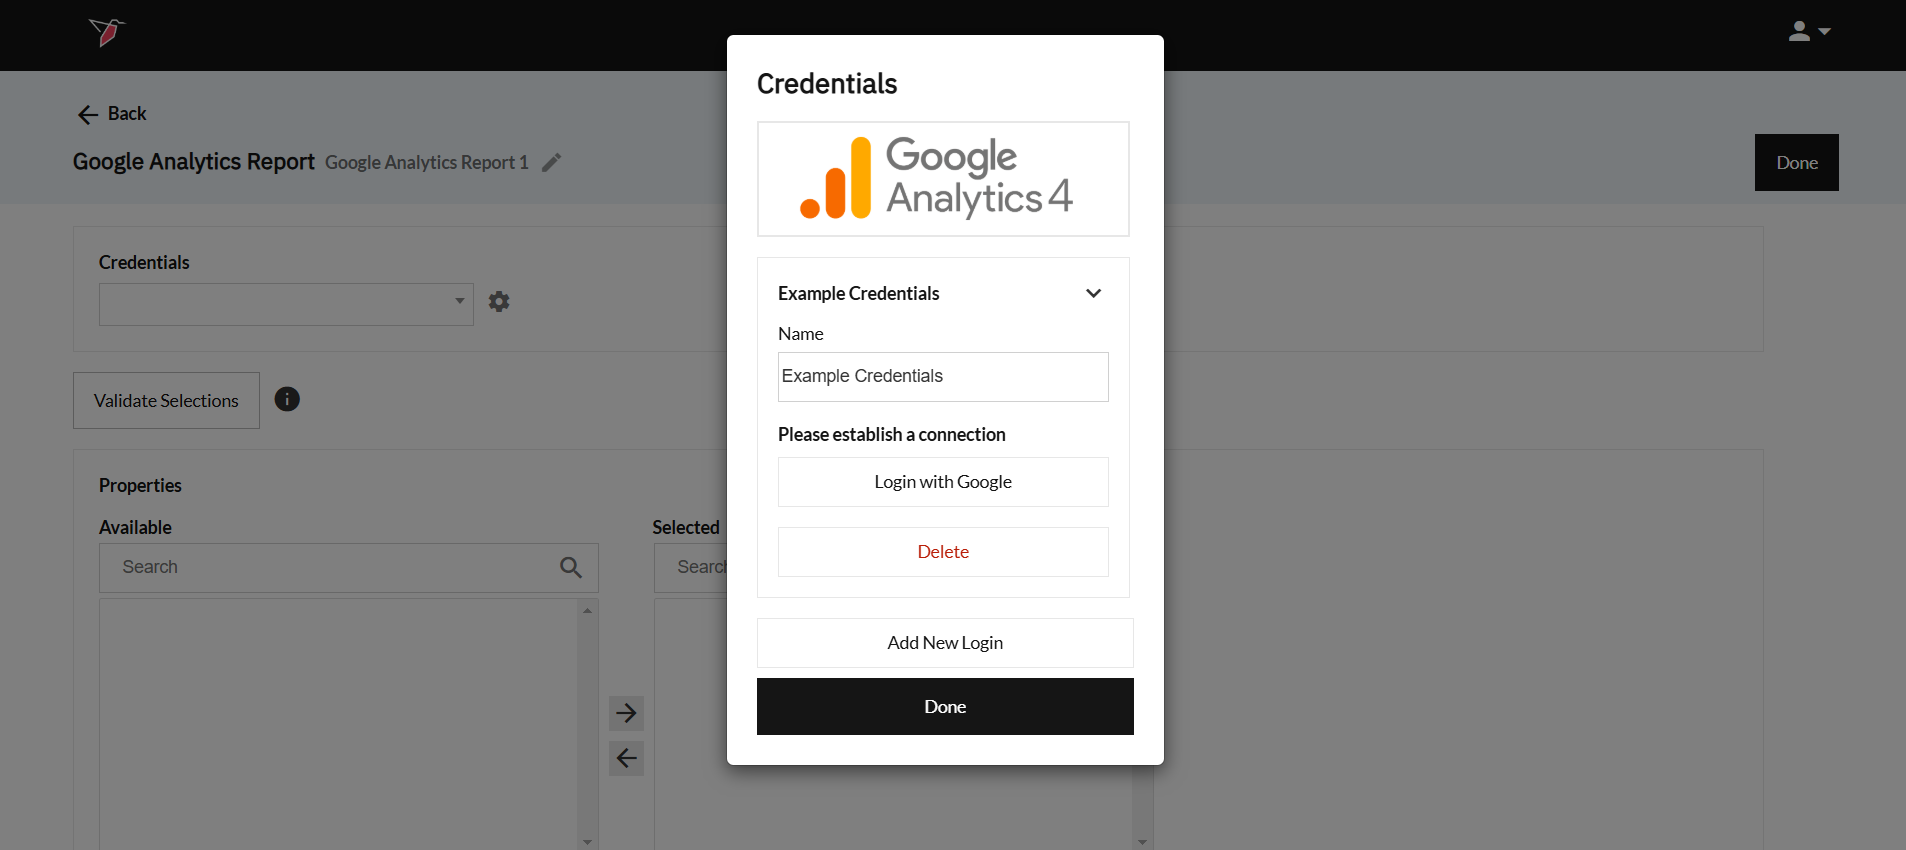
If needed, you can add, edit, or delete logins during this step by selecting the gear icon. To add a new login, click Add New Login
 \
\ -
Name your credentials for easy reference
-
Click Login with Google and proceed through the Google OAuth steps.
-
Once you've been redirected back to Redbird, select your newly created credentials from the Credentials dropdown.
-
- Choose the property that you want to pull data from. To read more about Google Analytics properties, click here.
- (Optional) Filter your query based on Gender and Age.
- Under Metrics and Dimensions, the available options will populate in the Available box. Select the options you need and click the right arrow to move it to the Selected box.\
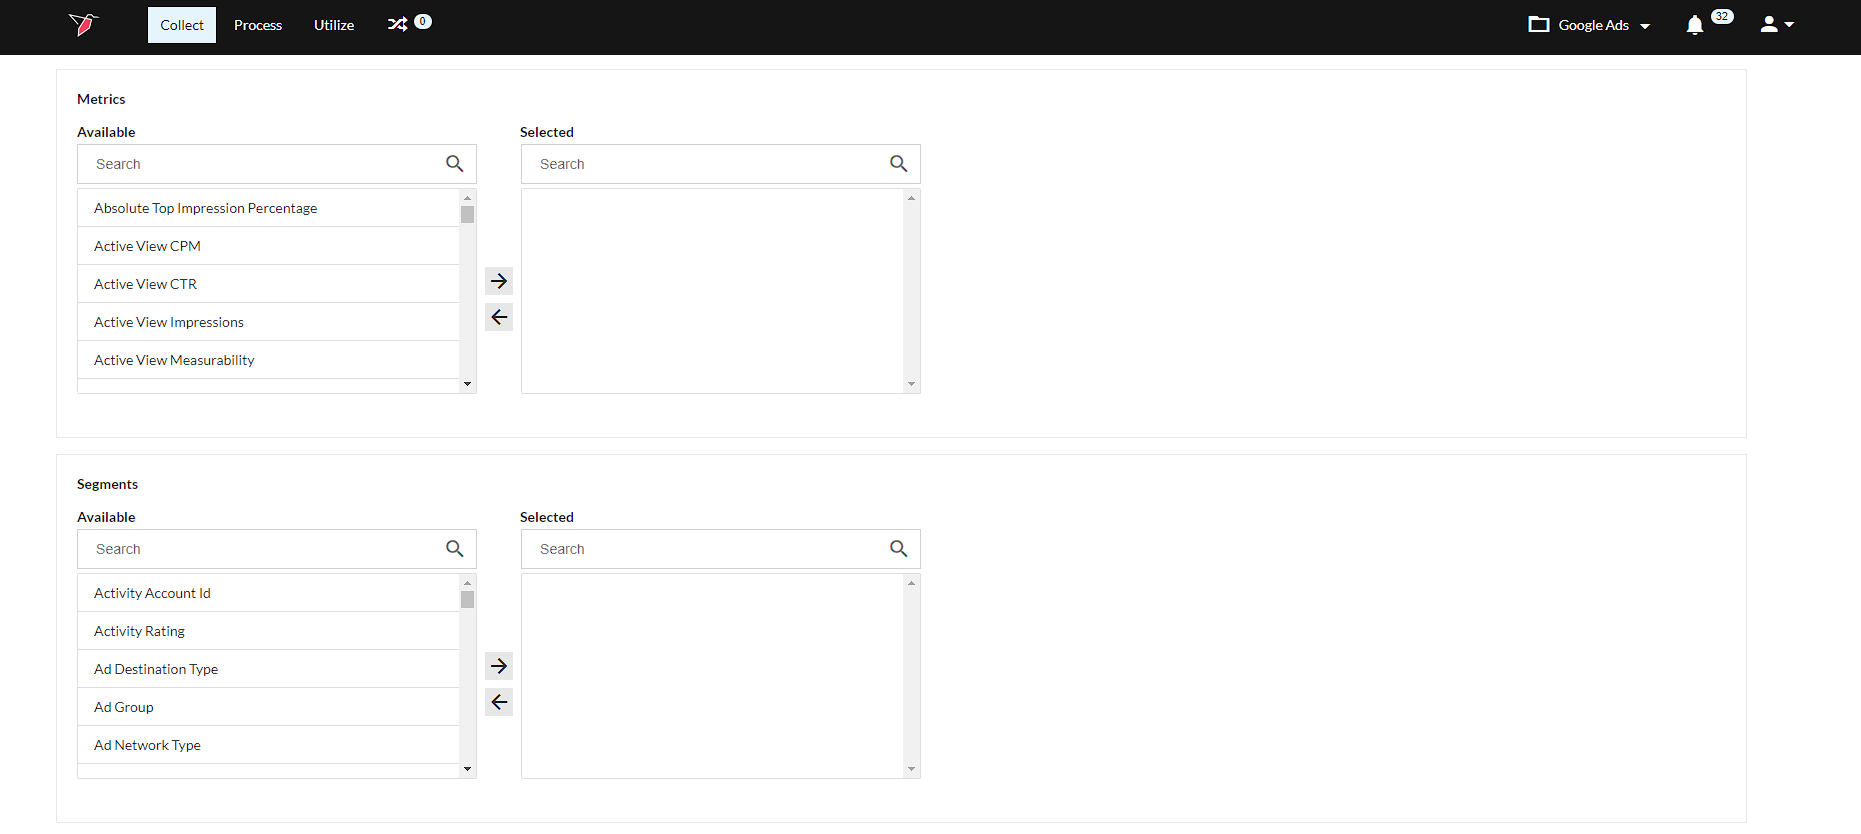 Important:
Certain Metrics and Dimensions are incompatible with one another. To validate whether your query can run successfully, click on the "Validate Selections" button underneath the credentials dropdown. Google also provides a helpful tool to determine whether a report is valid.
- You can use the Custom Metrics and Custom Dimensions sections to add in your property-specific custom fields. To read more about Custom Metrics and Dimensions, click here.
- Date Period allows you to select between a Manual date range or an Automated date range.
- Manual: At run time, users will be prompted to provide a start and end date for the collection to run.
- Automated: Users can define a dynamic date range to include in their configuration by selecting a time period (days, weeks, or months) and initiating the configuration. Since the user selects a time period instead of a specific start and end date, the dates used to run the configuration will change based on the timing of each run
Google Analytics Row LimitGoogle Analytics implements a 250K row limit for each query against a property. When running your collection, be aware of this limit as you increase your date range and add in more dimensions.
- Click Done.
Running a Collection
- Click on the node.
- In the right-side panel click Run
- If date selection is set to manual, then the workflow will be stopped for you to input dates. Click Review on the node.
- Select the Start date and End date of the period you would like to cover.
- Click Back to Workflow
- Click Continue on the node.