Nielsen Scarborough (Prime Lingo)
For more general information on data collection in Redbird, check out: Getting Started With Data Collection
This guide explains how to set up access and collect data from the Nielsen Scarborough platform which collects Prime Lingo syndicated survey data.
Using your own Prime Lingo credentials, you can:
- Pull data from multiple crosstabs
- Aggregate multiple pulls into a single structured dataset
- Automate recurring survey data refreshes
- Reuse and replicate crosstab logic across markets and releases
This app supports both automated data collection from Prime Lingo and manual uploads of existing crosstab exports.
If you cannot see the Nielsen Scarborough collection app in the left-side panel on the workflow canvas, refer to: Enabling Collection Apps Guide
Inputting Credentials
- Click the person icon located in the upper right-hand corner of the page
- Click Account Settings
- Click Apps
- Navigate to Nielsen Scarborough
- Click on the settings cog associated with Nielsen Scarborough
- Input the credentials
- Click Done
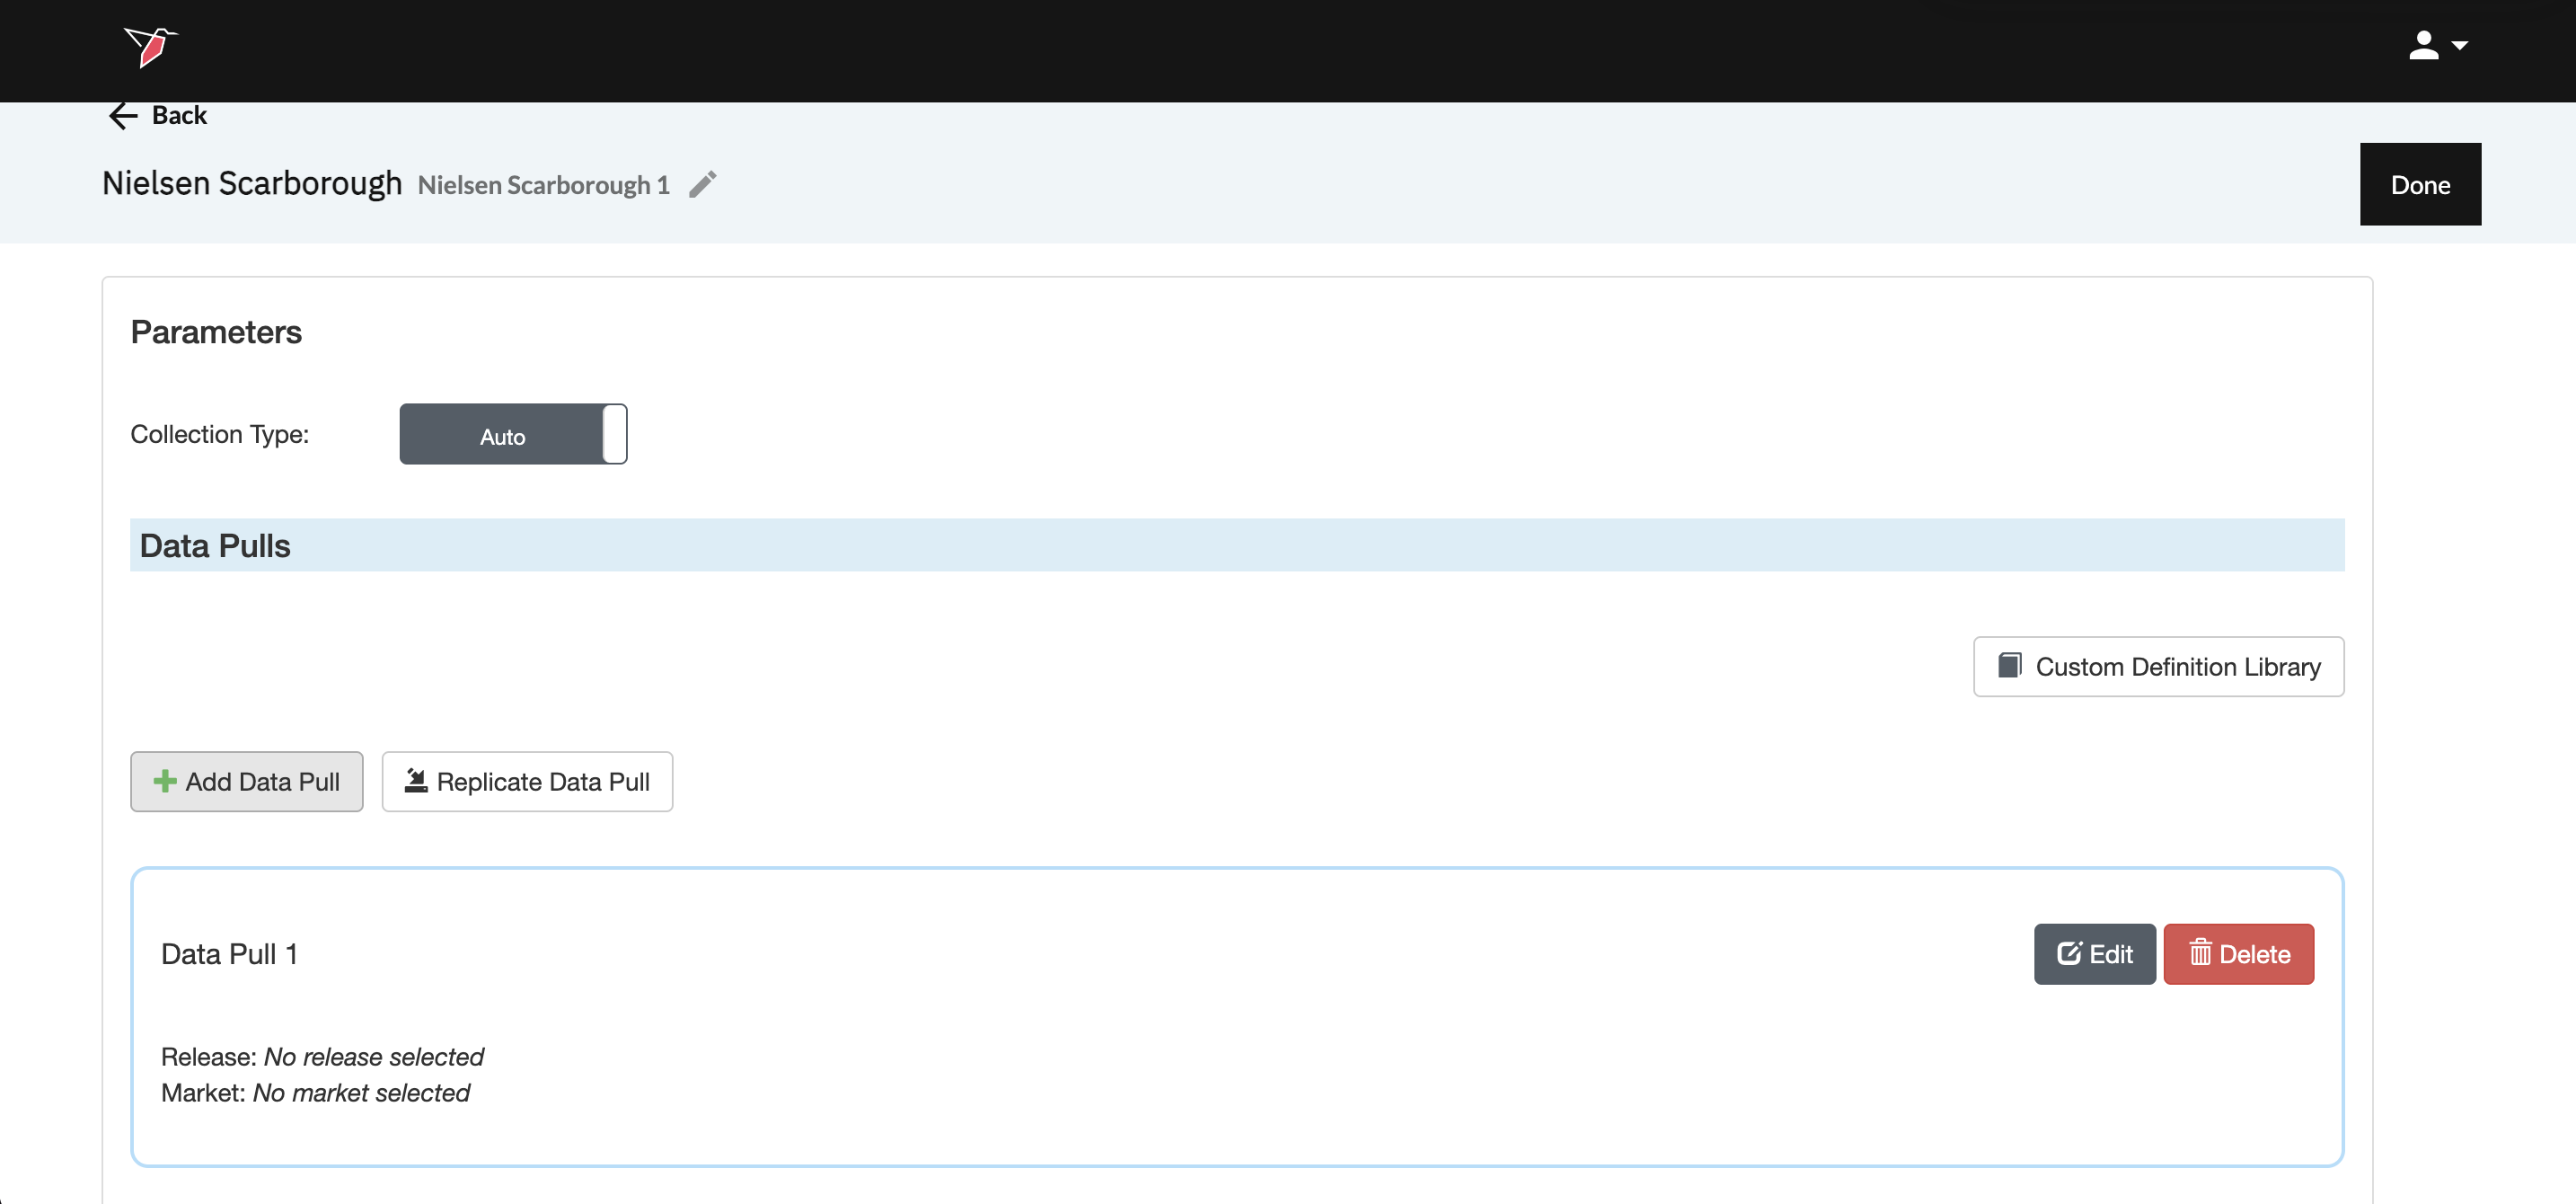
Creating a Collection
-
Double-click on the node to enter configuration mode
-
Name your collection in the Configuration Name box
-
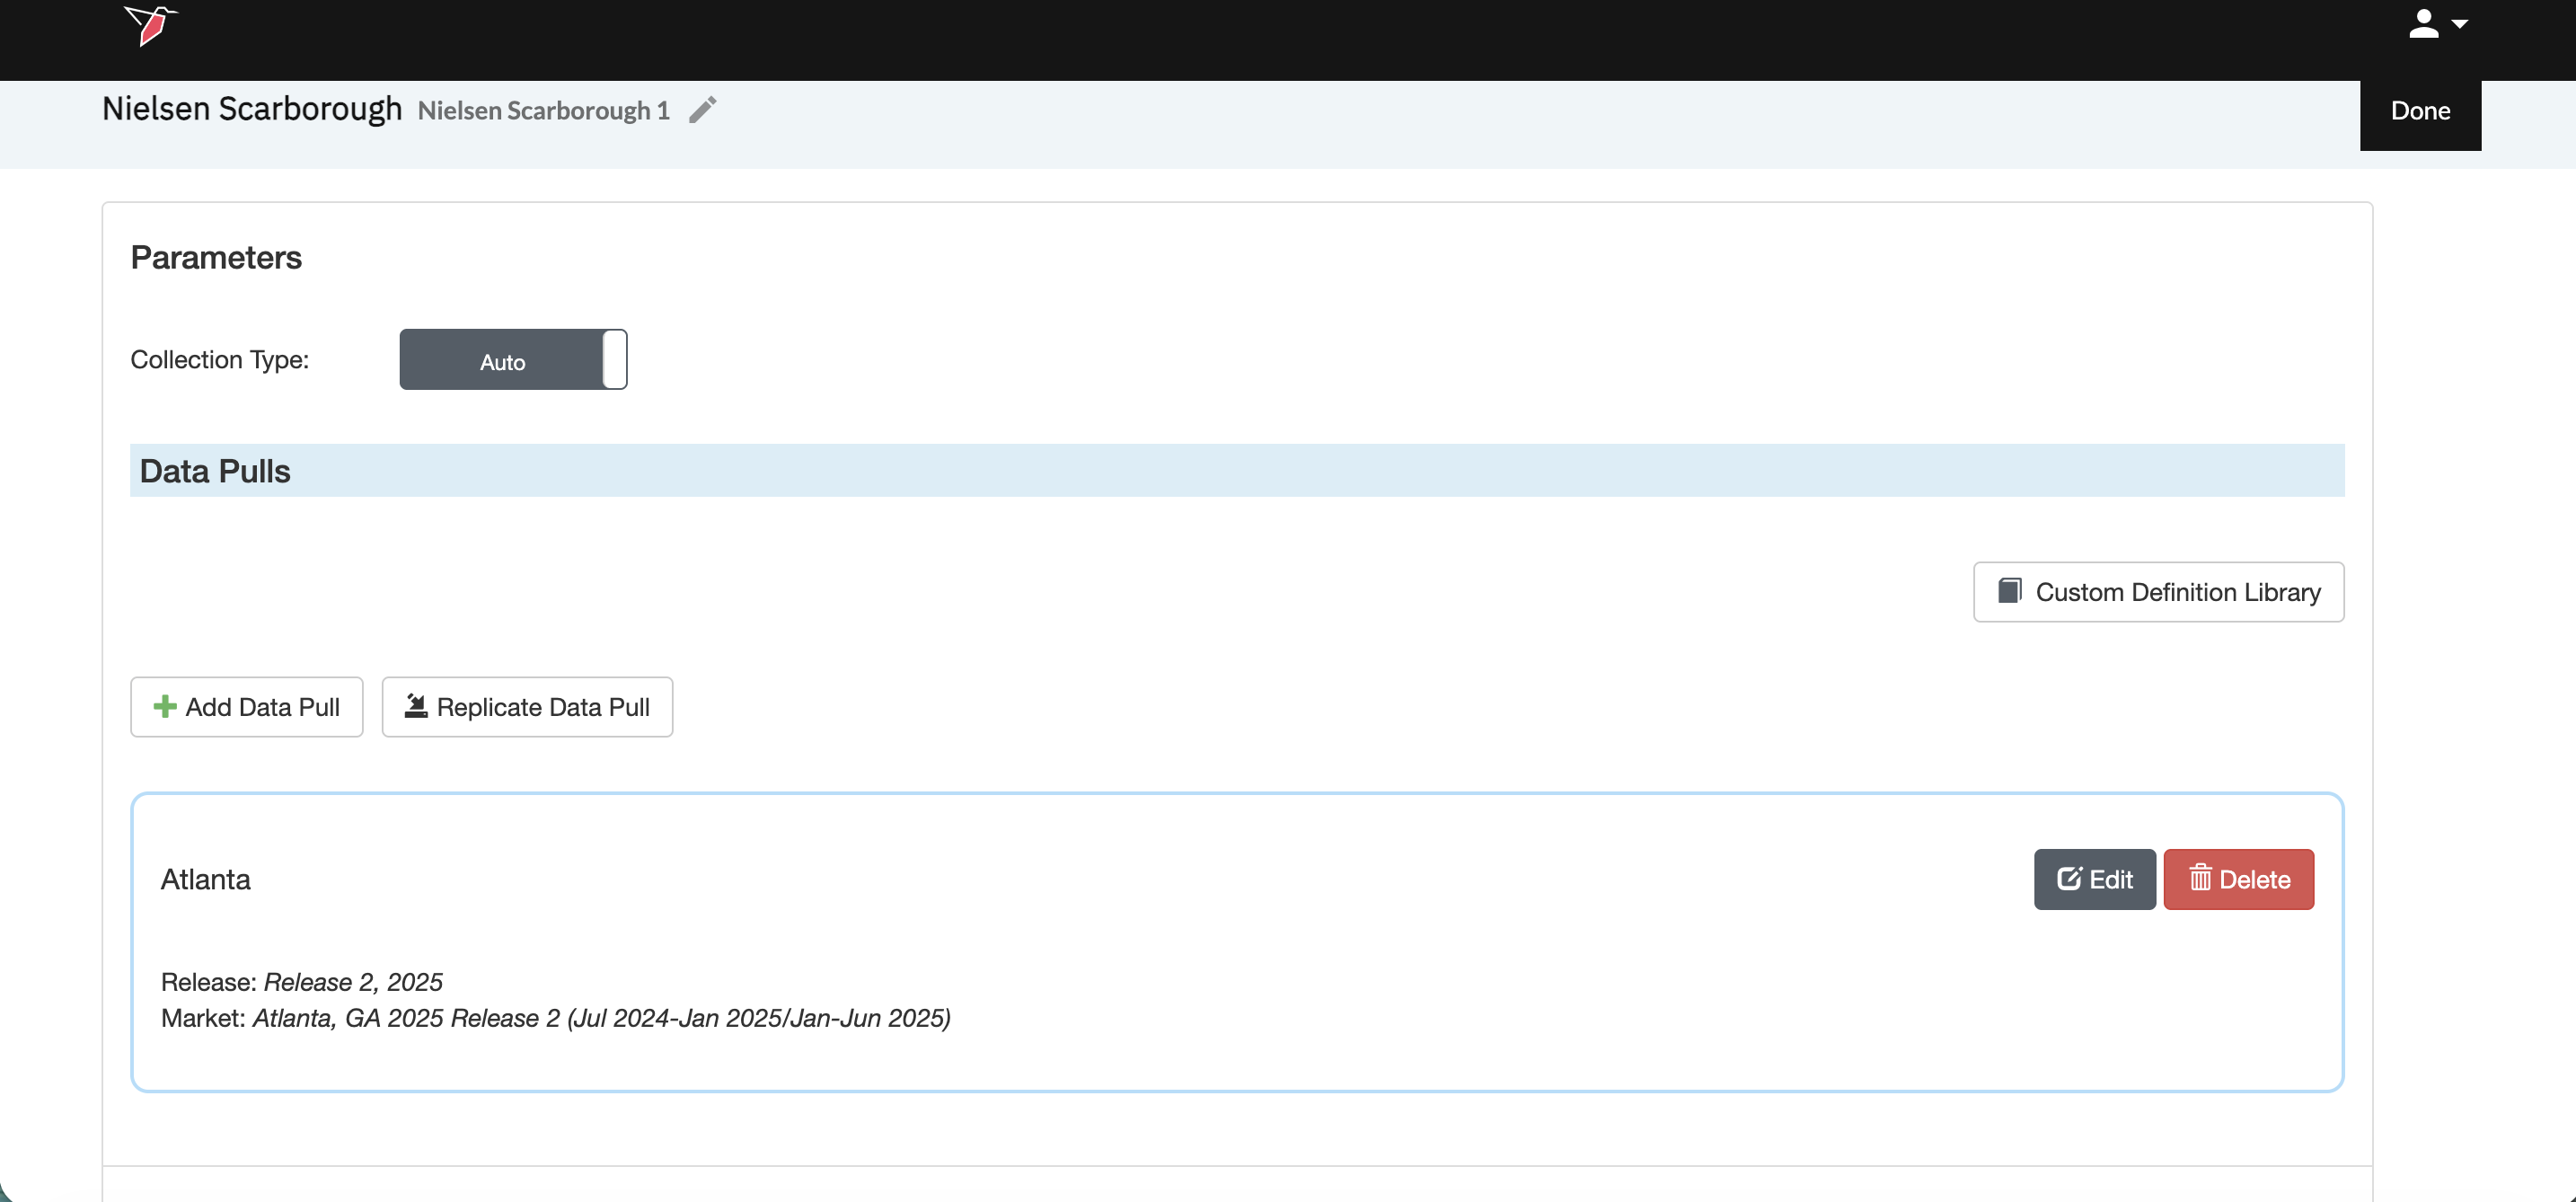
Within the Parameters section, select a Collection Type.
- Auto (default & recommended)
Automatically pulls data directly from Prime Lingo. - Upload External
Allows you to upload existing Prime Lingo crosstab exports from your desktop. This is useful for historical data uploads or one-off manual exports that you may want to ingest into the platform to use downstream.
- Auto (default & recommended)
-
When Collection Type is set to Auto, the Data Pulls section becomes available. A data pull represents the configuration of a single Nielsen Scarborough crosstab, equivalent to what you would normally build and export directly from the Nielsen Scarborough (Prime Lingo) platform.
Each data pull defines:
- The survey release
- The market
- The selected questionnaire responses (and the questions they came from)
- The crosstab structure (bases, columns, and rows)
Multiple data pulls can be added to one node and they will be all downloaded and vertically stacked in one output file with an additional column containing the name of the data pull added to the dataset.
Click Add Data Pull to create a new crosstab configuration. Then click Edit within that section to configure it.
- Provide a descriptive name (for example, a specific market such as Atlanta). Each data pull typically represents:
- One market
- One release
- One crosstab configuration
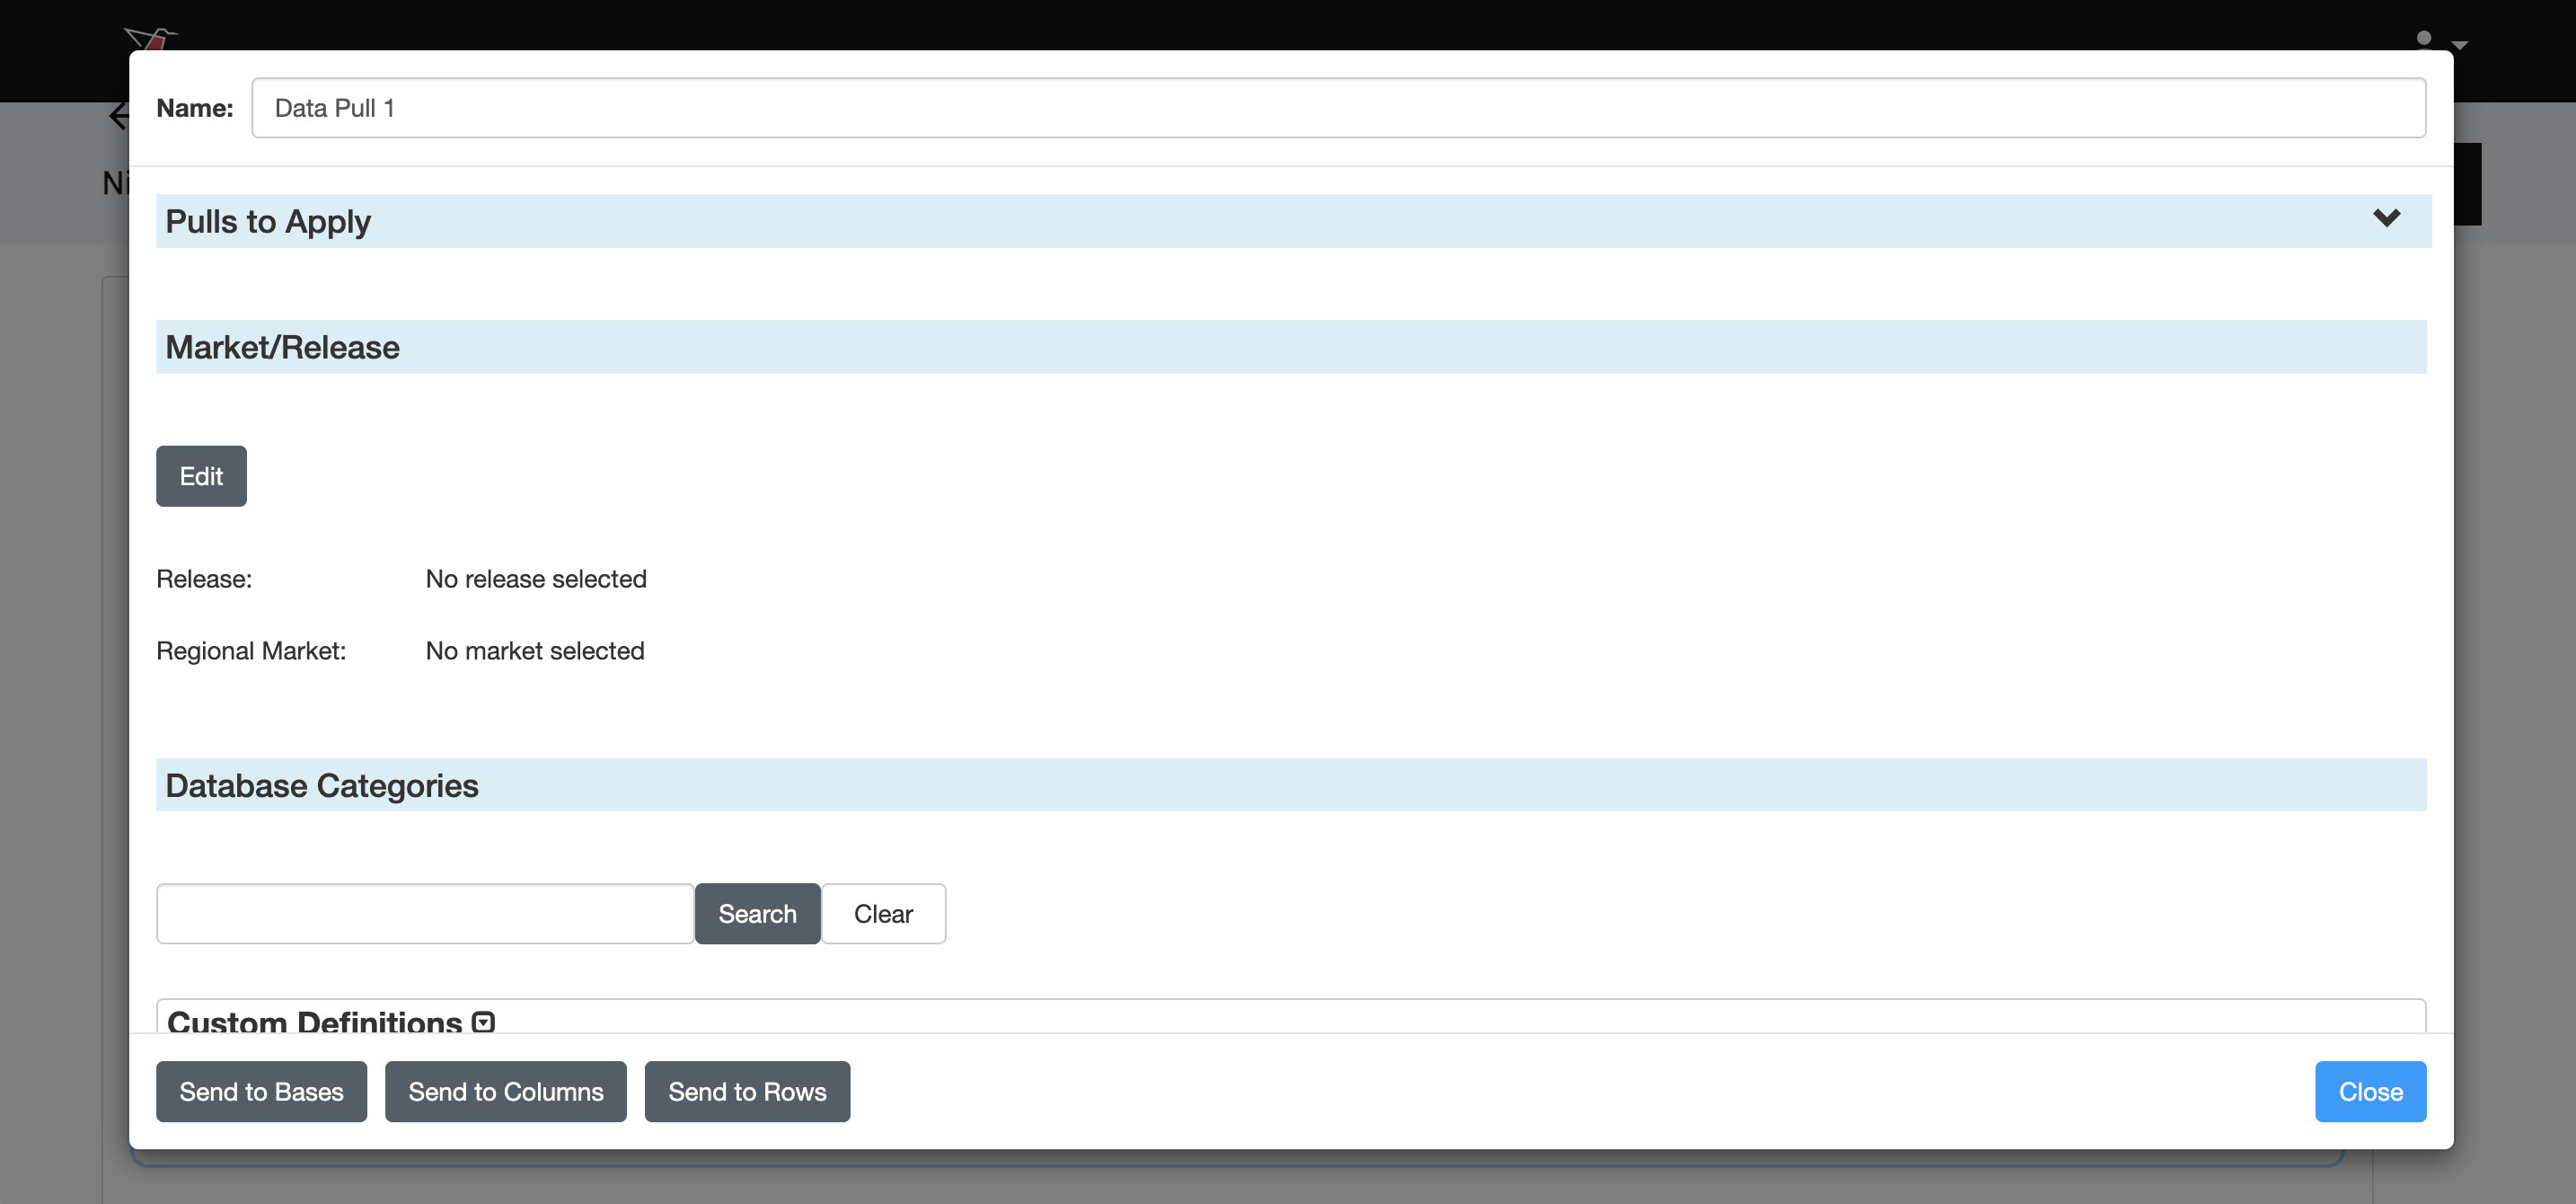
- In the Pulls to Apply section, if multiple data pulls exist, you can apply the configuration to them by moving them across to the selected box.
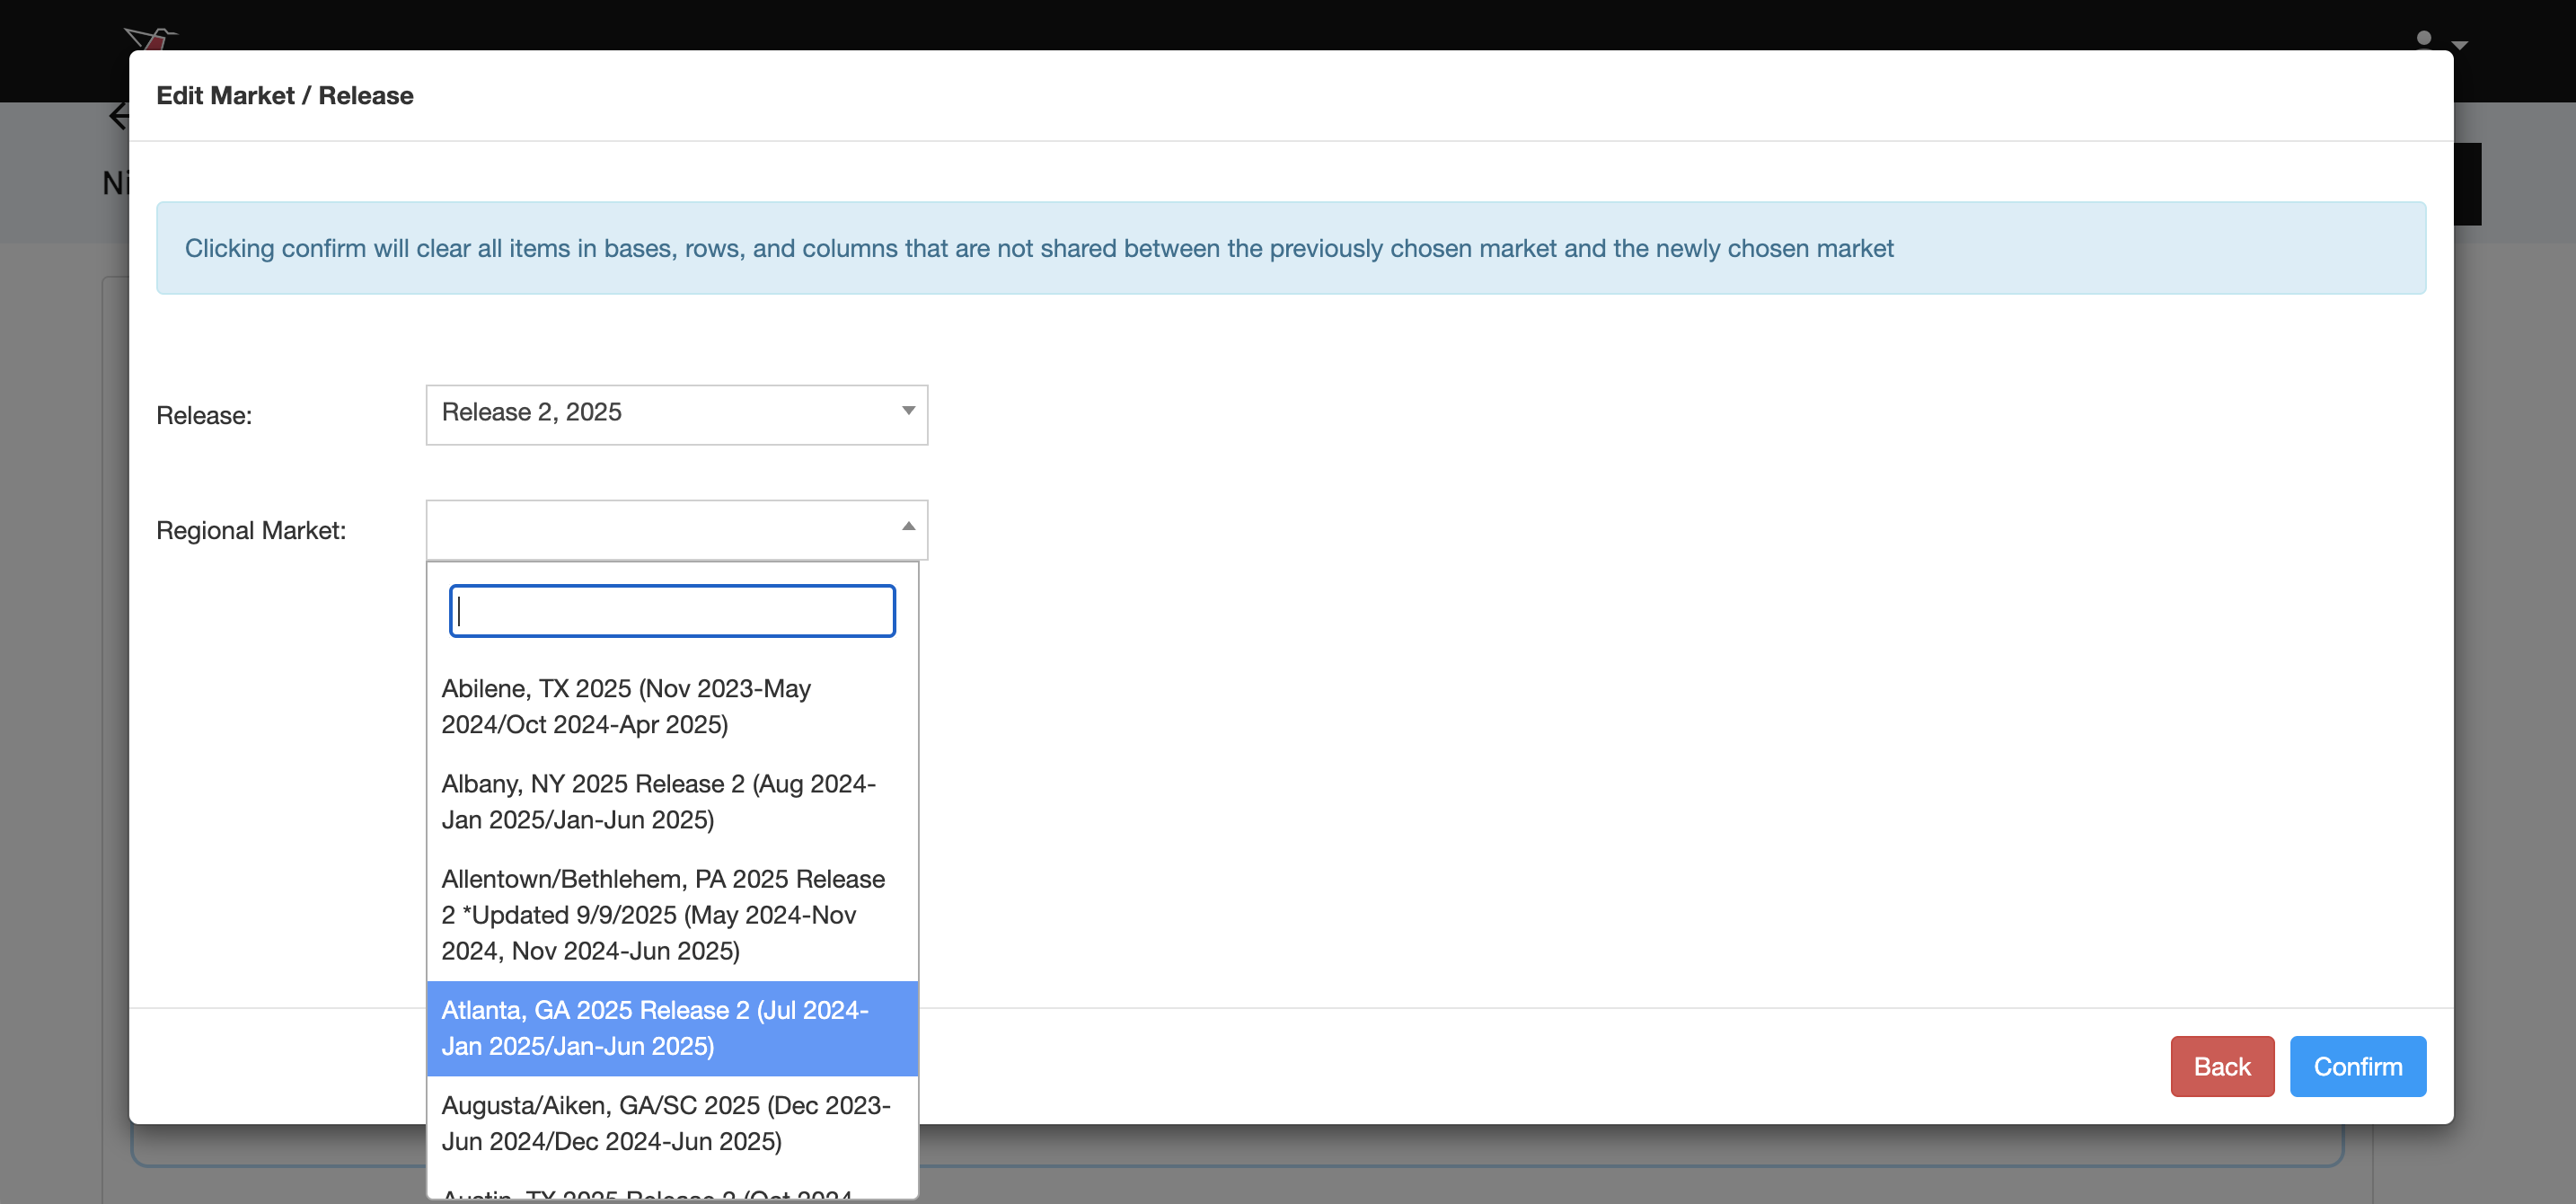
- The Market Release Selection defines which survey data the crosstab will be built from. Click Edit in the Market Release section, then select the survey release and regional market. Then click Confirm.
-
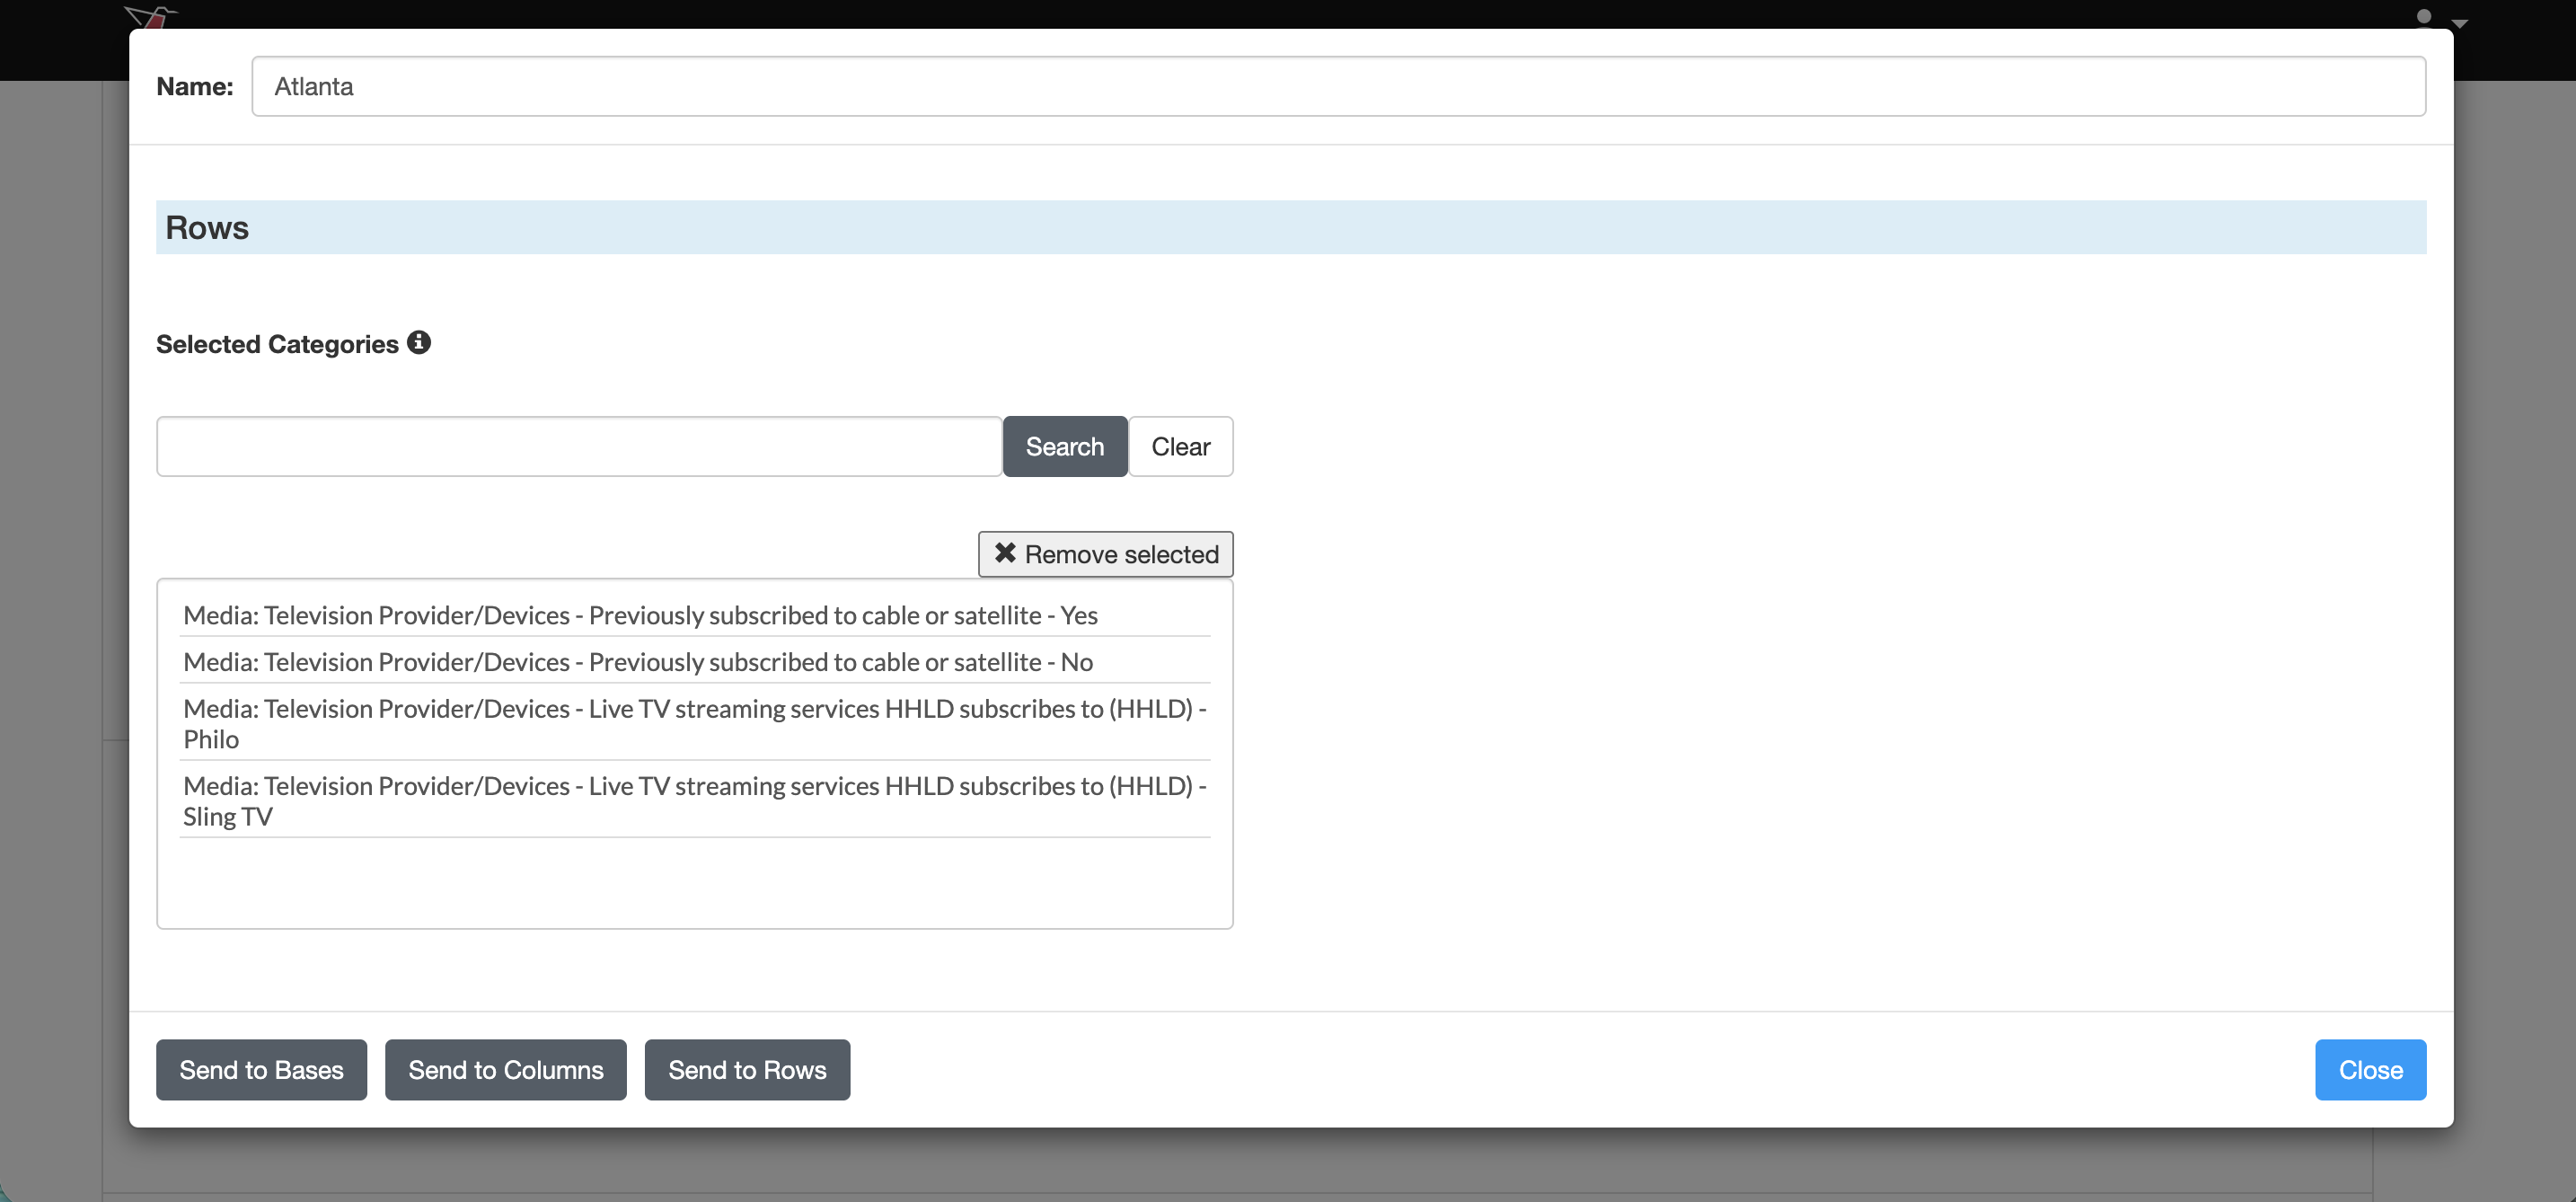
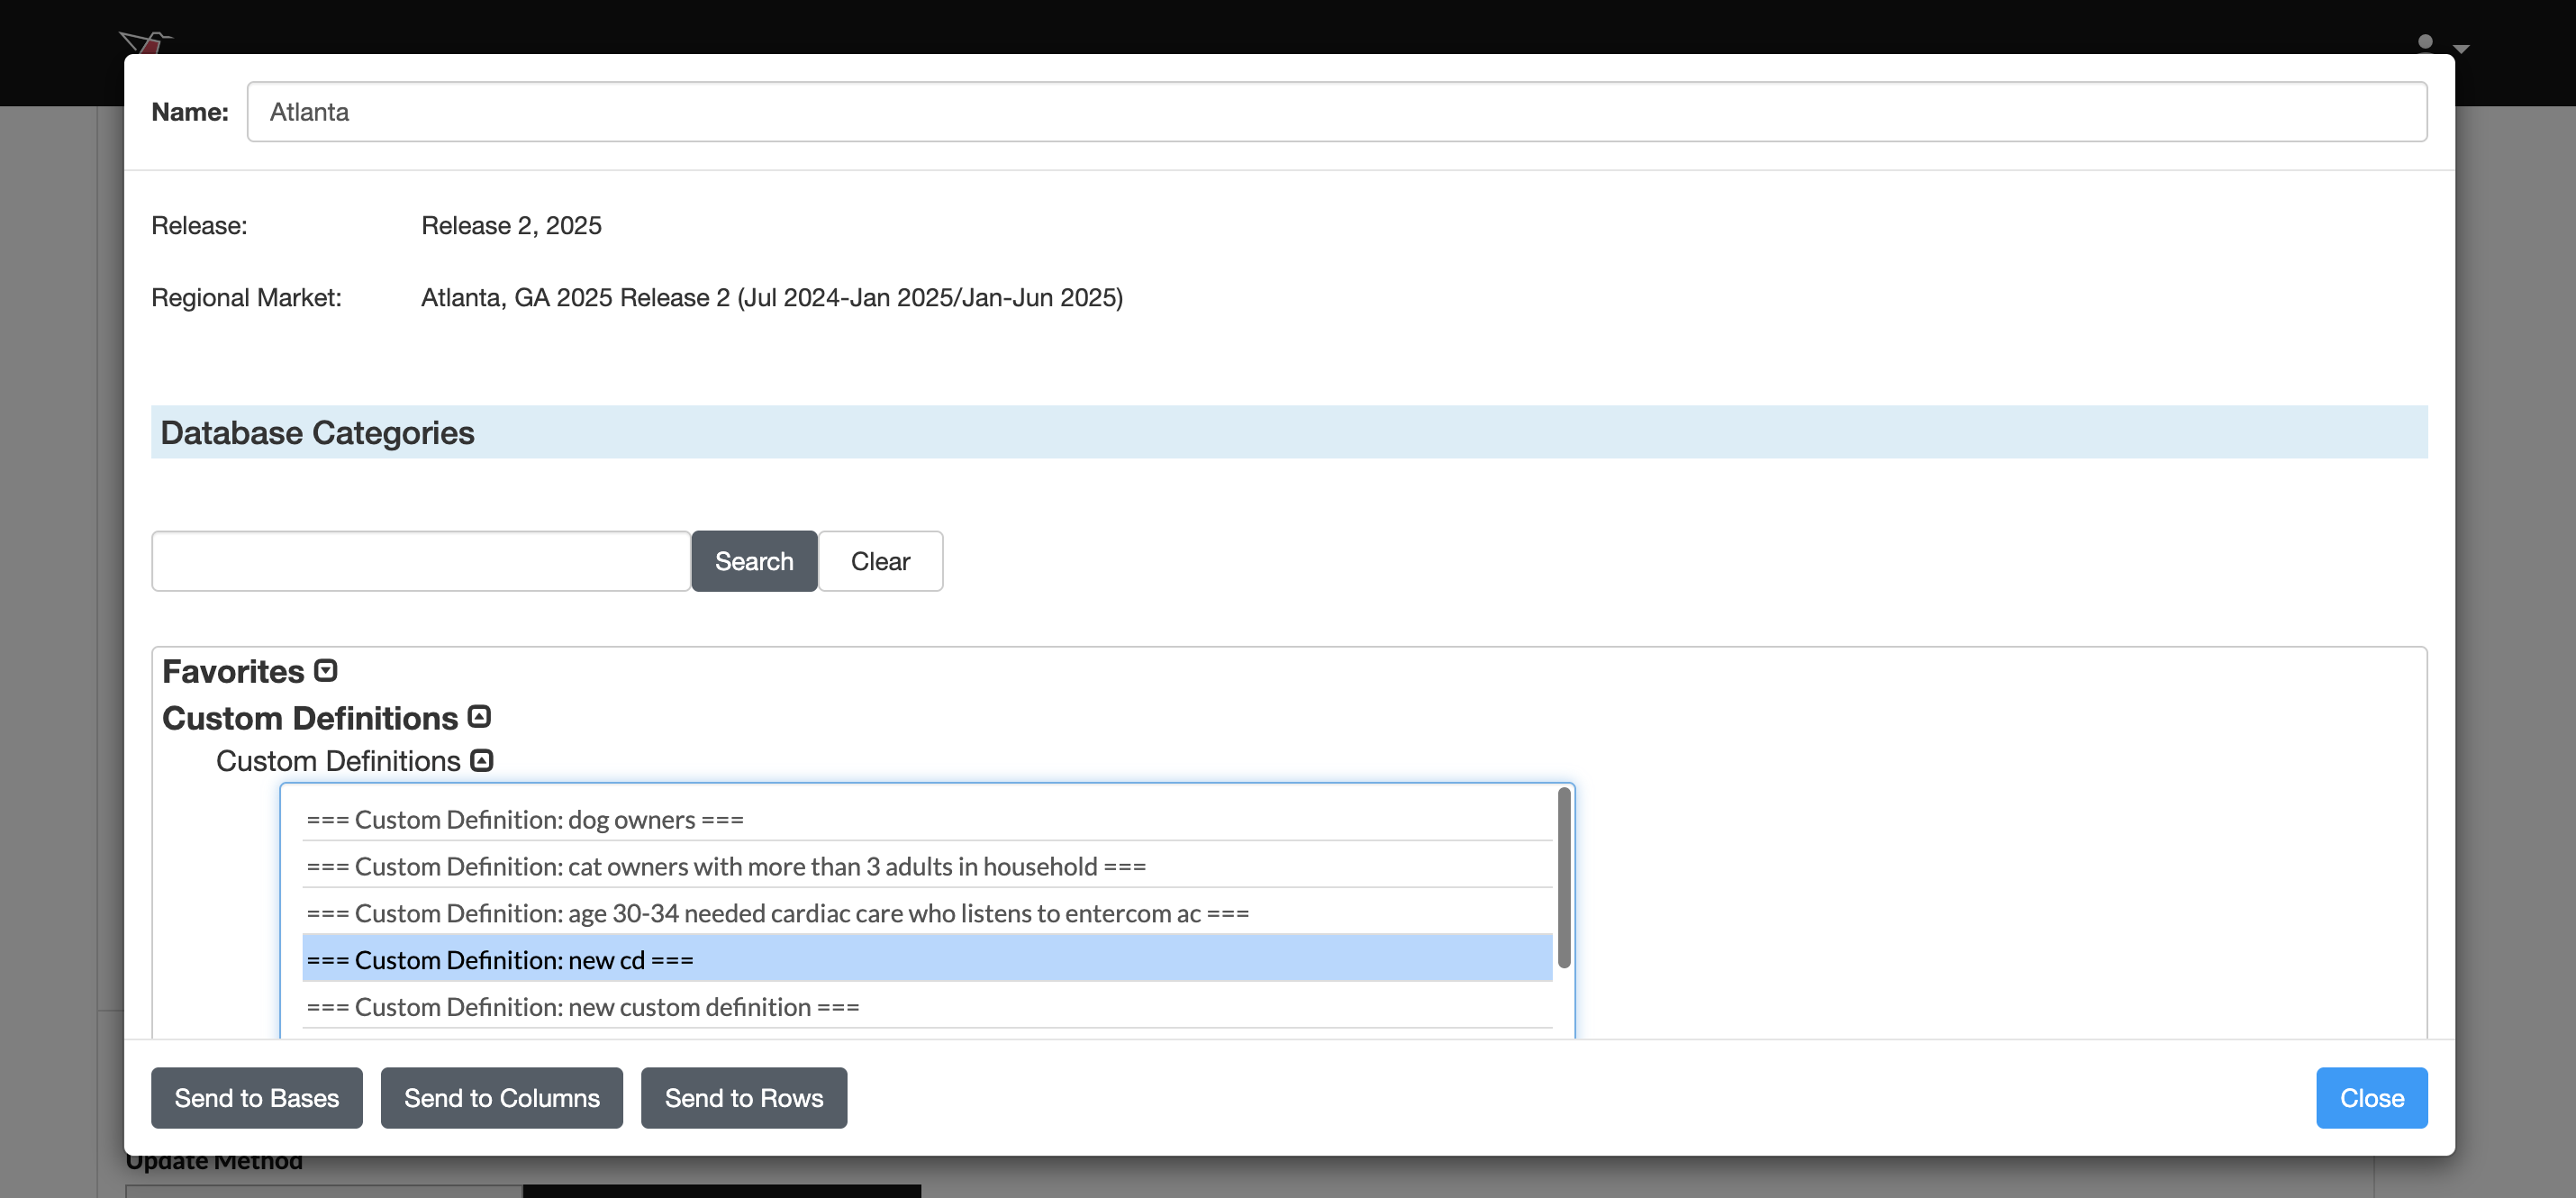
Select Metrics from Database Categories
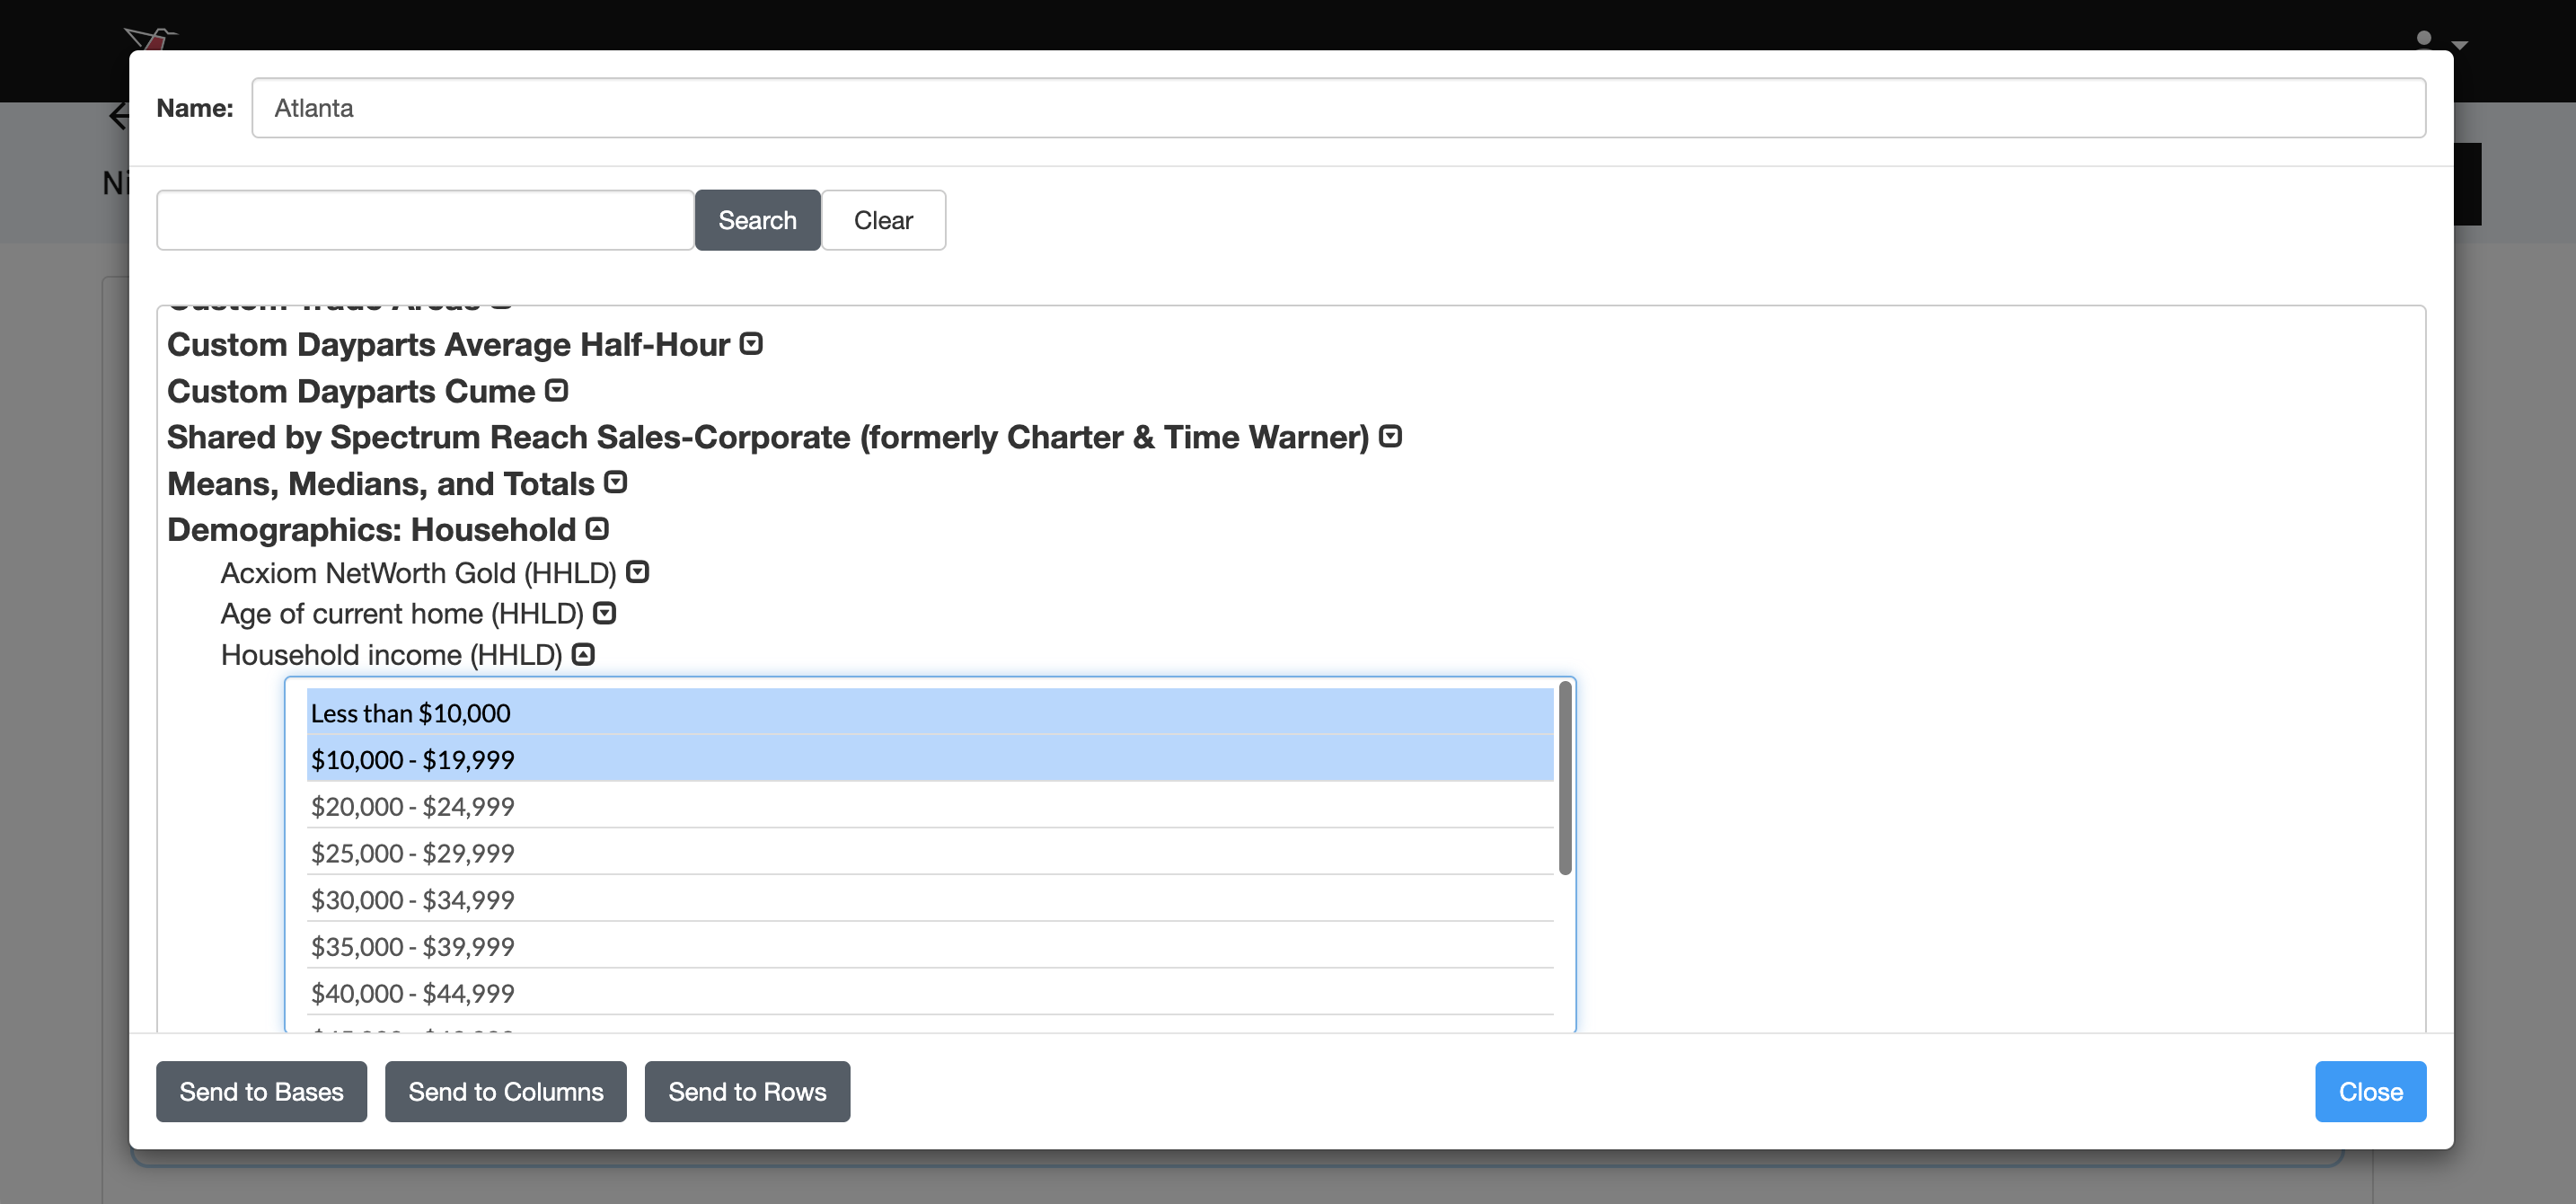
Once the market release is confirmed, the Database Categories section becomes available. This section displays the full hierarchical structure of the questionnaire. You can expand categories (groups of questions) using the arrow controls to navigate through the survey and locate the metrics you want to include in your crosstab.
You may also use the search box to find specific question text or response labels. As you navigate the hierarchy, you will eventually reach the response-level rows that can be pulled into the crosstab. Select one or more responses from a single question by clicking them, or use Ctrl/Command + Click to select multiple responses as needed.
-
Once the responses have been selected, assign them to crosstab sections using the buttons at the bottom of the modal:
- Send to Bases
Defines the overall audience filter (the base population) - Send to Columns
Defines the column banners (audience segments or groups) - Send to Rows
Defines the metrics being measured
This mirrors the standard crosstab-building workflow in the Nielsen Scarborough platform.
- Send to Bases
-
Once assigned, selections appear in the relevant sections (Based, Columns, Rows) on the main configuration screen. Within each of these you can use the search box to search for metrics added or use the remove selected button to remove individual metrics that have been selected. Click Close when all metrics have been selected for that Data Pull.
- The configured data pull will now appear in the main node view. You can edit or delete by clicking the buttons in the top right corner of the data pull.
-
Replicate Data Pulls (Optional)
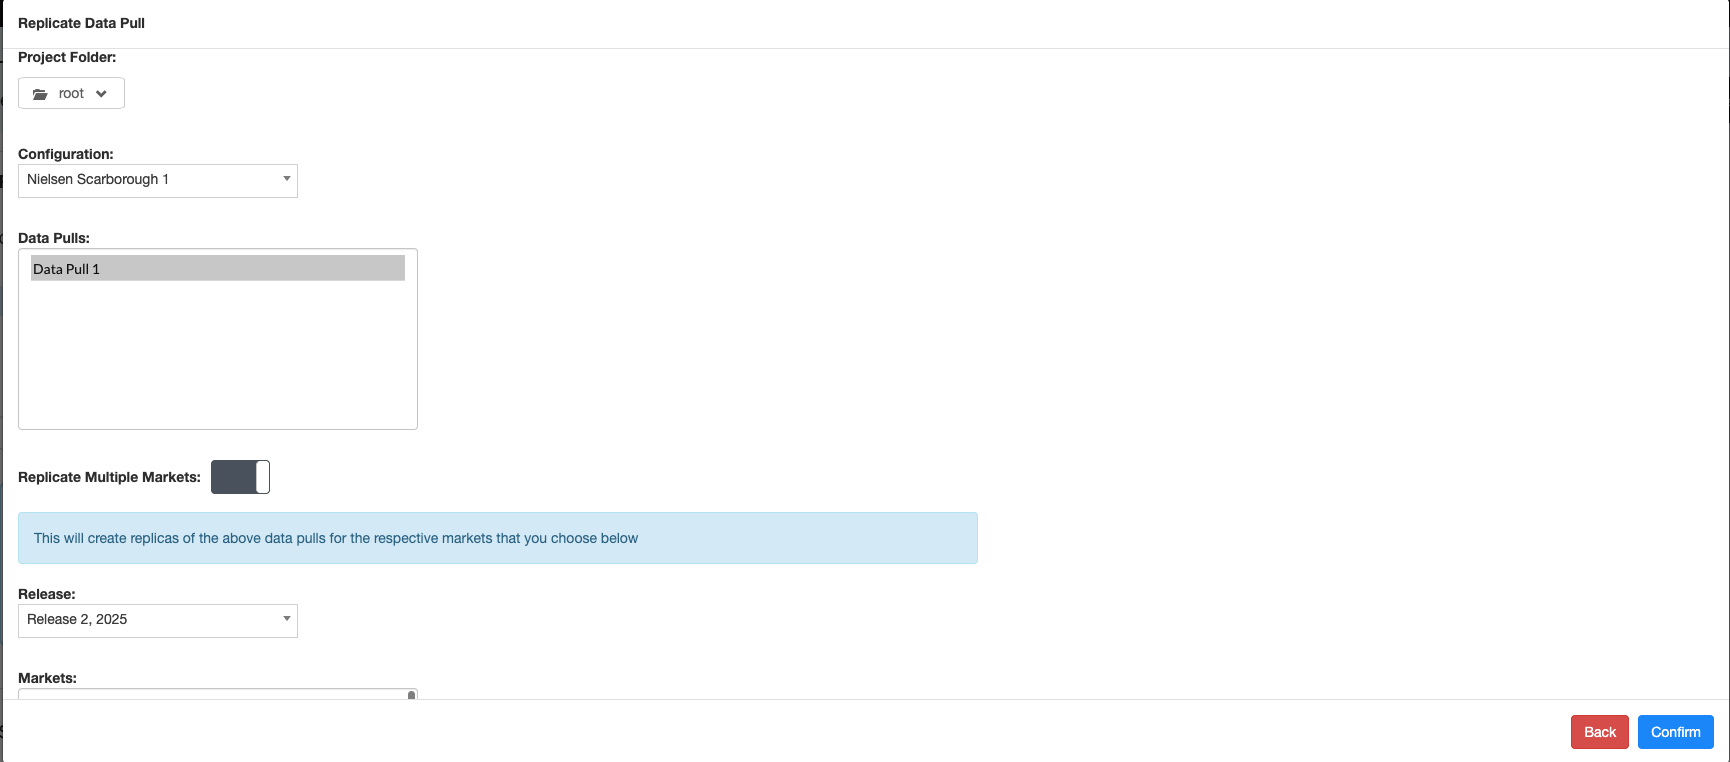
Instead of creating each new data pull from scratch. To reuse an existing configuration, click Replicate Data Pull. Then navigate to the data pull(s) you wish to replicate by selecting the Project folder, Configuration and then the specific data pull(s). You can toggle on Multiple Markets to replicate the same cross-tab across different markets. Click Confirm when done and the data pull(s) will be created.
Creating Custom Definitions (Metrics)
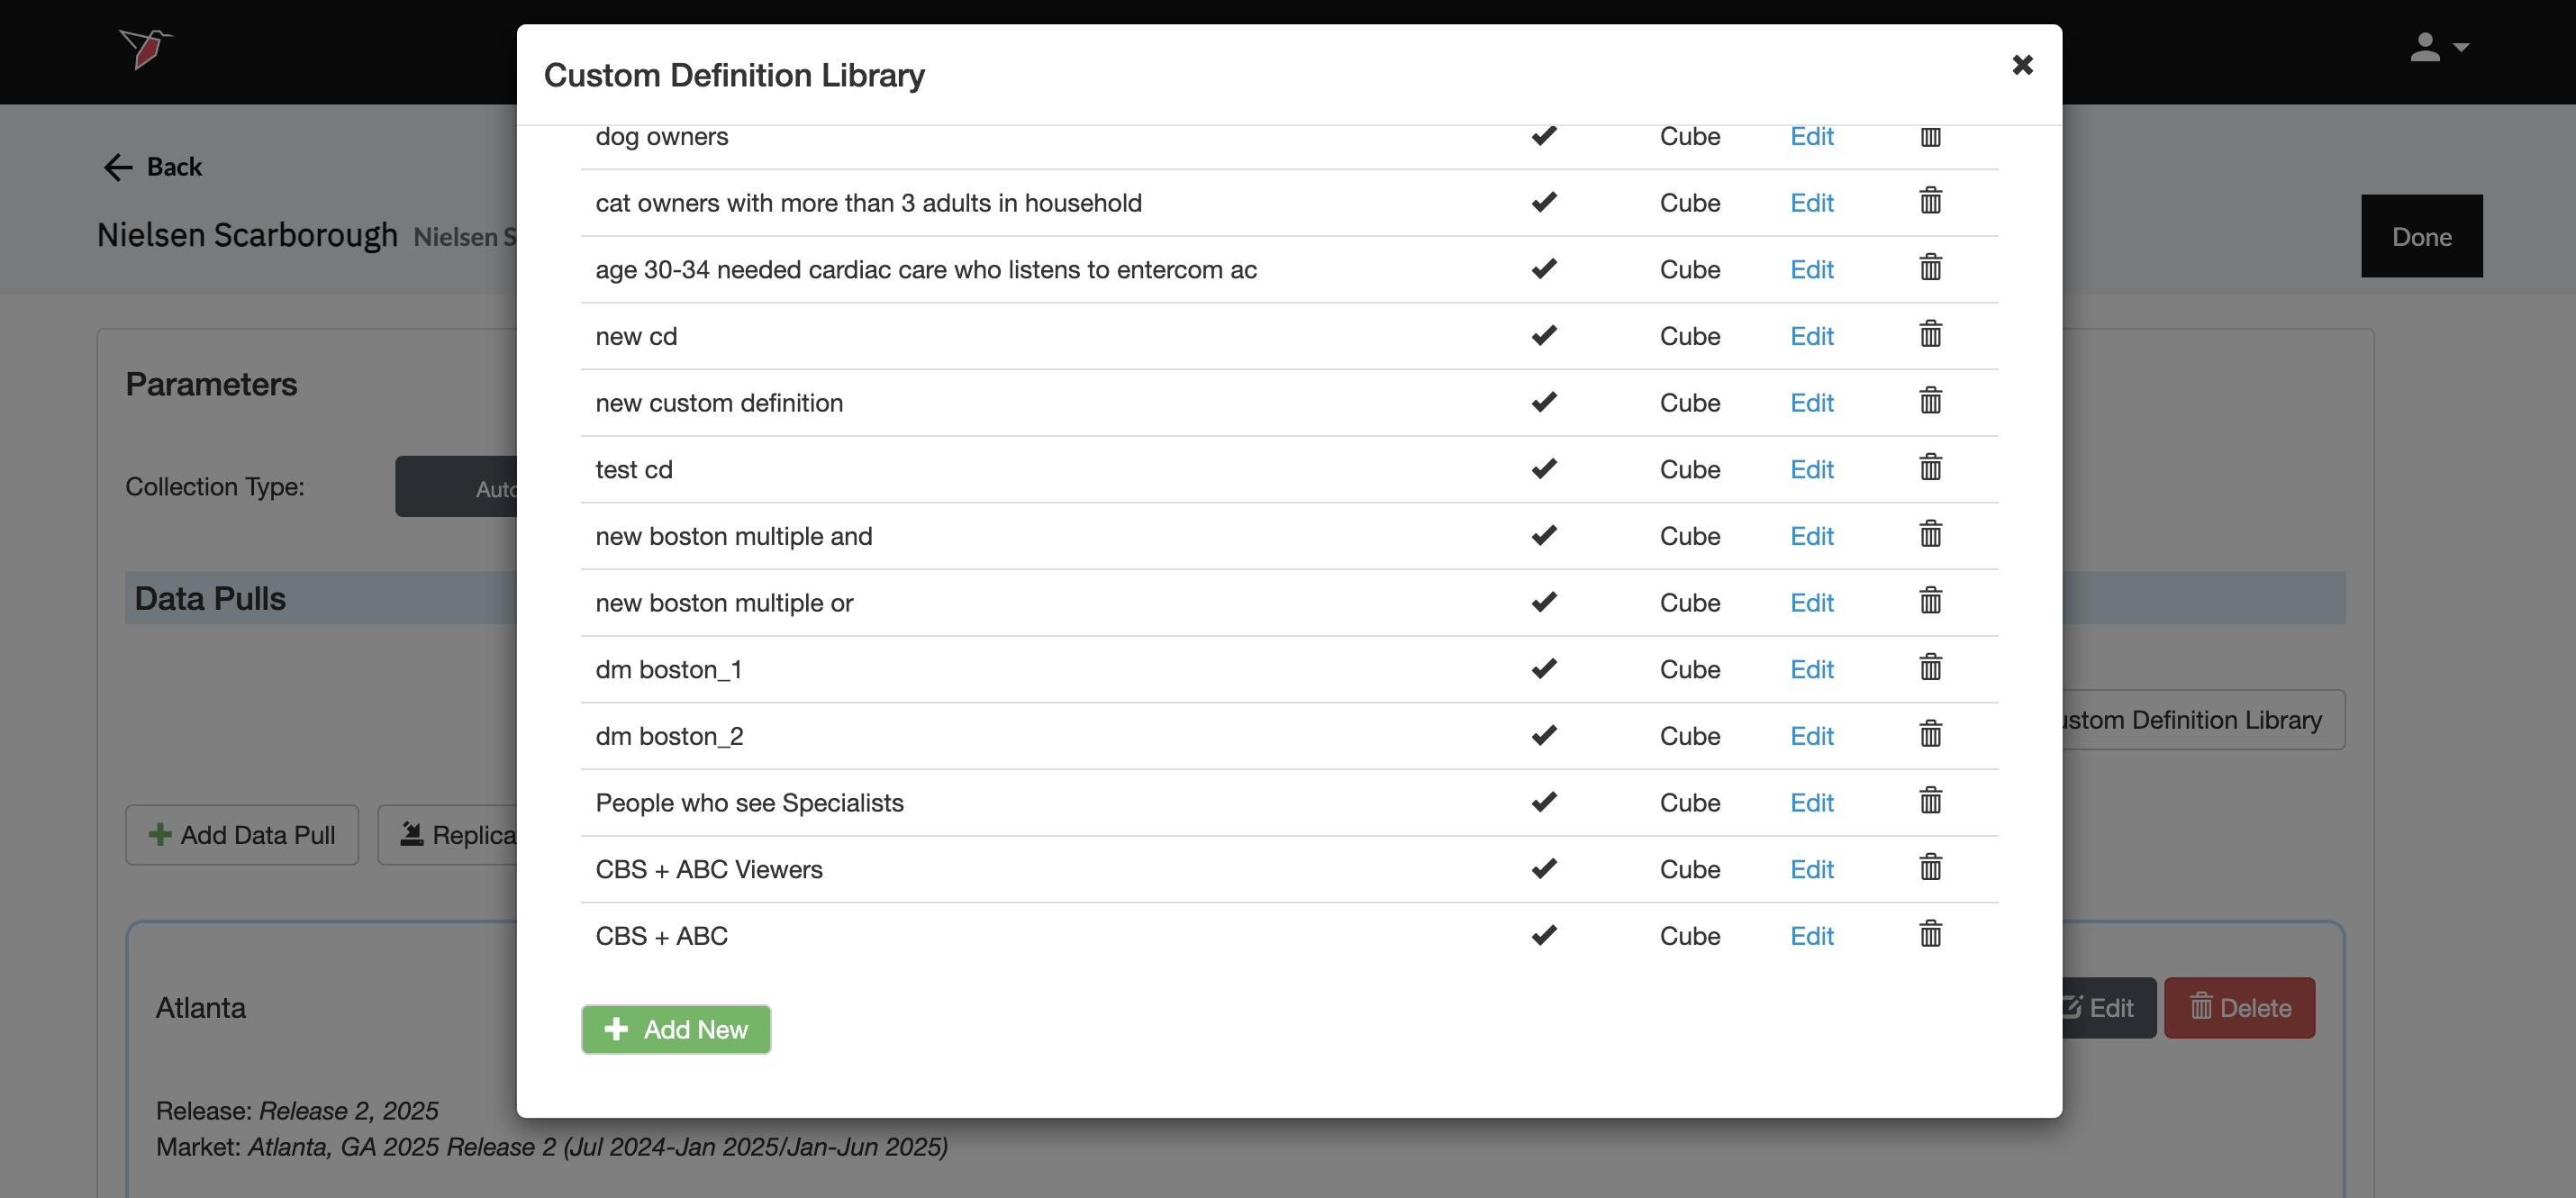
The Custom Definition Library allows you to create new audience definitions combining multiple question responses using Boolean logic.
- Click Custom Definition Library on the main configuration page. You will see any existing custom definitions listed on the next screen which you can edit or delete.
- Click Add New to create a new one
-
Name your definitions, then in the custom definition box:
- Use "" (curly brackets) to insert questions (then select release, regional market and metrics)
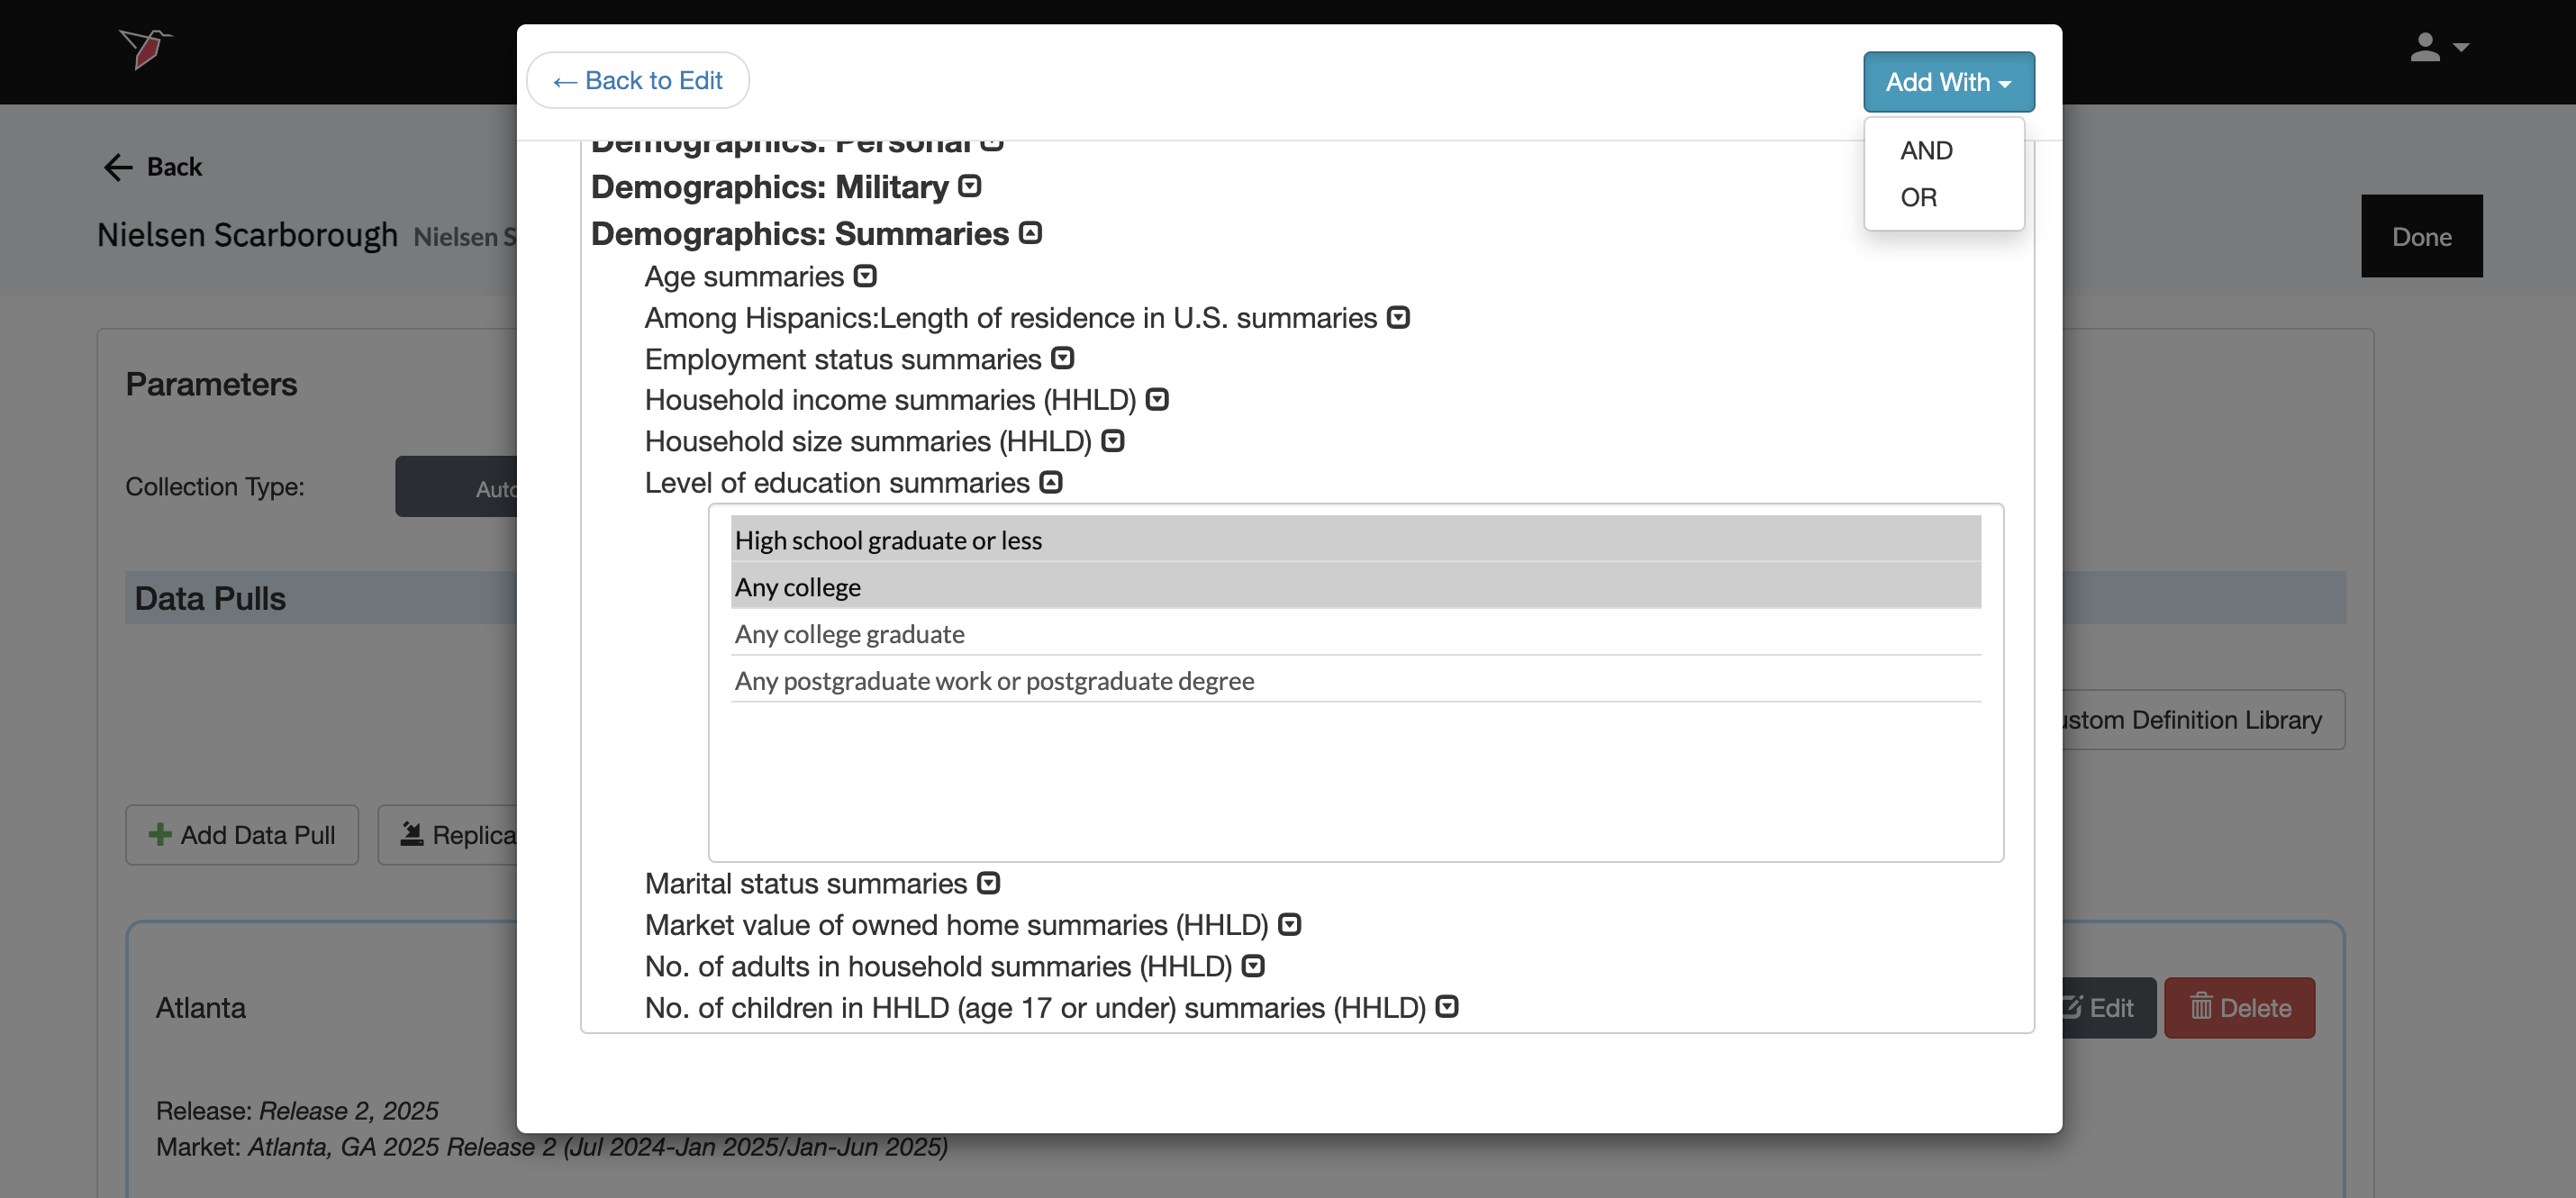
- Add the metric by clicking Add With button. This will determine whether than specific metric gets added with AND or OR logic in between each question response that is added when multiple responses are selected.
You can repeat the last two steps to continue to add multiple responses from different questions to your custom logic. Be sure to use round brackets "( )" around any responses that you want to group together if combining AND and OR logic.
Click Save when your custom definition is complete and you will see it has been added to the list of custom definitions.
- Custom definitions are available to select in data pulls under the Custom Definitions section of the survey map alongside the predefined questions and responses available.
If a metric has been added to a configuration but is no longer available (for example, if it was removed from the most recent survey wave), it will be highlighted in red when the data is refreshed. An error message will appear indicating the issue, and the metric must be removed from the configuration or updated if it is a custom metric.
General Settings
- Update Method allows you to select how you want your data to aggregate when you run future data pulls. Append keeps the historical data and adds the future data pulls below. Replace deletes the historical data and generates the new data in its place.
- Initial Data Load allows you to upload historical data in bulk as a one-off in the event that you have the data saved on your computer. You can upload your data as a CSV file with no leading/trailing rows or columns and Redbird will run future data collections using the configuration that you set up in previous steps.
- Click Done
Running a Collection
- Click on the node.
- In the right-side panel click Run
Updated 5 months ago